
|
|||||
|
 | |
| |
| |
| |
| |
| |
|
Gene: GSTK1 |
Gene summary for GSTK1 |
| Gene information | Species | Human | Gene symbol | GSTK1 | Gene ID | 373156 |
| Gene name | glutathione S-transferase kappa 1 | |
| Gene Alias | GST | |
| Cytomap | 7q34 | |
| Gene Type | protein-coding | GO ID | GO:0006518 | UniProtAcc | Q9Y2Q3 |
Top |
Malignant transformation analysis |
| Identification of the aberrant gene expression in precancerous and cancerous lesions by comparing the gene expression of stem-like cells in diseased tissues with normal stem cells |
| Entrez ID | Symbol | Replicates | Species | Organ | Tissue | Adj P-value | Log2FC | Malignancy |
| 373156 | GSTK1 | CA_HPV_1 | Human | Cervix | CC | 4.62e-09 | -2.99e-01 | 0.0264 |
| 373156 | GSTK1 | N_HPV_1 | Human | Cervix | N_HPV | 2.43e-05 | -2.84e-01 | 0.0079 |
| 373156 | GSTK1 | CCI_1 | Human | Cervix | CC | 3.09e-09 | -7.26e-01 | 0.528 |
| 373156 | GSTK1 | CCI_2 | Human | Cervix | CC | 1.16e-05 | -6.61e-01 | 0.5249 |
| 373156 | GSTK1 | CCI_3 | Human | Cervix | CC | 4.26e-09 | -6.70e-01 | 0.516 |
| 373156 | GSTK1 | CCII_1 | Human | Cervix | CC | 7.24e-12 | -6.58e-01 | 0.3249 |
| 373156 | GSTK1 | T3 | Human | Cervix | CC | 2.55e-02 | -2.36e-01 | 0.1389 |
| 373156 | GSTK1 | HTA11_2487_2000001011 | Human | Colorectum | SER | 3.43e-06 | 6.07e-01 | -0.1808 |
| 373156 | GSTK1 | HTA11_1938_2000001011 | Human | Colorectum | AD | 4.71e-09 | 6.36e-01 | -0.0811 |
| 373156 | GSTK1 | HTA11_347_2000001011 | Human | Colorectum | AD | 2.29e-10 | 5.47e-01 | -0.1954 |
| 373156 | GSTK1 | HTA11_696_2000001011 | Human | Colorectum | AD | 1.75e-08 | 4.72e-01 | -0.1464 |
| 373156 | GSTK1 | HTA11_1391_2000001011 | Human | Colorectum | AD | 1.47e-11 | 7.82e-01 | -0.059 |
| 373156 | GSTK1 | HTA11_9408_2000001011 | Human | Colorectum | AD | 9.38e-03 | 7.57e-01 | 0.0451 |
| 373156 | GSTK1 | A015-C-203 | Human | Colorectum | FAP | 8.46e-15 | -2.35e-01 | -0.1294 |
| 373156 | GSTK1 | A002-C-201 | Human | Colorectum | FAP | 1.26e-04 | -2.35e-01 | 0.0324 |
| 373156 | GSTK1 | A001-C-119 | Human | Colorectum | FAP | 1.65e-02 | -2.47e-01 | -0.1557 |
| 373156 | GSTK1 | A001-C-108 | Human | Colorectum | FAP | 1.18e-07 | -1.56e-01 | -0.0272 |
| 373156 | GSTK1 | A002-C-205 | Human | Colorectum | FAP | 2.32e-08 | -2.60e-01 | -0.1236 |
| 373156 | GSTK1 | A001-C-104 | Human | Colorectum | FAP | 2.18e-02 | -5.98e-02 | 0.0184 |
| 373156 | GSTK1 | A015-C-006 | Human | Colorectum | FAP | 1.26e-04 | -1.84e-01 | -0.0994 |
| Page: 1 2 3 4 5 6 7 8 9 10 11 12 |
| Tissue | Expression Dynamics | Abbreviation |
| Cervix | 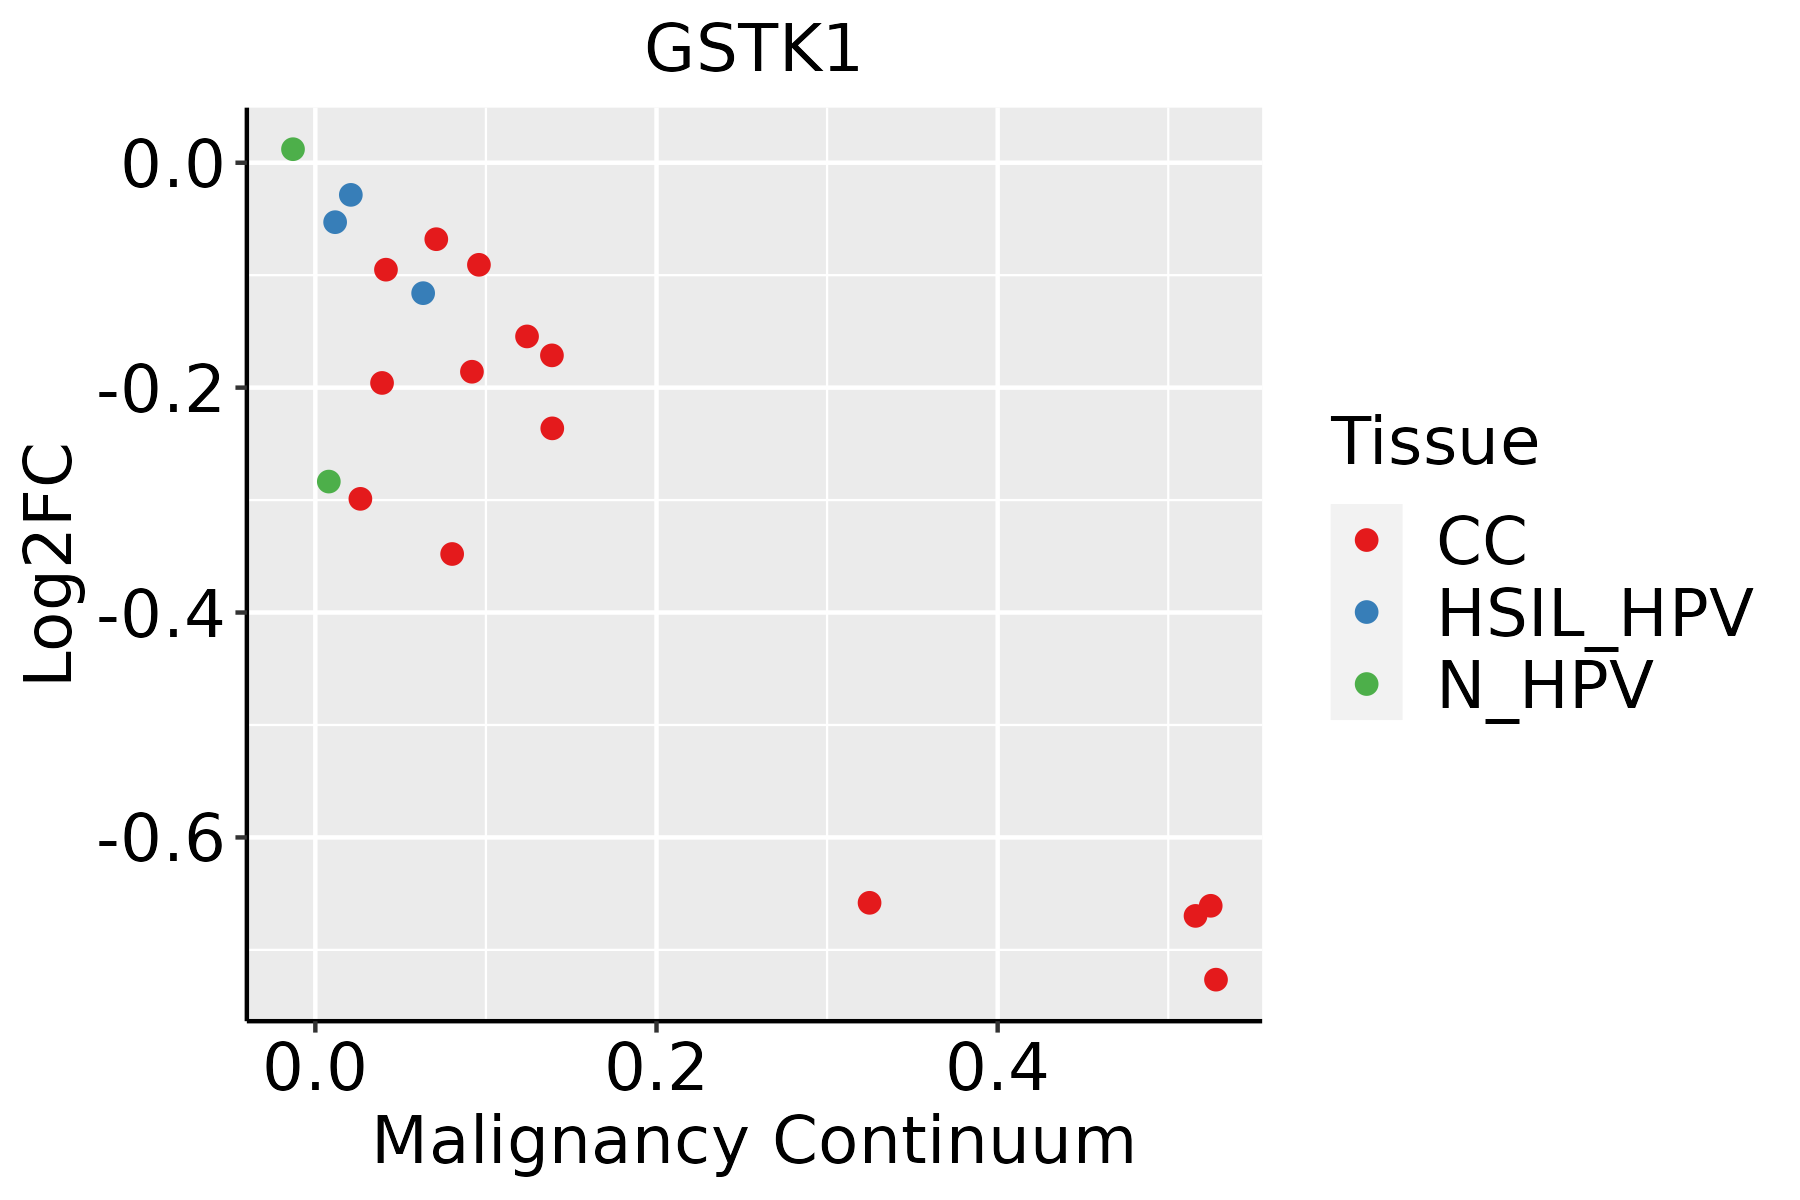 | CC: Cervix cancer |
| HSIL_HPV: HPV-infected high-grade squamous intraepithelial lesions | ||
| N_HPV: HPV-infected normal cervix | ||
| Colorectum (GSE201348) |  | FAP: Familial adenomatous polyposis |
| CRC: Colorectal cancer | ||
| Colorectum (HTA11) |  | AD: Adenomas |
| SER: Sessile serrated lesions | ||
| MSI-H: Microsatellite-high colorectal cancer | ||
| MSS: Microsatellite stable colorectal cancer | ||
| Endometrium |  | AEH: Atypical endometrial hyperplasia |
| EEC: Endometrioid Cancer | ||
| Esophagus |  | ESCC: Esophageal squamous cell carcinoma |
| HGIN: High-grade intraepithelial neoplasias | ||
| LGIN: Low-grade intraepithelial neoplasias | ||
| GC | 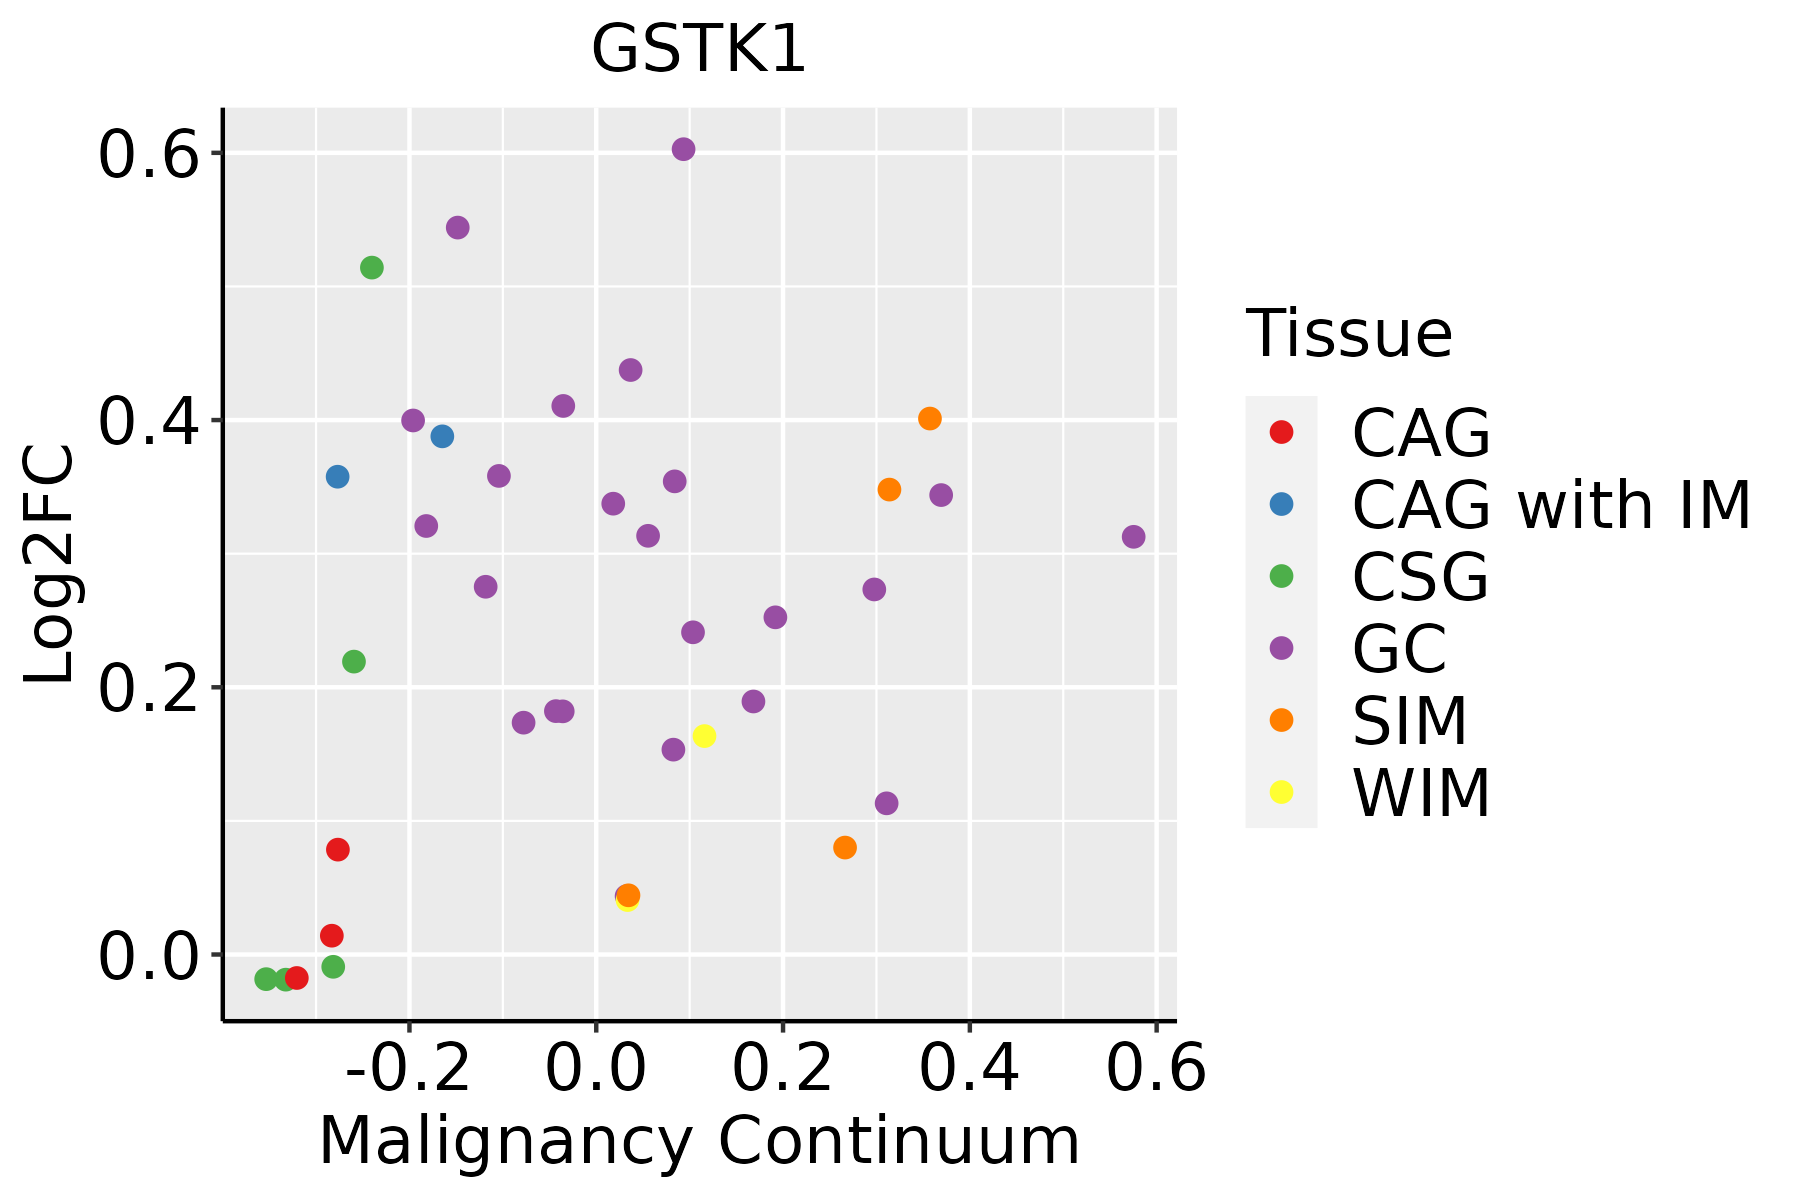 | CAG: Chronic atrophic gastritis |
| CAG with IM: Chronic atrophic gastritis with intestinal metaplasia | ||
| CSG: Chronic superficial gastritis | ||
| GC: Gastric cancer | ||
| SIM: Severe intestinal metaplasia | ||
| WIM: Wild intestinal metaplasia | ||
| Liver | 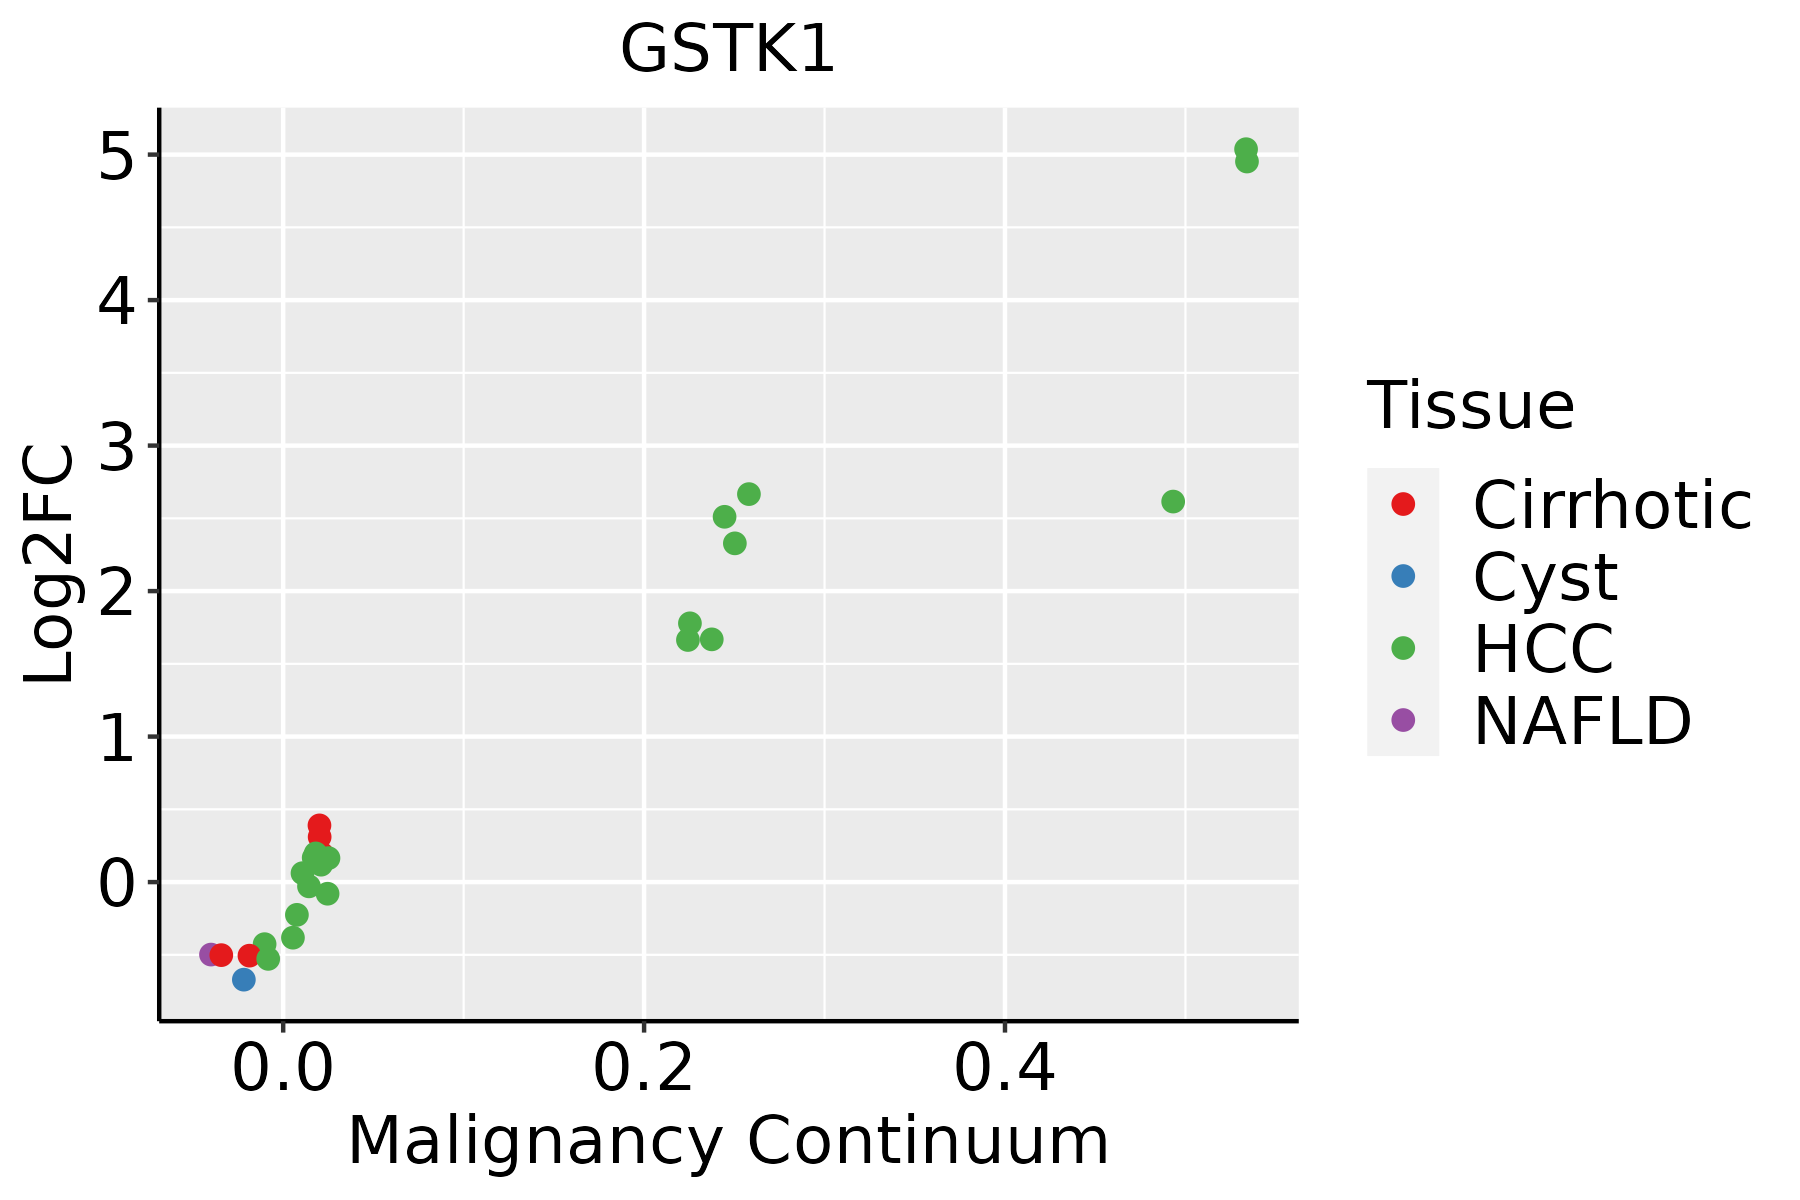 | HCC: Hepatocellular carcinoma |
| NAFLD: Non-alcoholic fatty liver disease | ||
| Oral Cavity |  | EOLP: Erosive Oral lichen planus |
| LP: leukoplakia | ||
| NEOLP: Non-erosive oral lichen planus | ||
| OSCC: Oral squamous cell carcinoma | ||
| Prostate | 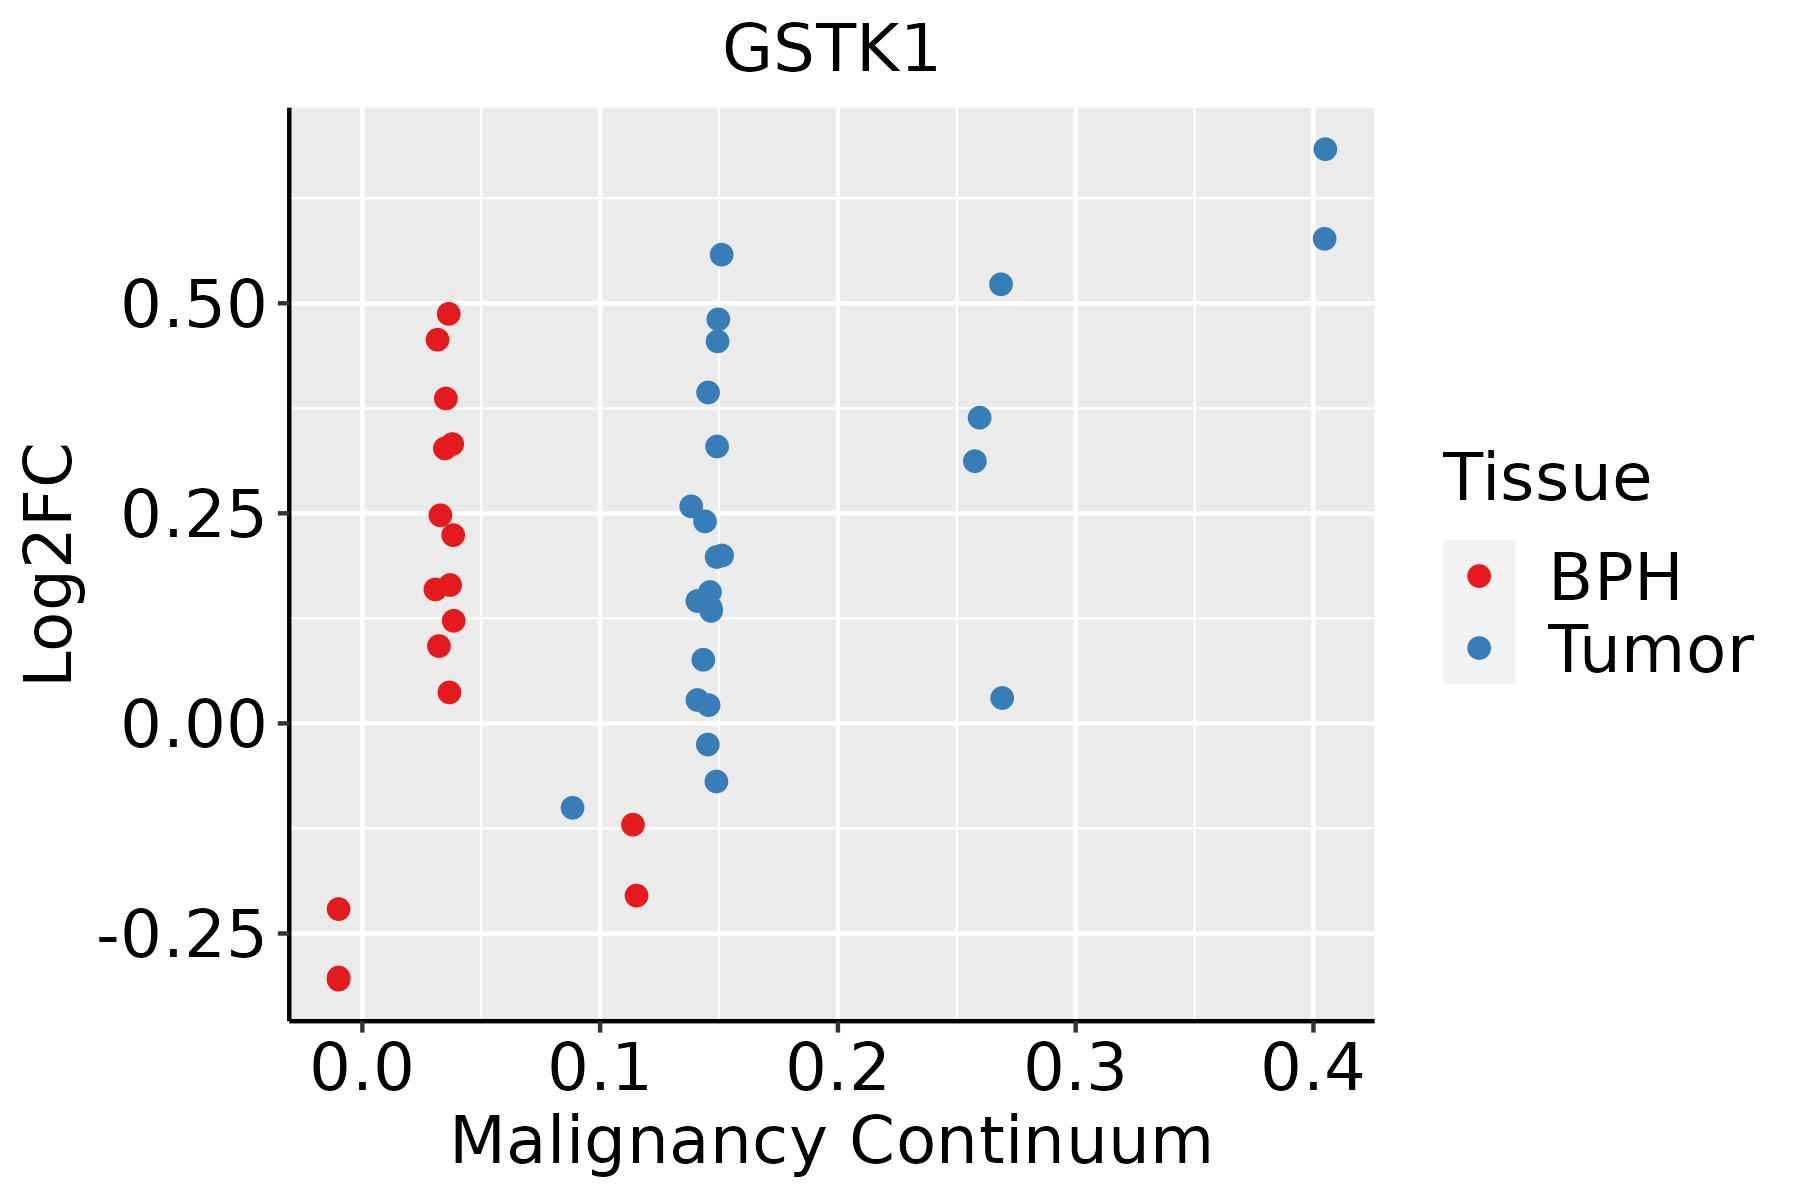 | BPH: Benign Prostatic Hyperplasia |
| Skin |  | AK: Actinic keratosis |
| cSCC: Cutaneous squamous cell carcinoma | ||
| SCCIS:squamous cell carcinoma in situ | ||
| Thyroid |  | ATC: Anaplastic thyroid cancer |
| HT: Hashimoto's thyroiditis | ||
| PTC: Papillary thyroid cancer |
| ∗log2FC in expression of this searched gene in stem-like cells from each diseased tissue sample relative to stem-like cells in normal samples in each tissue plotted against the malignancy continuum. Samples are colored based on if they are from different disease stage. |
Top |
Malignant transformation related pathway analysis |
| Find out the enriched GO biological processes and KEGG pathways involved in transition from healthy to precancer to cancer |
| Tissue | Disease Stage | Enriched GO biological Processes |
| Colorectum | AD |  |
| Colorectum | SER |  |
| Colorectum | MSS |  |
| Colorectum | MSI-H |  |
| Colorectum | FAP |  |
| ∗Top 15 enriched GO BP terms are showed in the bar plot of each disease state in each tissue. Each row represents a significant GO biological process which is colored according to the -log10(p.adjust). |
| Page: 1 2 3 4 5 6 7 8 9 |
| GO ID | Tissue | Disease Stage | Description | Gene Ratio | Bg Ratio | pvalue | p.adjust | Count |
| GO:00988699 | Cervix | CC | cellular oxidant detoxification | 30/2311 | 101/18723 | 2.72e-06 | 7.93e-05 | 30 |
| GO:19907489 | Cervix | CC | cellular detoxification | 30/2311 | 116/18723 | 5.34e-05 | 7.94e-04 | 30 |
| GO:00972379 | Cervix | CC | cellular response to toxic substance | 31/2311 | 124/18723 | 8.09e-05 | 1.10e-03 | 31 |
| GO:00096369 | Cervix | CC | response to toxic substance | 52/2311 | 262/18723 | 3.34e-04 | 3.52e-03 | 52 |
| GO:00987549 | Cervix | CC | detoxification | 33/2311 | 152/18723 | 7.97e-04 | 7.00e-03 | 33 |
| GO:000963624 | Cervix | N_HPV | response to toxic substance | 27/534 | 262/18723 | 9.00e-09 | 1.71e-06 | 27 |
| GO:009886924 | Cervix | N_HPV | cellular oxidant detoxification | 13/534 | 101/18723 | 5.89e-06 | 2.15e-04 | 13 |
| GO:009723724 | Cervix | N_HPV | cellular response to toxic substance | 14/534 | 124/18723 | 1.22e-05 | 4.06e-04 | 14 |
| GO:199074824 | Cervix | N_HPV | cellular detoxification | 13/534 | 116/18723 | 2.69e-05 | 7.30e-04 | 13 |
| GO:009875424 | Cervix | N_HPV | detoxification | 15/534 | 152/18723 | 3.05e-05 | 8.02e-04 | 15 |
| GO:0009636 | Colorectum | AD | response to toxic substance | 88/3918 | 262/18723 | 1.12e-06 | 3.72e-05 | 88 |
| GO:0098754 | Colorectum | AD | detoxification | 53/3918 | 152/18723 | 4.63e-05 | 7.98e-04 | 53 |
| GO:0006790 | Colorectum | AD | sulfur compound metabolic process | 101/3918 | 339/18723 | 6.46e-05 | 1.07e-03 | 101 |
| GO:0097237 | Colorectum | AD | cellular response to toxic substance | 44/3918 | 124/18723 | 1.24e-04 | 1.80e-03 | 44 |
| GO:1990748 | Colorectum | AD | cellular detoxification | 41/3918 | 116/18723 | 2.29e-04 | 2.97e-03 | 41 |
| GO:0006575 | Colorectum | AD | cellular modified amino acid metabolic process | 59/3918 | 188/18723 | 4.80e-04 | 5.27e-03 | 59 |
| GO:0098869 | Colorectum | AD | cellular oxidant detoxification | 33/3918 | 101/18723 | 3.88e-03 | 2.72e-02 | 33 |
| GO:00096361 | Colorectum | SER | response to toxic substance | 71/2897 | 262/18723 | 8.63e-07 | 4.07e-05 | 71 |
| GO:00972371 | Colorectum | SER | cellular response to toxic substance | 40/2897 | 124/18723 | 2.28e-06 | 9.43e-05 | 40 |
| GO:00987541 | Colorectum | SER | detoxification | 46/2897 | 152/18723 | 3.02e-06 | 1.20e-04 | 46 |
| Page: 1 2 3 4 5 6 7 8 |
| Pathway ID | Tissue | Disease Stage | Description | Gene Ratio | Bg Ratio | pvalue | p.adjust | qvalue | Count |
| hsa00480 | Colorectum | AD | Glutathione metabolism | 23/2092 | 57/8465 | 6.52e-03 | 2.76e-02 | 1.76e-02 | 23 |
| hsa004801 | Colorectum | AD | Glutathione metabolism | 23/2092 | 57/8465 | 6.52e-03 | 2.76e-02 | 1.76e-02 | 23 |
| hsa0048018 | Esophagus | ESCC | Glutathione metabolism | 44/4205 | 57/8465 | 1.81e-05 | 9.03e-05 | 4.63e-05 | 44 |
| hsa041467 | Esophagus | ESCC | Peroxisome | 55/4205 | 82/8465 | 1.04e-03 | 3.27e-03 | 1.68e-03 | 55 |
| hsa0048019 | Esophagus | ESCC | Glutathione metabolism | 44/4205 | 57/8465 | 1.81e-05 | 9.03e-05 | 4.63e-05 | 44 |
| hsa0414612 | Esophagus | ESCC | Peroxisome | 55/4205 | 82/8465 | 1.04e-03 | 3.27e-03 | 1.68e-03 | 55 |
| hsa004809 | Liver | Cirrhotic | Glutathione metabolism | 30/2530 | 57/8465 | 2.63e-04 | 1.72e-03 | 1.06e-03 | 30 |
| hsa041462 | Liver | Cirrhotic | Peroxisome | 36/2530 | 82/8465 | 4.79e-03 | 1.74e-02 | 1.07e-02 | 36 |
| hsa0048012 | Liver | Cirrhotic | Glutathione metabolism | 30/2530 | 57/8465 | 2.63e-04 | 1.72e-03 | 1.06e-03 | 30 |
| hsa041463 | Liver | Cirrhotic | Peroxisome | 36/2530 | 82/8465 | 4.79e-03 | 1.74e-02 | 1.07e-02 | 36 |
| hsa041464 | Liver | HCC | Peroxisome | 58/4020 | 82/8465 | 1.57e-05 | 1.05e-04 | 5.85e-05 | 58 |
| hsa0048022 | Liver | HCC | Glutathione metabolism | 42/4020 | 57/8465 | 5.00e-05 | 2.62e-04 | 1.46e-04 | 42 |
| hsa041465 | Liver | HCC | Peroxisome | 58/4020 | 82/8465 | 1.57e-05 | 1.05e-04 | 5.85e-05 | 58 |
| hsa0048032 | Liver | HCC | Glutathione metabolism | 42/4020 | 57/8465 | 5.00e-05 | 2.62e-04 | 1.46e-04 | 42 |
| hsa0048016 | Oral cavity | OSCC | Glutathione metabolism | 36/3704 | 57/8465 | 2.41e-03 | 6.41e-03 | 3.26e-03 | 36 |
| hsa041466 | Oral cavity | OSCC | Peroxisome | 47/3704 | 82/8465 | 9.01e-03 | 2.01e-02 | 1.03e-02 | 47 |
| hsa0048017 | Oral cavity | OSCC | Glutathione metabolism | 36/3704 | 57/8465 | 2.41e-03 | 6.41e-03 | 3.26e-03 | 36 |
| hsa0414611 | Oral cavity | OSCC | Peroxisome | 47/3704 | 82/8465 | 9.01e-03 | 2.01e-02 | 1.03e-02 | 47 |
| hsa0048024 | Oral cavity | LP | Glutathione metabolism | 25/2418 | 57/8465 | 9.58e-03 | 3.47e-02 | 2.24e-02 | 25 |
| hsa0414621 | Oral cavity | LP | Peroxisome | 33/2418 | 82/8465 | 1.48e-02 | 4.69e-02 | 3.03e-02 | 33 |
| Page: 1 2 |
Top |
Cell-cell communication analysis |
| Identification of potential cell-cell interactions between two cell types and their ligand-receptor pairs for different disease states |
| Ligand | Receptor | LRpair | Pathway | Tissue | Disease Stage |
| Page: 1 |
Top |
Single-cell gene regulatory network inference analysis |
| Find out the significant the regulons (TFs) and the target genes of each regulon across cell types for different disease states |
| TF | Cell Type | Tissue | Disease Stage | Target Gene | RSS | Regulon Activity |
| ∗The dot plots of a searched regulon are shown for all cell subpopulations in each disease state of each tissue based on the regulon specific score inferred using pySCENIC and by calculating the average expression. |
| Page: 1 |
Top |
Somatic mutation of malignant transformation related genes |
| Annotation of somatic variants for genes involved in malignant transformation |
| Hugo Symbol | Variant Class | Variant Classification | dbSNP RS | HGVSc | HGVSp | HGVSp Short | SWISSPROT | BIOTYPE | SIFT | PolyPhen | Tumor Sample Barcode | Tissue | Histology | Sex | Age | Stage | Therapy Types | Drugs | Outcome |
| GSTK1 | SNV | Missense_Mutation | rs773083480 | c.493G>A | p.Val165Ile | p.V165I | Q9Y2Q3 | protein_coding | tolerated_low_confidence(0.98) | benign(0) | TCGA-A8-A09Z-01 | Breast | breast invasive carcinoma | Female | >=65 | I/II | Unknown | Unknown | SD |
| GSTK1 | SNV | Missense_Mutation | c.277N>C | p.Glu93Gln | p.E93Q | Q9Y2Q3 | protein_coding | tolerated(0.26) | benign(0.026) | TCGA-B6-A0RS-01 | Breast | breast invasive carcinoma | Female | <65 | I/II | Unknown | Unknown | PD | |
| GSTK1 | SNV | Missense_Mutation | c.523N>T | p.Arg175Cys | p.R175C | Q9Y2Q3 | protein_coding | tolerated(0.06) | benign(0) | TCGA-E2-A1LG-01 | Breast | breast invasive carcinoma | Female | <65 | I/II | Chemotherapy | doxorubicin | SD | |
| GSTK1 | insertion | In_Frame_Ins | novel | c.816_817insAGATTAAGA | p.Gly272_Pro273insArgLeuArg | p.G272_P273insRLR | Q9Y2Q3 | protein_coding | TCGA-AO-A0JD-01 | Breast | breast invasive carcinoma | Female | <65 | III/IV | Chemotherapy | cyclophosphamide | SD | ||
| GSTK1 | insertion | Nonsense_Mutation | novel | c.817_818insCATCCTGGCCAACATGGTGAAACCCCGTCT | p.Pro273_Ile274insSerTrpProThrTrpTerAsnProValSer | p.P273_I274insSWPTW*NPVS | Q9Y2Q3 | protein_coding | TCGA-AO-A0JD-01 | Breast | breast invasive carcinoma | Female | <65 | III/IV | Chemotherapy | cyclophosphamide | SD | ||
| GSTK1 | deletion | Frame_Shift_Del | novel | c.47delN | p.Tyr18ThrfsTer27 | p.Y18Tfs*27 | Q9Y2Q3 | protein_coding | TCGA-D8-A27V-01 | Breast | breast invasive carcinoma | Female | <65 | I/II | Hormone Therapy | tamoxiphen | SD | ||
| GSTK1 | SNV | Missense_Mutation | novel | c.427N>A | p.Asp143Asn | p.D143N | Q9Y2Q3 | protein_coding | deleterious(0.01) | benign(0.01) | TCGA-VS-A9U6-01 | Cervix | cervical & endocervical cancer | Female | <65 | I/II | Chemotherapy | cisplatin | PD |
| GSTK1 | SNV | Missense_Mutation | c.476N>A | p.Pro159Gln | p.P159Q | Q9Y2Q3 | protein_coding | tolerated_low_confidence(0.07) | benign(0.036) | TCGA-A6-2686-01 | Colorectum | colon adenocarcinoma | Female | >=65 | I/II | Unknown | Unknown | SD | |
| GSTK1 | SNV | Missense_Mutation | rs757110852 | c.373N>A | p.Val125Ile | p.V125I | Q9Y2Q3 | protein_coding | tolerated(1) | benign(0.005) | TCGA-AM-5821-01 | Colorectum | colon adenocarcinoma | Female | >=65 | I/II | Unknown | Unknown | SD |
| GSTK1 | SNV | Missense_Mutation | c.481N>T | p.Gly161Trp | p.G161W | Q9Y2Q3 | protein_coding | deleterious_low_confidence(0.02) | benign(0.352) | TCGA-A5-A0VP-01 | Endometrium | uterine corpus endometrioid carcinoma | Female | >=65 | I/II | Unknown | Unknown | SD |
| Page: 1 2 3 |
Top |
Related drugs of malignant transformation related genes |
| Identification of chemicals and drugs interact with genes involved in malignant transfromation |
| (DGIdb 4.0) |
| Entrez ID | Symbol | Category | Interaction Types | Drug Claim Name | Drug Name | PMIDs |
| Page: 1 |

Copyright 2023-Present -The University of Texas Health Science Center at Houston |