
|
|||||
|
 | |
| |
| |
| |
| |
| |
|
Gene: GSTA4 |
Gene summary for GSTA4 |
| Gene information | Species | Human | Gene symbol | GSTA4 | Gene ID | 2941 |
| Gene name | glutathione S-transferase alpha 4 | |
| Gene Alias | GSTA4-4 | |
| Cytomap | 6p12.2 | |
| Gene Type | protein-coding | GO ID | GO:0006518 | UniProtAcc | A0A024RD58 |
Top |
Malignant transformation analysis |
| Identification of the aberrant gene expression in precancerous and cancerous lesions by comparing the gene expression of stem-like cells in diseased tissues with normal stem cells |
| Entrez ID | Symbol | Replicates | Species | Organ | Tissue | Adj P-value | Log2FC | Malignancy |
| 2941 | GSTA4 | LZE2T | Human | Esophagus | ESCC | 3.61e-09 | 1.49e+00 | 0.082 |
| 2941 | GSTA4 | LZE4T | Human | Esophagus | ESCC | 2.26e-05 | 2.56e-01 | 0.0811 |
| 2941 | GSTA4 | LZE7T | Human | Esophagus | ESCC | 1.19e-10 | 1.06e+00 | 0.0667 |
| 2941 | GSTA4 | LZE24T | Human | Esophagus | ESCC | 2.74e-24 | 1.06e+00 | 0.0596 |
| 2941 | GSTA4 | LZE6T | Human | Esophagus | ESCC | 6.23e-04 | 1.37e-01 | 0.0845 |
| 2941 | GSTA4 | P1T-E | Human | Esophagus | ESCC | 1.68e-04 | 5.11e-01 | 0.0875 |
| 2941 | GSTA4 | P2T-E | Human | Esophagus | ESCC | 1.60e-21 | 4.62e-01 | 0.1177 |
| 2941 | GSTA4 | P4T-E | Human | Esophagus | ESCC | 4.25e-51 | 1.36e+00 | 0.1323 |
| 2941 | GSTA4 | P5T-E | Human | Esophagus | ESCC | 3.19e-04 | 3.82e-02 | 0.1327 |
| 2941 | GSTA4 | P8T-E | Human | Esophagus | ESCC | 6.23e-12 | 2.46e-01 | 0.0889 |
| 2941 | GSTA4 | P9T-E | Human | Esophagus | ESCC | 1.42e-29 | 7.45e-01 | 0.1131 |
| 2941 | GSTA4 | P10T-E | Human | Esophagus | ESCC | 1.10e-51 | 1.03e+00 | 0.116 |
| 2941 | GSTA4 | P11T-E | Human | Esophagus | ESCC | 2.39e-04 | 3.38e-02 | 0.1426 |
| 2941 | GSTA4 | P12T-E | Human | Esophagus | ESCC | 3.75e-61 | 1.50e+00 | 0.1122 |
| 2941 | GSTA4 | P15T-E | Human | Esophagus | ESCC | 7.50e-16 | 4.91e-01 | 0.1149 |
| 2941 | GSTA4 | P16T-E | Human | Esophagus | ESCC | 3.53e-49 | 1.11e+00 | 0.1153 |
| 2941 | GSTA4 | P20T-E | Human | Esophagus | ESCC | 6.21e-26 | 7.84e-01 | 0.1124 |
| 2941 | GSTA4 | P21T-E | Human | Esophagus | ESCC | 1.64e-15 | 3.58e-01 | 0.1617 |
| 2941 | GSTA4 | P22T-E | Human | Esophagus | ESCC | 5.93e-61 | 1.19e+00 | 0.1236 |
| 2941 | GSTA4 | P23T-E | Human | Esophagus | ESCC | 2.26e-23 | 7.95e-01 | 0.108 |
| Page: 1 2 3 4 5 |
| Tissue | Expression Dynamics | Abbreviation |
| Esophagus | 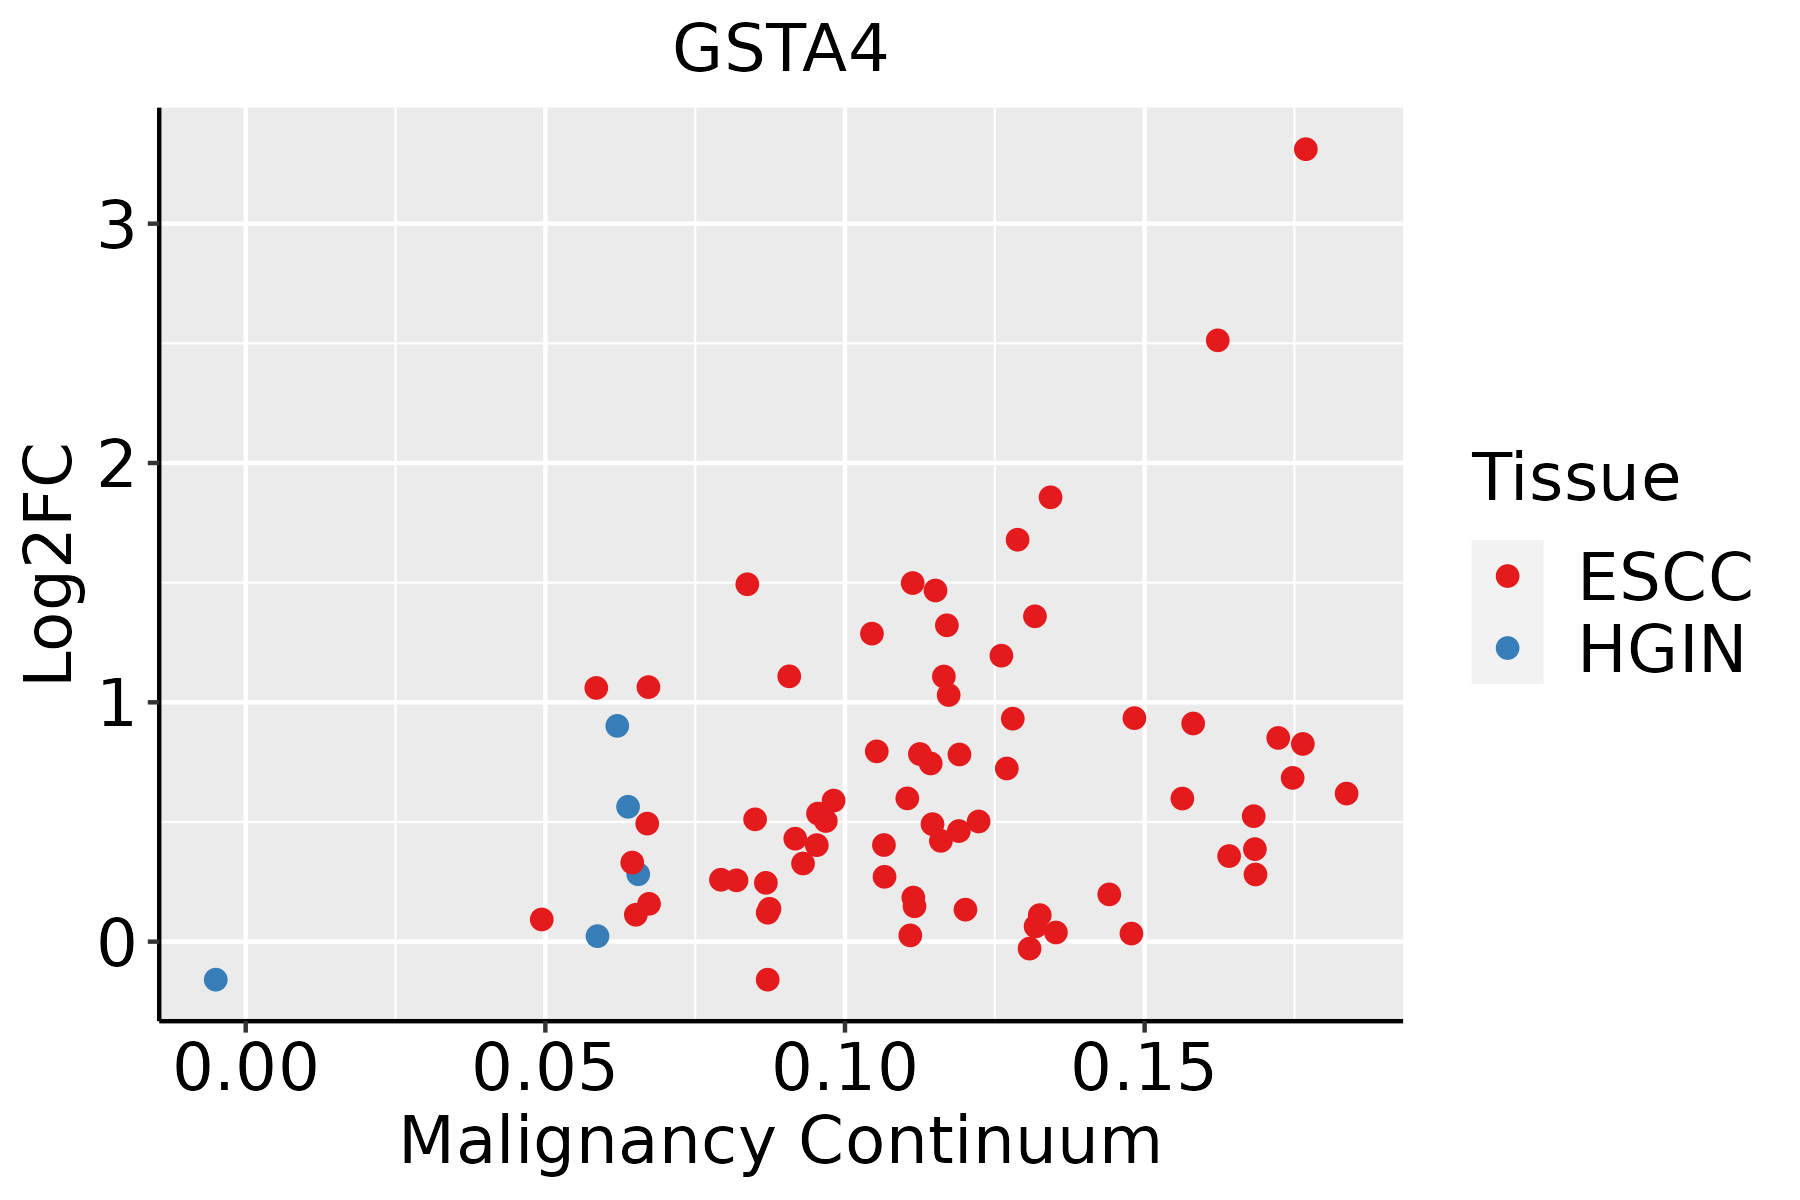 | ESCC: Esophageal squamous cell carcinoma |
| HGIN: High-grade intraepithelial neoplasias | ||
| LGIN: Low-grade intraepithelial neoplasias | ||
| Oral Cavity |  | EOLP: Erosive Oral lichen planus |
| LP: leukoplakia | ||
| NEOLP: Non-erosive oral lichen planus | ||
| OSCC: Oral squamous cell carcinoma | ||
| Skin | 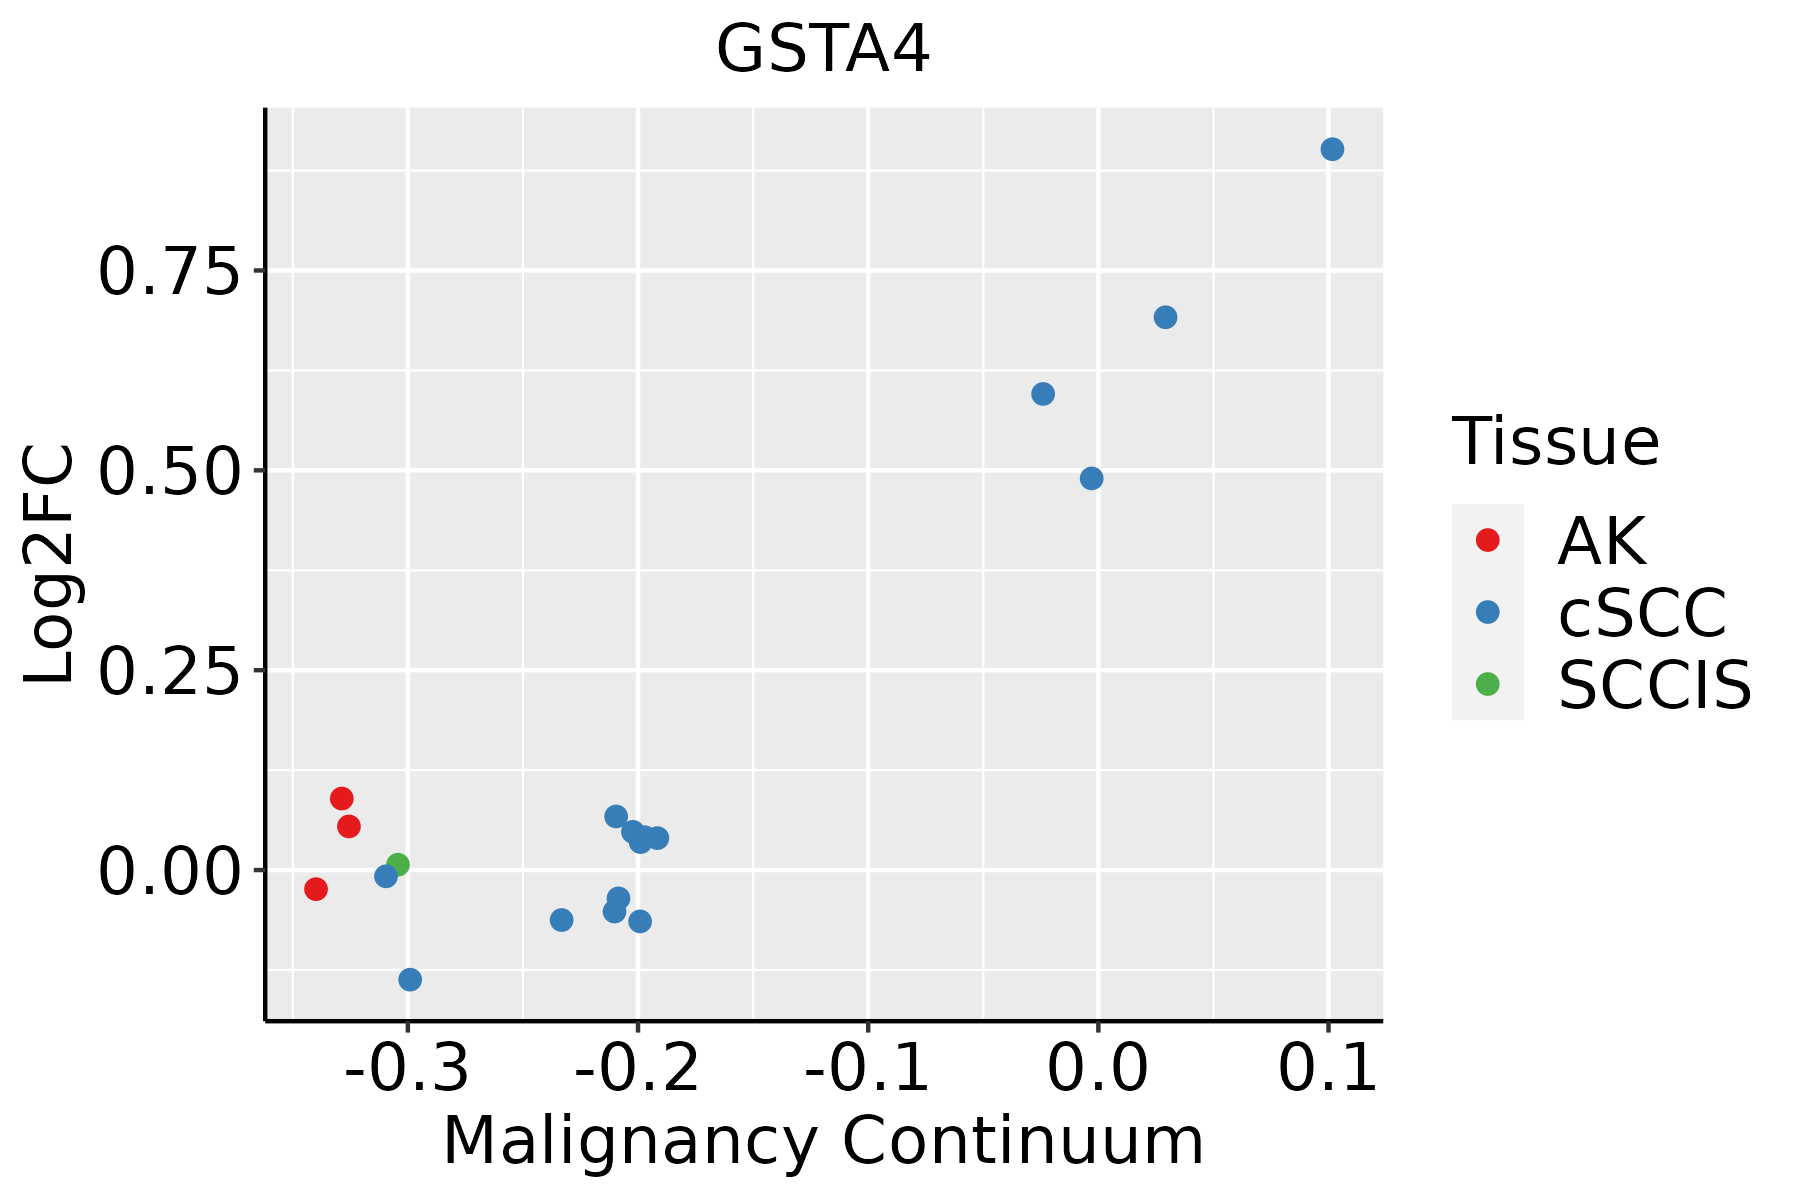 | AK: Actinic keratosis |
| cSCC: Cutaneous squamous cell carcinoma | ||
| SCCIS:squamous cell carcinoma in situ | ||
| Thyroid |  | ATC: Anaplastic thyroid cancer |
| HT: Hashimoto's thyroiditis | ||
| PTC: Papillary thyroid cancer |
| ∗log2FC in expression of this searched gene in stem-like cells from each diseased tissue sample relative to stem-like cells in normal samples in each tissue plotted against the malignancy continuum. Samples are colored based on if they are from different disease stage. |
Top |
Malignant transformation related pathway analysis |
| Find out the enriched GO biological processes and KEGG pathways involved in transition from healthy to precancer to cancer |
| Tissue | Disease Stage | Enriched GO biological Processes |
| Colorectum | AD |  |
| Colorectum | SER |  |
| Colorectum | MSS |  |
| Colorectum | MSI-H |  |
| Colorectum | FAP |  |
| ∗Top 15 enriched GO BP terms are showed in the bar plot of each disease state in each tissue. Each row represents a significant GO biological process which is colored according to the -log10(p.adjust). |
| Page: 1 2 3 4 5 6 7 8 9 |
| GO ID | Tissue | Disease Stage | Description | Gene Ratio | Bg Ratio | pvalue | p.adjust | Count |
| GO:00067906 | Esophagus | ESCC | sulfur compound metabolic process | 201/8552 | 339/18723 | 2.64e-07 | 3.94e-06 | 201 |
| GO:000941020 | Esophagus | ESCC | response to xenobiotic stimulus | 253/8552 | 462/18723 | 4.55e-05 | 3.58e-04 | 253 |
| GO:00065757 | Esophagus | ESCC | cellular modified amino acid metabolic process | 112/8552 | 188/18723 | 8.31e-05 | 6.06e-04 | 112 |
| GO:000674912 | Esophagus | ESCC | glutathione metabolic process | 42/8552 | 64/18723 | 1.01e-03 | 5.12e-03 | 42 |
| GO:000941018 | Oral cavity | OSCC | response to xenobiotic stimulus | 222/7305 | 462/18723 | 4.00e-05 | 3.48e-04 | 222 |
| GO:00067905 | Oral cavity | OSCC | sulfur compound metabolic process | 168/7305 | 339/18723 | 4.50e-05 | 3.84e-04 | 168 |
| GO:00065756 | Oral cavity | OSCC | cellular modified amino acid metabolic process | 91/7305 | 188/18723 | 5.33e-03 | 2.07e-02 | 91 |
| GO:000941019 | Oral cavity | LP | response to xenobiotic stimulus | 141/4623 | 462/18723 | 2.33e-03 | 1.68e-02 | 141 |
| GO:000657512 | Oral cavity | LP | cellular modified amino acid metabolic process | 64/4623 | 188/18723 | 2.43e-03 | 1.73e-02 | 64 |
| GO:000679012 | Oral cavity | LP | sulfur compound metabolic process | 106/4623 | 339/18723 | 3.36e-03 | 2.25e-02 | 106 |
| GO:00065758 | Skin | cSCC | cellular modified amino acid metabolic process | 73/4864 | 188/18723 | 7.11e-05 | 6.85e-04 | 73 |
| GO:0009410110 | Skin | cSCC | response to xenobiotic stimulus | 151/4864 | 462/18723 | 6.76e-04 | 4.82e-03 | 151 |
| GO:00067498 | Skin | cSCC | glutathione metabolic process | 26/4864 | 64/18723 | 7.34e-03 | 3.47e-02 | 26 |
| GO:000657513 | Thyroid | PTC | cellular modified amino acid metabolic process | 85/5968 | 188/18723 | 8.29e-05 | 7.01e-04 | 85 |
| GO:0009410111 | Thyroid | PTC | response to xenobiotic stimulus | 171/5968 | 462/18723 | 1.00e-02 | 4.07e-02 | 171 |
| GO:000657522 | Thyroid | ATC | cellular modified amino acid metabolic process | 82/6293 | 188/18723 | 2.60e-03 | 1.20e-02 | 82 |
| GO:000941027 | Thyroid | ATC | response to xenobiotic stimulus | 184/6293 | 462/18723 | 2.70e-03 | 1.23e-02 | 184 |
| Page: 1 |
| Pathway ID | Tissue | Disease Stage | Description | Gene Ratio | Bg Ratio | pvalue | p.adjust | qvalue | Count |
| hsa05208211 | Esophagus | ESCC | Chemical carcinogenesis - reactive oxygen species | 168/4205 | 223/8465 | 1.83e-15 | 6.81e-14 | 3.49e-14 | 168 |
| hsa05418211 | Esophagus | ESCC | Fluid shear stress and atherosclerosis | 109/4205 | 139/8465 | 2.00e-12 | 3.72e-11 | 1.90e-11 | 109 |
| hsa015247 | Esophagus | ESCC | Platinum drug resistance | 56/4205 | 73/8465 | 1.85e-06 | 1.13e-05 | 5.78e-06 | 56 |
| hsa0048018 | Esophagus | ESCC | Glutathione metabolism | 44/4205 | 57/8465 | 1.81e-05 | 9.03e-05 | 4.63e-05 | 44 |
| hsa0522518 | Esophagus | ESCC | Hepatocellular carcinoma | 109/4205 | 168/8465 | 4.27e-05 | 1.88e-04 | 9.64e-05 | 109 |
| hsa05208310 | Esophagus | ESCC | Chemical carcinogenesis - reactive oxygen species | 168/4205 | 223/8465 | 1.83e-15 | 6.81e-14 | 3.49e-14 | 168 |
| hsa05418310 | Esophagus | ESCC | Fluid shear stress and atherosclerosis | 109/4205 | 139/8465 | 2.00e-12 | 3.72e-11 | 1.90e-11 | 109 |
| hsa0152414 | Esophagus | ESCC | Platinum drug resistance | 56/4205 | 73/8465 | 1.85e-06 | 1.13e-05 | 5.78e-06 | 56 |
| hsa0048019 | Esophagus | ESCC | Glutathione metabolism | 44/4205 | 57/8465 | 1.81e-05 | 9.03e-05 | 4.63e-05 | 44 |
| hsa0522519 | Esophagus | ESCC | Hepatocellular carcinoma | 109/4205 | 168/8465 | 4.27e-05 | 1.88e-04 | 9.64e-05 | 109 |
| hsa0520830 | Oral cavity | OSCC | Chemical carcinogenesis - reactive oxygen species | 150/3704 | 223/8465 | 6.45e-13 | 1.20e-11 | 6.11e-12 | 150 |
| hsa0541830 | Oral cavity | OSCC | Fluid shear stress and atherosclerosis | 92/3704 | 139/8465 | 6.51e-08 | 4.84e-07 | 2.47e-07 | 92 |
| hsa015246 | Oral cavity | OSCC | Platinum drug resistance | 51/3704 | 73/8465 | 5.41e-06 | 2.75e-05 | 1.40e-05 | 51 |
| hsa0522516 | Oral cavity | OSCC | Hepatocellular carcinoma | 97/3704 | 168/8465 | 1.63e-04 | 5.52e-04 | 2.81e-04 | 97 |
| hsa0048016 | Oral cavity | OSCC | Glutathione metabolism | 36/3704 | 57/8465 | 2.41e-03 | 6.41e-03 | 3.26e-03 | 36 |
| hsa05208114 | Oral cavity | OSCC | Chemical carcinogenesis - reactive oxygen species | 150/3704 | 223/8465 | 6.45e-13 | 1.20e-11 | 6.11e-12 | 150 |
| hsa05418114 | Oral cavity | OSCC | Fluid shear stress and atherosclerosis | 92/3704 | 139/8465 | 6.51e-08 | 4.84e-07 | 2.47e-07 | 92 |
| hsa0152413 | Oral cavity | OSCC | Platinum drug resistance | 51/3704 | 73/8465 | 5.41e-06 | 2.75e-05 | 1.40e-05 | 51 |
| hsa0522517 | Oral cavity | OSCC | Hepatocellular carcinoma | 97/3704 | 168/8465 | 1.63e-04 | 5.52e-04 | 2.81e-04 | 97 |
| hsa0048017 | Oral cavity | OSCC | Glutathione metabolism | 36/3704 | 57/8465 | 2.41e-03 | 6.41e-03 | 3.26e-03 | 36 |
| Page: 1 2 |
Top |
Cell-cell communication analysis |
| Identification of potential cell-cell interactions between two cell types and their ligand-receptor pairs for different disease states |
| Ligand | Receptor | LRpair | Pathway | Tissue | Disease Stage |
| Page: 1 |
Top |
Single-cell gene regulatory network inference analysis |
| Find out the significant the regulons (TFs) and the target genes of each regulon across cell types for different disease states |
| TF | Cell Type | Tissue | Disease Stage | Target Gene | RSS | Regulon Activity |
| ∗The dot plots of a searched regulon are shown for all cell subpopulations in each disease state of each tissue based on the regulon specific score inferred using pySCENIC and by calculating the average expression. |
| Page: 1 |
Top |
Somatic mutation of malignant transformation related genes |
| Annotation of somatic variants for genes involved in malignant transformation |
| Hugo Symbol | Variant Class | Variant Classification | dbSNP RS | HGVSc | HGVSp | HGVSp Short | SWISSPROT | BIOTYPE | SIFT | PolyPhen | Tumor Sample Barcode | Tissue | Histology | Sex | Age | Stage | Therapy Types | Drugs | Outcome |
| GSTA4 | SNV | Missense_Mutation | rs139066992 | c.430G>A | p.Gly144Arg | p.G144R | O15217 | protein_coding | tolerated(0.07) | possibly_damaging(0.619) | TCGA-AZ-6601-01 | Colorectum | colon adenocarcinoma | Male | >=65 | I/II | Unknown | Unknown | PD |
| GSTA4 | SNV | Missense_Mutation | c.293N>A | p.Gly98Glu | p.G98E | O15217 | protein_coding | deleterious(0) | probably_damaging(0.998) | TCGA-F4-6461-01 | Colorectum | colon adenocarcinoma | Female | <65 | III/IV | Unknown | Unknown | PD | |
| GSTA4 | SNV | Missense_Mutation | novel | c.386T>G | p.Ile129Arg | p.I129R | O15217 | protein_coding | tolerated(0.22) | benign(0.006) | TCGA-F5-6814-01 | Colorectum | rectum adenocarcinoma | Male | <65 | I/II | Unknown | Unknown | SD |
| GSTA4 | deletion | Frame_Shift_Del | c.623delN | p.Pro208LeufsTer6 | p.P208Lfs*6 | O15217 | protein_coding | TCGA-A6-3809-01 | Colorectum | colon adenocarcinoma | Female | >=65 | I/II | Unknown | Unknown | SD | |||
| GSTA4 | SNV | Missense_Mutation | c.191A>C | p.Lys64Thr | p.K64T | O15217 | protein_coding | tolerated(0.06) | benign(0.439) | TCGA-AX-A05Z-01 | Endometrium | uterine corpus endometrioid carcinoma | Female | <65 | III/IV | Chemotherapy | adriamycin | SD | |
| GSTA4 | SNV | Missense_Mutation | rs774014743 | c.646N>A | p.Val216Ile | p.V216I | O15217 | protein_coding | tolerated(0.08) | benign(0.075) | TCGA-AX-A1CE-01 | Endometrium | uterine corpus endometrioid carcinoma | Female | <65 | I/II | Unspecific | Paclitaxel | SD |
| GSTA4 | SNV | Missense_Mutation | c.507N>T | p.Glu169Asp | p.E169D | O15217 | protein_coding | tolerated(0.06) | benign(0.083) | TCGA-B5-A0JY-01 | Endometrium | uterine corpus endometrioid carcinoma | Female | <65 | III/IV | Chemotherapy | doxorubicin | SD | |
| GSTA4 | SNV | Missense_Mutation | c.291G>T | p.Glu97Asp | p.E97D | O15217 | protein_coding | tolerated(0.19) | benign(0.015) | TCGA-B5-A11E-01 | Endometrium | uterine corpus endometrioid carcinoma | Female | <65 | I/II | Unknown | Unknown | SD | |
| GSTA4 | SNV | Missense_Mutation | novel | c.477N>G | p.Ile159Met | p.I159M | O15217 | protein_coding | tolerated(0.18) | benign(0.003) | TCGA-EO-A22R-01 | Endometrium | uterine corpus endometrioid carcinoma | Female | <65 | I/II | Unknown | Unknown | SD |
| GSTA4 | SNV | Missense_Mutation | novel | c.99N>C | p.Glu33Asp | p.E33D | O15217 | protein_coding | tolerated(0.26) | benign(0.042) | TCGA-EO-A22X-01 | Endometrium | uterine corpus endometrioid carcinoma | Female | <65 | III/IV | Unspecific | Carboplatin | Complete Response |
| Page: 1 2 |
Top |
Related drugs of malignant transformation related genes |
| Identification of chemicals and drugs interact with genes involved in malignant transfromation |
| (DGIdb 4.0) |
| Entrez ID | Symbol | Category | Interaction Types | Drug Claim Name | Drug Name | PMIDs |
| Page: 1 |

Copyright 2023-Present -The University of Texas Health Science Center at Houston |