
|
|||||
|
 | |
| |
| |
| |
| |
| |
|
Gene: GSTA1 |
Gene summary for GSTA1 |
| Gene information | Species | Human | Gene symbol | GSTA1 | Gene ID | 2938 |
| Gene name | glutathione S-transferase alpha 1 | |
| Gene Alias | GST-epsilon | |
| Cytomap | 6p12.2 | |
| Gene Type | protein-coding | GO ID | GO:0001676 | UniProtAcc | A0A140VJK4 |
Top |
Malignant transformation analysis |
| Identification of the aberrant gene expression in precancerous and cancerous lesions by comparing the gene expression of stem-like cells in diseased tissues with normal stem cells |
| Entrez ID | Symbol | Replicates | Species | Organ | Tissue | Adj P-value | Log2FC | Malignancy |
| 2938 | GSTA1 | LZE2D | Human | Esophagus | HGIN | 3.07e-05 | 2.83e+00 | 0.0642 |
| 2938 | GSTA1 | LZE2T | Human | Esophagus | ESCC | 1.58e-09 | 3.09e+00 | 0.082 |
| 2938 | GSTA1 | LZE20T | Human | Esophagus | ESCC | 5.56e-09 | 1.69e+00 | 0.0662 |
| 2938 | GSTA1 | LZE22D1 | Human | Esophagus | HGIN | 7.96e-03 | 1.26e+00 | 0.0595 |
| 2938 | GSTA1 | LZE24T | Human | Esophagus | ESCC | 2.75e-56 | 4.31e+00 | 0.0596 |
| 2938 | GSTA1 | LZE22D3 | Human | Esophagus | HGIN | 2.39e-03 | 4.07e-01 | 0.0653 |
| 2938 | GSTA1 | LZE21T | Human | Esophagus | ESCC | 2.20e-05 | 1.76e+00 | 0.0655 |
| 2938 | GSTA1 | P2T-E | Human | Esophagus | ESCC | 2.21e-07 | -1.58e-01 | 0.1177 |
| 2938 | GSTA1 | P4T-E | Human | Esophagus | ESCC | 1.56e-13 | 1.49e+00 | 0.1323 |
| 2938 | GSTA1 | P5T-E | Human | Esophagus | ESCC | 2.29e-02 | -1.71e-01 | 0.1327 |
| 2938 | GSTA1 | P12T-E | Human | Esophagus | ESCC | 2.30e-15 | 2.14e+00 | 0.1122 |
| 2938 | GSTA1 | P15T-E | Human | Esophagus | ESCC | 2.52e-04 | 1.17e+00 | 0.1149 |
| 2938 | GSTA1 | P22T-E | Human | Esophagus | ESCC | 2.05e-03 | 5.18e-01 | 0.1236 |
| 2938 | GSTA1 | P26T-E | Human | Esophagus | ESCC | 1.19e-10 | 1.32e+00 | 0.1276 |
| 2938 | GSTA1 | P27T-E | Human | Esophagus | ESCC | 6.08e-03 | 9.93e-01 | 0.1055 |
| 2938 | GSTA1 | P30T-E | Human | Esophagus | ESCC | 8.97e-34 | 4.16e+00 | 0.137 |
| 2938 | GSTA1 | P32T-E | Human | Esophagus | ESCC | 1.66e-02 | -1.78e-01 | 0.1666 |
| 2938 | GSTA1 | P39T-E | Human | Esophagus | ESCC | 3.19e-10 | 6.70e-01 | 0.0894 |
| 2938 | GSTA1 | P61T-E | Human | Esophagus | ESCC | 3.28e-02 | -1.41e-01 | 0.099 |
| 2938 | GSTA1 | P62T-E | Human | Esophagus | ESCC | 3.21e-10 | 1.23e+00 | 0.1302 |
| Page: 1 2 3 4 |
| Tissue | Expression Dynamics | Abbreviation |
| Esophagus | 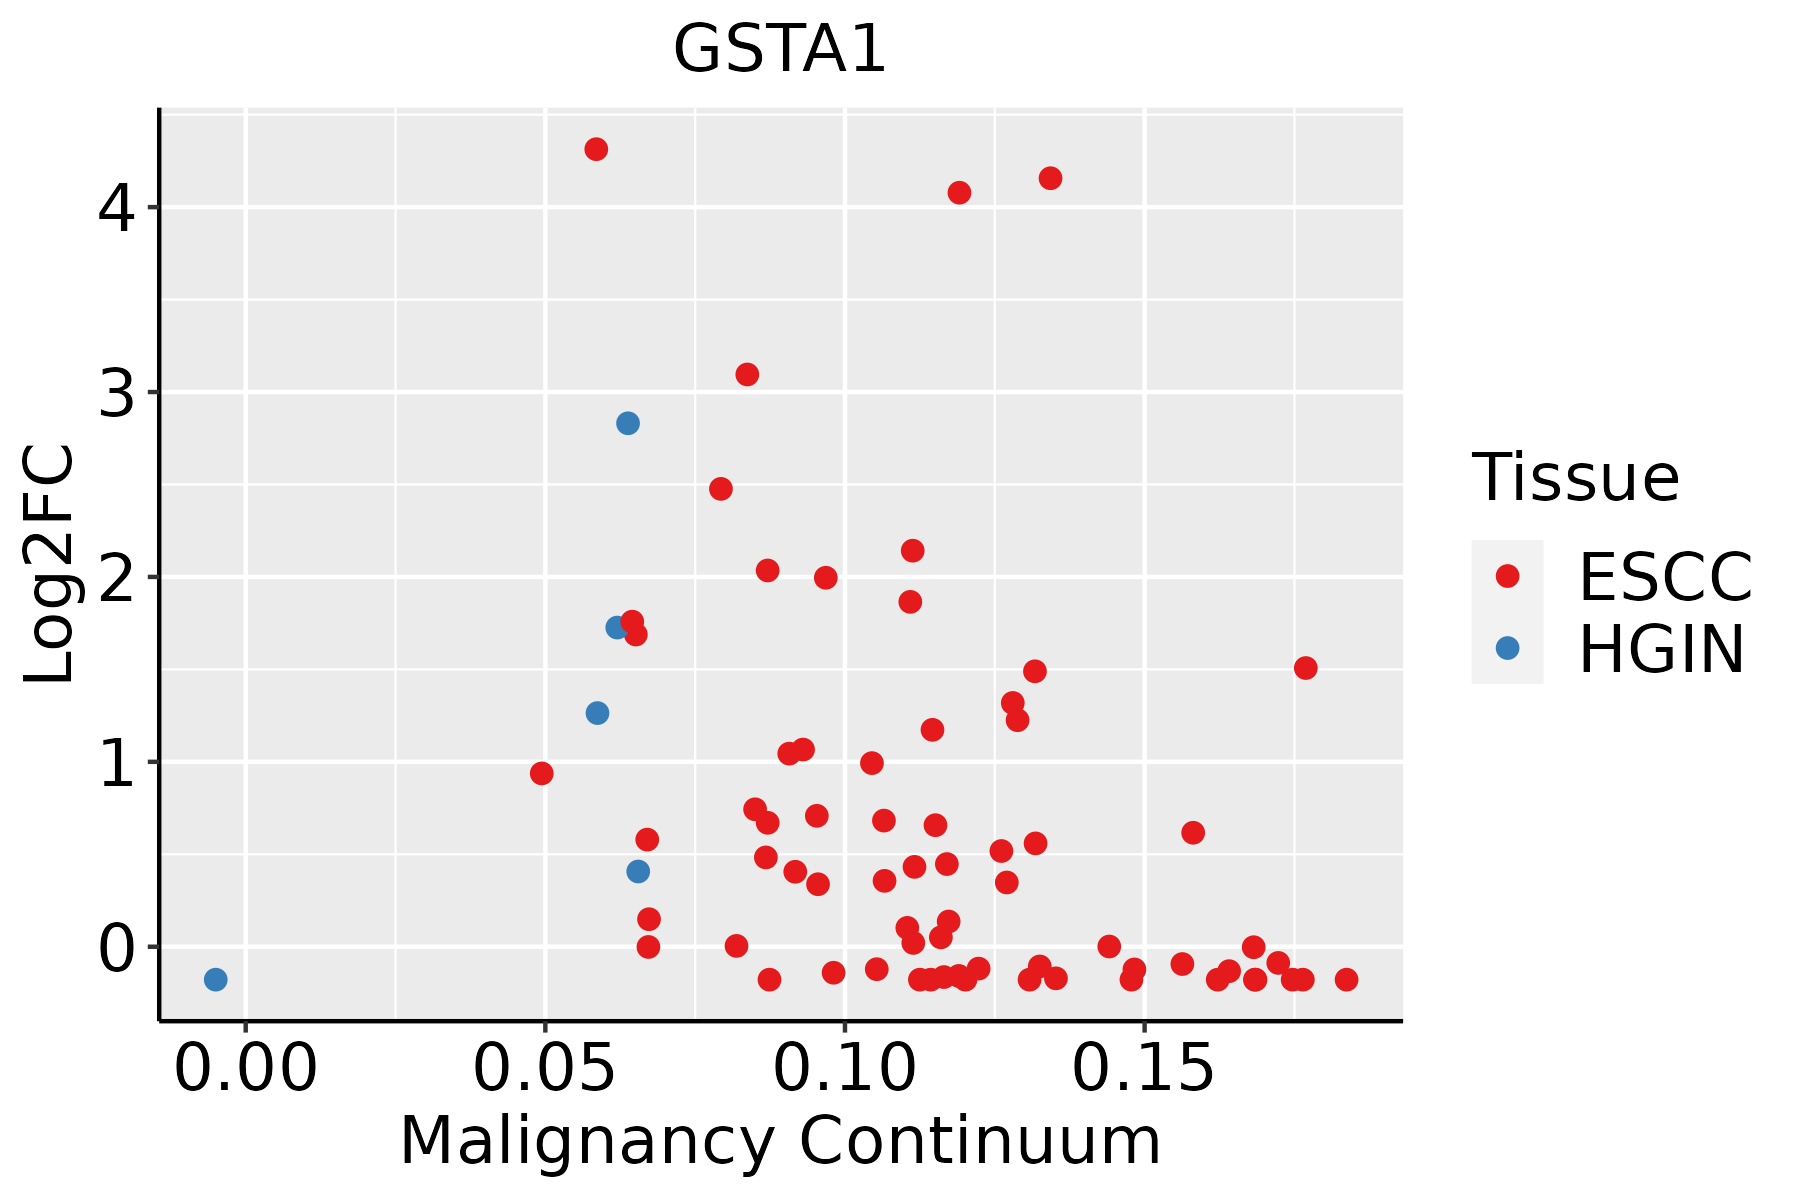 | ESCC: Esophageal squamous cell carcinoma |
| HGIN: High-grade intraepithelial neoplasias | ||
| LGIN: Low-grade intraepithelial neoplasias | ||
| GC | 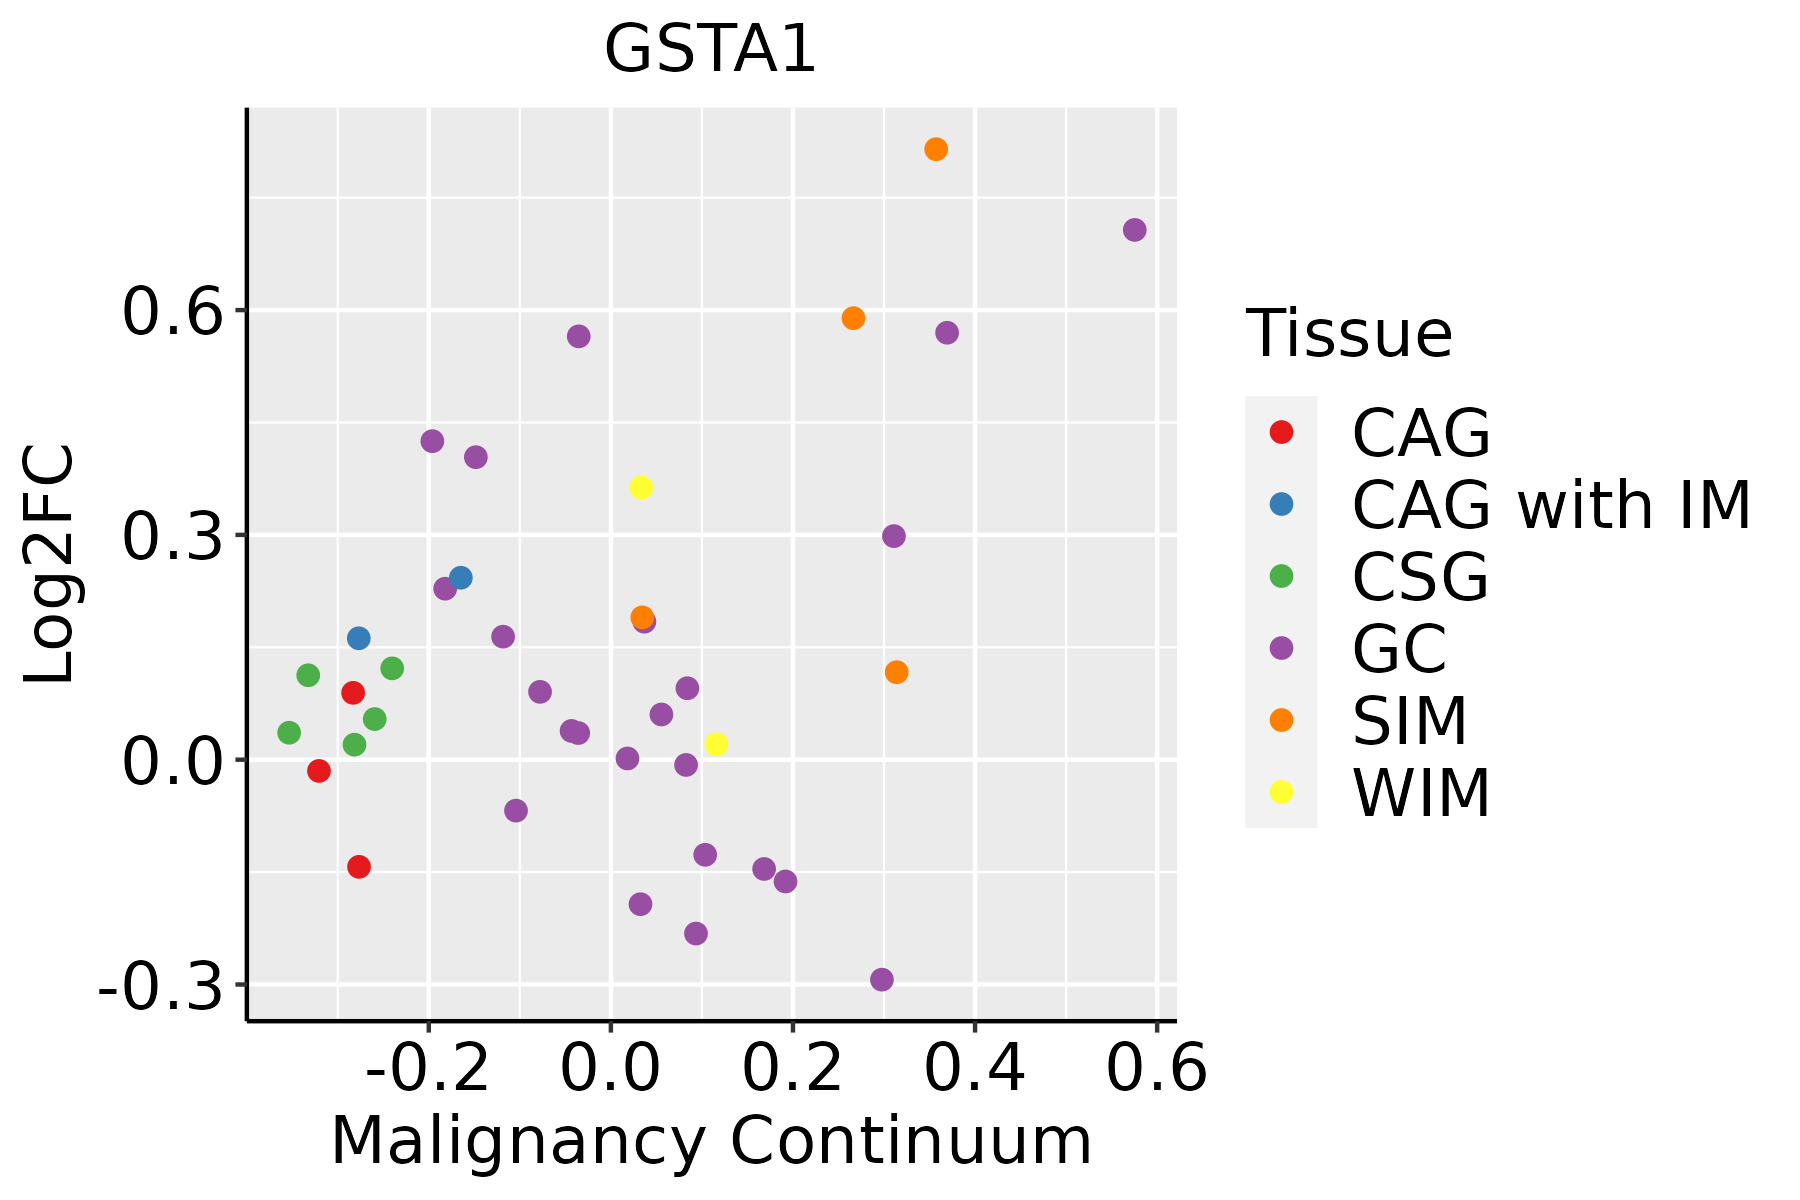 | CAG: Chronic atrophic gastritis |
| CAG with IM: Chronic atrophic gastritis with intestinal metaplasia | ||
| CSG: Chronic superficial gastritis | ||
| GC: Gastric cancer | ||
| SIM: Severe intestinal metaplasia | ||
| WIM: Wild intestinal metaplasia | ||
| Liver | 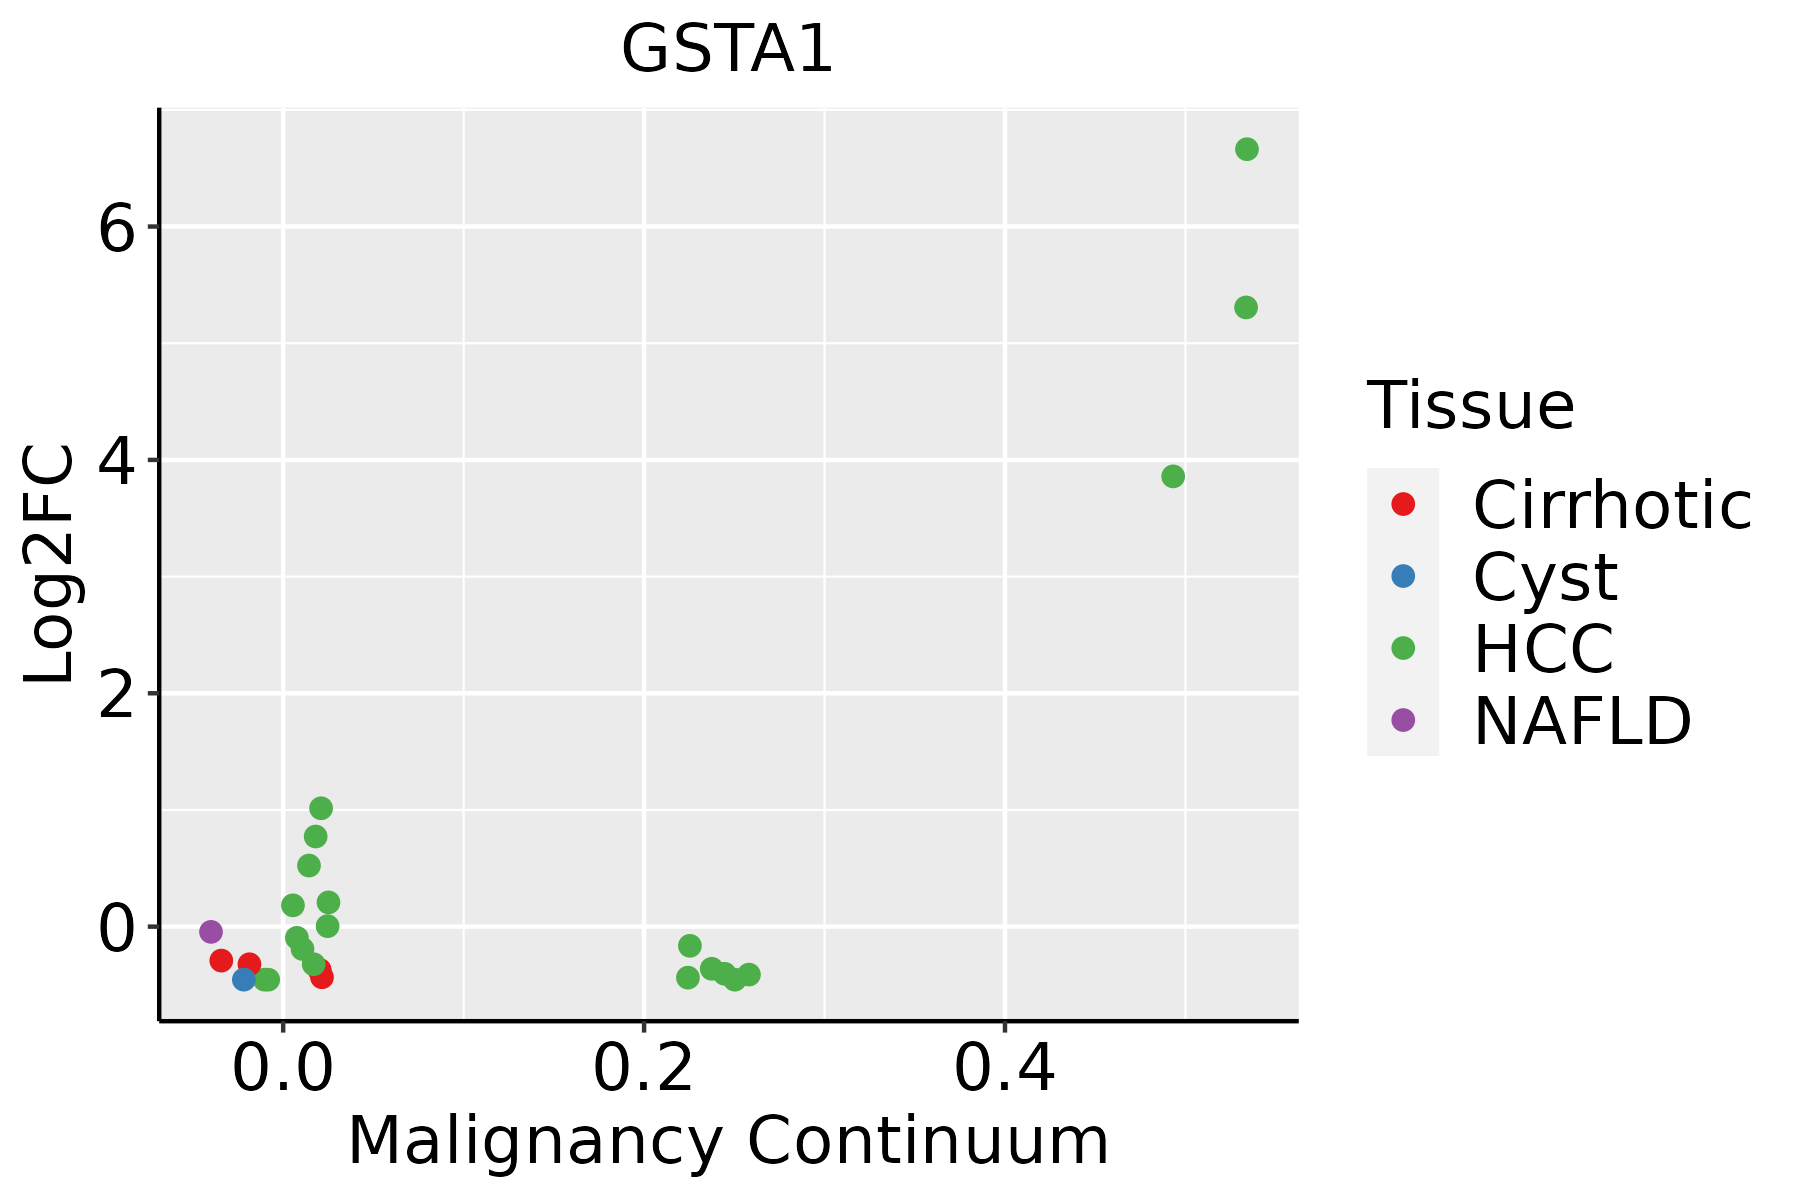 | HCC: Hepatocellular carcinoma |
| NAFLD: Non-alcoholic fatty liver disease | ||
| Oral Cavity |  | EOLP: Erosive Oral lichen planus |
| LP: leukoplakia | ||
| NEOLP: Non-erosive oral lichen planus | ||
| OSCC: Oral squamous cell carcinoma |
| ∗log2FC in expression of this searched gene in stem-like cells from each diseased tissue sample relative to stem-like cells in normal samples in each tissue plotted against the malignancy continuum. Samples are colored based on if they are from different disease stage. |
Top |
Malignant transformation related pathway analysis |
| Find out the enriched GO biological processes and KEGG pathways involved in transition from healthy to precancer to cancer |
| Tissue | Disease Stage | Enriched GO biological Processes |
| Colorectum | AD |  |
| Colorectum | SER |  |
| Colorectum | MSS |  |
| Colorectum | MSI-H |  |
| Colorectum | FAP |  |
| ∗Top 15 enriched GO BP terms are showed in the bar plot of each disease state in each tissue. Each row represents a significant GO biological process which is colored according to the -log10(p.adjust). |
| Page: 1 2 3 4 5 6 7 8 9 |
| GO ID | Tissue | Disease Stage | Description | Gene Ratio | Bg Ratio | pvalue | p.adjust | Count |
| GO:00066929 | Esophagus | HGIN | prostanoid metabolic process | 17/2587 | 49/18723 | 1.84e-04 | 3.48e-03 | 17 |
| GO:00066939 | Esophagus | HGIN | prostaglandin metabolic process | 17/2587 | 49/18723 | 1.84e-04 | 3.48e-03 | 17 |
| GO:00067497 | Esophagus | HGIN | glutathione metabolic process | 20/2587 | 64/18723 | 2.63e-04 | 4.58e-03 | 20 |
| GO:199074820 | Esophagus | HGIN | cellular detoxification | 30/2587 | 116/18723 | 4.05e-04 | 6.15e-03 | 30 |
| GO:009723720 | Esophagus | HGIN | cellular response to toxic substance | 30/2587 | 124/18723 | 1.32e-03 | 1.57e-02 | 30 |
| GO:009886920 | Esophagus | HGIN | cellular oxidant detoxification | 25/2587 | 101/18723 | 2.29e-03 | 2.34e-02 | 25 |
| GO:00067906 | Esophagus | ESCC | sulfur compound metabolic process | 201/8552 | 339/18723 | 2.64e-07 | 3.94e-06 | 201 |
| GO:00442725 | Esophagus | ESCC | sulfur compound biosynthetic process | 96/8552 | 148/18723 | 1.86e-06 | 2.16e-05 | 96 |
| GO:00066318 | Esophagus | ESCC | fatty acid metabolic process | 217/8552 | 390/18723 | 4.21e-05 | 3.39e-04 | 217 |
| GO:000941020 | Esophagus | ESCC | response to xenobiotic stimulus | 253/8552 | 462/18723 | 4.55e-05 | 3.58e-04 | 253 |
| GO:00065757 | Esophagus | ESCC | cellular modified amino acid metabolic process | 112/8552 | 188/18723 | 8.31e-05 | 6.06e-04 | 112 |
| GO:000963620 | Esophagus | ESCC | response to toxic substance | 150/8552 | 262/18723 | 1.00e-04 | 7.12e-04 | 150 |
| GO:000674912 | Esophagus | ESCC | glutathione metabolic process | 42/8552 | 64/18723 | 1.01e-03 | 5.12e-03 | 42 |
| GO:1990748110 | Esophagus | ESCC | cellular detoxification | 70/8552 | 116/18723 | 1.02e-03 | 5.17e-03 | 70 |
| GO:000669211 | Esophagus | ESCC | prostanoid metabolic process | 33/8552 | 49/18723 | 1.80e-03 | 8.26e-03 | 33 |
| GO:000669311 | Esophagus | ESCC | prostaglandin metabolic process | 33/8552 | 49/18723 | 1.80e-03 | 8.26e-03 | 33 |
| GO:0097237110 | Esophagus | ESCC | cellular response to toxic substance | 72/8552 | 124/18723 | 3.65e-03 | 1.49e-02 | 72 |
| GO:0098869110 | Esophagus | ESCC | cellular oxidant detoxification | 60/8552 | 101/18723 | 3.76e-03 | 1.53e-02 | 60 |
| GO:00066316 | Liver | NAFLD | fatty acid metabolic process | 92/1882 | 390/18723 | 3.38e-15 | 3.29e-12 | 92 |
| GO:00094107 | Liver | NAFLD | response to xenobiotic stimulus | 88/1882 | 462/18723 | 2.53e-09 | 4.11e-07 | 88 |
| Page: 1 2 3 4 5 6 7 8 |
| Pathway ID | Tissue | Disease Stage | Description | Gene Ratio | Bg Ratio | pvalue | p.adjust | qvalue | Count |
| hsa0520839 | Esophagus | HGIN | Chemical carcinogenesis - reactive oxygen species | 92/1383 | 223/8465 | 2.41e-19 | 9.83e-18 | 7.80e-18 | 92 |
| hsa0541839 | Esophagus | HGIN | Fluid shear stress and atherosclerosis | 42/1383 | 139/8465 | 2.92e-05 | 3.81e-04 | 3.02e-04 | 42 |
| hsa05208115 | Esophagus | HGIN | Chemical carcinogenesis - reactive oxygen species | 92/1383 | 223/8465 | 2.41e-19 | 9.83e-18 | 7.80e-18 | 92 |
| hsa05418115 | Esophagus | HGIN | Fluid shear stress and atherosclerosis | 42/1383 | 139/8465 | 2.92e-05 | 3.81e-04 | 3.02e-04 | 42 |
| hsa05208211 | Esophagus | ESCC | Chemical carcinogenesis - reactive oxygen species | 168/4205 | 223/8465 | 1.83e-15 | 6.81e-14 | 3.49e-14 | 168 |
| hsa05418211 | Esophagus | ESCC | Fluid shear stress and atherosclerosis | 109/4205 | 139/8465 | 2.00e-12 | 3.72e-11 | 1.90e-11 | 109 |
| hsa015247 | Esophagus | ESCC | Platinum drug resistance | 56/4205 | 73/8465 | 1.85e-06 | 1.13e-05 | 5.78e-06 | 56 |
| hsa0048018 | Esophagus | ESCC | Glutathione metabolism | 44/4205 | 57/8465 | 1.81e-05 | 9.03e-05 | 4.63e-05 | 44 |
| hsa0522518 | Esophagus | ESCC | Hepatocellular carcinoma | 109/4205 | 168/8465 | 4.27e-05 | 1.88e-04 | 9.64e-05 | 109 |
| hsa05208310 | Esophagus | ESCC | Chemical carcinogenesis - reactive oxygen species | 168/4205 | 223/8465 | 1.83e-15 | 6.81e-14 | 3.49e-14 | 168 |
| hsa05418310 | Esophagus | ESCC | Fluid shear stress and atherosclerosis | 109/4205 | 139/8465 | 2.00e-12 | 3.72e-11 | 1.90e-11 | 109 |
| hsa0152414 | Esophagus | ESCC | Platinum drug resistance | 56/4205 | 73/8465 | 1.85e-06 | 1.13e-05 | 5.78e-06 | 56 |
| hsa0048019 | Esophagus | ESCC | Glutathione metabolism | 44/4205 | 57/8465 | 1.81e-05 | 9.03e-05 | 4.63e-05 | 44 |
| hsa0522519 | Esophagus | ESCC | Hepatocellular carcinoma | 109/4205 | 168/8465 | 4.27e-05 | 1.88e-04 | 9.64e-05 | 109 |
| hsa0520814 | Liver | NAFLD | Chemical carcinogenesis - reactive oxygen species | 44/1043 | 223/8465 | 9.22e-04 | 1.31e-02 | 1.06e-02 | 44 |
| hsa0541814 | Liver | NAFLD | Fluid shear stress and atherosclerosis | 30/1043 | 139/8465 | 1.37e-03 | 1.71e-02 | 1.38e-02 | 30 |
| hsa0520815 | Liver | NAFLD | Chemical carcinogenesis - reactive oxygen species | 44/1043 | 223/8465 | 9.22e-04 | 1.31e-02 | 1.06e-02 | 44 |
| hsa0541815 | Liver | NAFLD | Fluid shear stress and atherosclerosis | 30/1043 | 139/8465 | 1.37e-03 | 1.71e-02 | 1.38e-02 | 30 |
| hsa0520822 | Liver | Cirrhotic | Chemical carcinogenesis - reactive oxygen species | 121/2530 | 223/8465 | 1.35e-14 | 4.08e-13 | 2.52e-13 | 121 |
| hsa0541822 | Liver | Cirrhotic | Fluid shear stress and atherosclerosis | 62/2530 | 139/8465 | 1.53e-04 | 1.06e-03 | 6.54e-04 | 62 |
| Page: 1 2 3 4 |
Top |
Cell-cell communication analysis |
| Identification of potential cell-cell interactions between two cell types and their ligand-receptor pairs for different disease states |
| Ligand | Receptor | LRpair | Pathway | Tissue | Disease Stage |
| Page: 1 |
Top |
Single-cell gene regulatory network inference analysis |
| Find out the significant the regulons (TFs) and the target genes of each regulon across cell types for different disease states |
| TF | Cell Type | Tissue | Disease Stage | Target Gene | RSS | Regulon Activity |
| ∗The dot plots of a searched regulon are shown for all cell subpopulations in each disease state of each tissue based on the regulon specific score inferred using pySCENIC and by calculating the average expression. |
| Page: 1 |
Top |
Somatic mutation of malignant transformation related genes |
| Annotation of somatic variants for genes involved in malignant transformation |
| Hugo Symbol | Variant Class | Variant Classification | dbSNP RS | HGVSc | HGVSp | HGVSp Short | SWISSPROT | BIOTYPE | SIFT | PolyPhen | Tumor Sample Barcode | Tissue | Histology | Sex | Age | Stage | Therapy Types | Drugs | Outcome |
| GSTA1 | SNV | Missense_Mutation | c.227C>T | p.Ala76Val | p.A76V | P08263 | protein_coding | deleterious(0.01) | probably_damaging(0.963) | TCGA-BH-A0HK-01 | Breast | breast invasive carcinoma | Female | >=65 | I/II | Hormone Therapy | arimidex | SD | |
| GSTA1 | SNV | Missense_Mutation | c.30C>G | p.Phe10Leu | p.F10L | P08263 | protein_coding | tolerated(0.09) | benign(0.023) | TCGA-D8-A1JA-01 | Breast | breast invasive carcinoma | Female | <65 | III/IV | Chemotherapy | adriamycin | PD | |
| GSTA1 | SNV | Missense_Mutation | rs755670661 | c.150N>C | p.Leu50Phe | p.L50F | P08263 | protein_coding | deleterious(0.04) | possibly_damaging(0.545) | TCGA-GM-A2DH-01 | Breast | breast invasive carcinoma | Female | <65 | I/II | Chemotherapy | taxol | CR |
| GSTA1 | SNV | Missense_Mutation | c.325C>G | p.Leu109Val | p.L109V | P08263 | protein_coding | tolerated(0.23) | benign(0.003) | TCGA-VS-A9U7-01 | Cervix | cervical & endocervical cancer | Female | <65 | I/II | Chemotherapy | cisplatin | CR | |
| GSTA1 | SNV | Missense_Mutation | c.630N>T | p.Glu210Asp | p.E210D | P08263 | protein_coding | tolerated(0.33) | benign(0) | TCGA-A6-6141-01 | Colorectum | colon adenocarcinoma | Male | <65 | I/II | Chemotherapy | 5-fu | SD | |
| GSTA1 | SNV | Missense_Mutation | c.593N>C | p.Leu198Pro | p.L198P | P08263 | protein_coding | deleterious(0) | probably_damaging(0.991) | TCGA-AA-3715-01 | Colorectum | colon adenocarcinoma | Male | >=65 | I/II | Unknown | Unknown | PD | |
| GSTA1 | SNV | Missense_Mutation | novel | c.451N>G | p.Asn151Asp | p.N151D | P08263 | protein_coding | tolerated(0.08) | benign(0.358) | TCGA-CA-6717-01 | Colorectum | colon adenocarcinoma | Male | <65 | I/II | Chemotherapy | oxaliplatin | CR |
| GSTA1 | SNV | Missense_Mutation | c.347A>G | p.Glu116Gly | p.E116G | P08263 | protein_coding | deleterious(0.03) | benign(0.055) | TCGA-DM-A1HB-01 | Colorectum | colon adenocarcinoma | Male | >=65 | III/IV | Unknown | Unknown | SD | |
| GSTA1 | SNV | Missense_Mutation | c.643G>A | p.Glu215Lys | p.E215K | P08263 | protein_coding | tolerated(0.58) | benign(0) | TCGA-F5-6814-01 | Colorectum | rectum adenocarcinoma | Male | <65 | I/II | Unknown | Unknown | SD | |
| GSTA1 | SNV | Missense_Mutation | rs776912908 | c.391N>T | p.Arg131Cys | p.R131C | P08263 | protein_coding | deleterious(0.03) | benign(0.32) | TCGA-A5-A0G1-01 | Endometrium | uterine corpus endometrioid carcinoma | Female | >=65 | I/II | Unknown | Unknown | SD |
| Page: 1 2 3 4 |
Top |
Related drugs of malignant transformation related genes |
| Identification of chemicals and drugs interact with genes involved in malignant transfromation |
| (DGIdb 4.0) |
| Entrez ID | Symbol | Category | Interaction Types | Drug Claim Name | Drug Name | PMIDs |
| 2938 | GSTA1 | ENZYME, DRUGGABLE GENOME | vincristine | VINCRISTINE | 29938344,19448608 | |
| 2938 | GSTA1 | ENZYME, DRUGGABLE GENOME | rituximab | RITUXIMAB | 29938344,19448608 | |
| 2938 | GSTA1 | ENZYME, DRUGGABLE GENOME | PHYTOCHEMICALS | 15672752 | ||
| 2938 | GSTA1 | ENZYME, DRUGGABLE GENOME | BROMOSULFOPHTHALEIN | SULFOBROMOPHTHALEIN SODIUM | 22849615 | |
| 2938 | GSTA1 | ENZYME, DRUGGABLE GENOME | cyclophosphamide | CYCLOPHOSPHAMIDE | 22188361,29938344,19448608,26222310 | |
| 2938 | GSTA1 | ENZYME, DRUGGABLE GENOME | busulfan | BUSULFAN | 24192117 | |
| 2938 | GSTA1 | ENZYME, DRUGGABLE GENOME | cisplatin | CISPLATIN | 22188361 | |
| 2938 | GSTA1 | ENZYME, DRUGGABLE GENOME | doxorubicin | DOXORUBICIN | 29938344,24215845,19448608 | |
| 2938 | GSTA1 | ENZYME, DRUGGABLE GENOME | ETHACRYNIC ACID | 11092982 | ||
| 2938 | GSTA1 | ENZYME, DRUGGABLE GENOME | PHENOBARBITAL | PHENOBARBITAL | 16608922 |
| Page: 1 2 |

Copyright 2023-Present -The University of Texas Health Science Center at Houston |