
|
|||||
|
 | |
| |
| |
| |
| |
| |
|
Gene: GSS |
Gene summary for GSS |
| Gene information | Species | Human | Gene symbol | GSS | Gene ID | 2937 |
| Gene name | glutathione synthetase | |
| Gene Alias | GSHS | |
| Cytomap | 20q11.22 | |
| Gene Type | protein-coding | GO ID | GO:0001101 | UniProtAcc | P48637 |
Top |
Malignant transformation analysis |
| Identification of the aberrant gene expression in precancerous and cancerous lesions by comparing the gene expression of stem-like cells in diseased tissues with normal stem cells |
| Entrez ID | Symbol | Replicates | Species | Organ | Tissue | Adj P-value | Log2FC | Malignancy |
| 2937 | GSS | HTA11_347_2000001011 | Human | Colorectum | AD | 5.87e-11 | 4.84e-01 | -0.1954 |
| 2937 | GSS | HTA11_696_2000001011 | Human | Colorectum | AD | 3.55e-05 | 3.08e-01 | -0.1464 |
| 2937 | GSS | HTA11_10623_2000001011 | Human | Colorectum | AD | 9.33e-04 | 5.00e-01 | -0.0177 |
| 2937 | GSS | HTA11_99999965104_69814 | Human | Colorectum | MSS | 7.37e-05 | 4.25e-01 | 0.281 |
| 2937 | GSS | HTA11_99999971662_82457 | Human | Colorectum | MSS | 3.67e-14 | 7.31e-01 | 0.3859 |
| 2937 | GSS | HTA11_99999974143_84620 | Human | Colorectum | MSS | 1.49e-14 | 5.76e-01 | 0.3005 |
| 2937 | GSS | A015-C-203 | Human | Colorectum | FAP | 4.52e-02 | -8.38e-02 | -0.1294 |
| 2937 | GSS | A002-C-205 | Human | Colorectum | FAP | 5.22e-03 | -1.49e-01 | -0.1236 |
| 2937 | GSS | A015-C-104 | Human | Colorectum | FAP | 2.06e-02 | -1.42e-01 | -0.1899 |
| 2937 | GSS | A002-C-016 | Human | Colorectum | FAP | 2.65e-02 | -1.11e-01 | 0.0521 |
| 2937 | GSS | A002-C-116 | Human | Colorectum | FAP | 6.85e-05 | -1.59e-01 | -0.0452 |
| 2937 | GSS | F034 | Human | Colorectum | FAP | 3.65e-02 | -1.18e-01 | -0.0665 |
| 2937 | GSS | LZE2T | Human | Esophagus | ESCC | 7.20e-03 | 5.31e-01 | 0.082 |
| 2937 | GSS | LZE4T | Human | Esophagus | ESCC | 1.57e-12 | 5.38e-01 | 0.0811 |
| 2937 | GSS | LZE5T | Human | Esophagus | ESCC | 2.35e-06 | 1.87e-01 | 0.0514 |
| 2937 | GSS | LZE7T | Human | Esophagus | ESCC | 2.74e-07 | 4.57e-01 | 0.0667 |
| 2937 | GSS | LZE8T | Human | Esophagus | ESCC | 3.02e-07 | 2.94e-01 | 0.067 |
| 2937 | GSS | LZE20T | Human | Esophagus | ESCC | 1.21e-05 | 3.25e-01 | 0.0662 |
| 2937 | GSS | LZE22D1 | Human | Esophagus | HGIN | 2.98e-05 | 9.82e-02 | 0.0595 |
| 2937 | GSS | LZE22T | Human | Esophagus | ESCC | 7.47e-03 | 4.41e-01 | 0.068 |
| Page: 1 2 3 4 5 6 7 |
| Tissue | Expression Dynamics | Abbreviation |
| Colorectum (GSE201348) |  | FAP: Familial adenomatous polyposis |
| CRC: Colorectal cancer | ||
| Colorectum (HTA11) |  | AD: Adenomas |
| SER: Sessile serrated lesions | ||
| MSI-H: Microsatellite-high colorectal cancer | ||
| MSS: Microsatellite stable colorectal cancer | ||
| Esophagus |  | ESCC: Esophageal squamous cell carcinoma |
| HGIN: High-grade intraepithelial neoplasias | ||
| LGIN: Low-grade intraepithelial neoplasias | ||
| Liver | 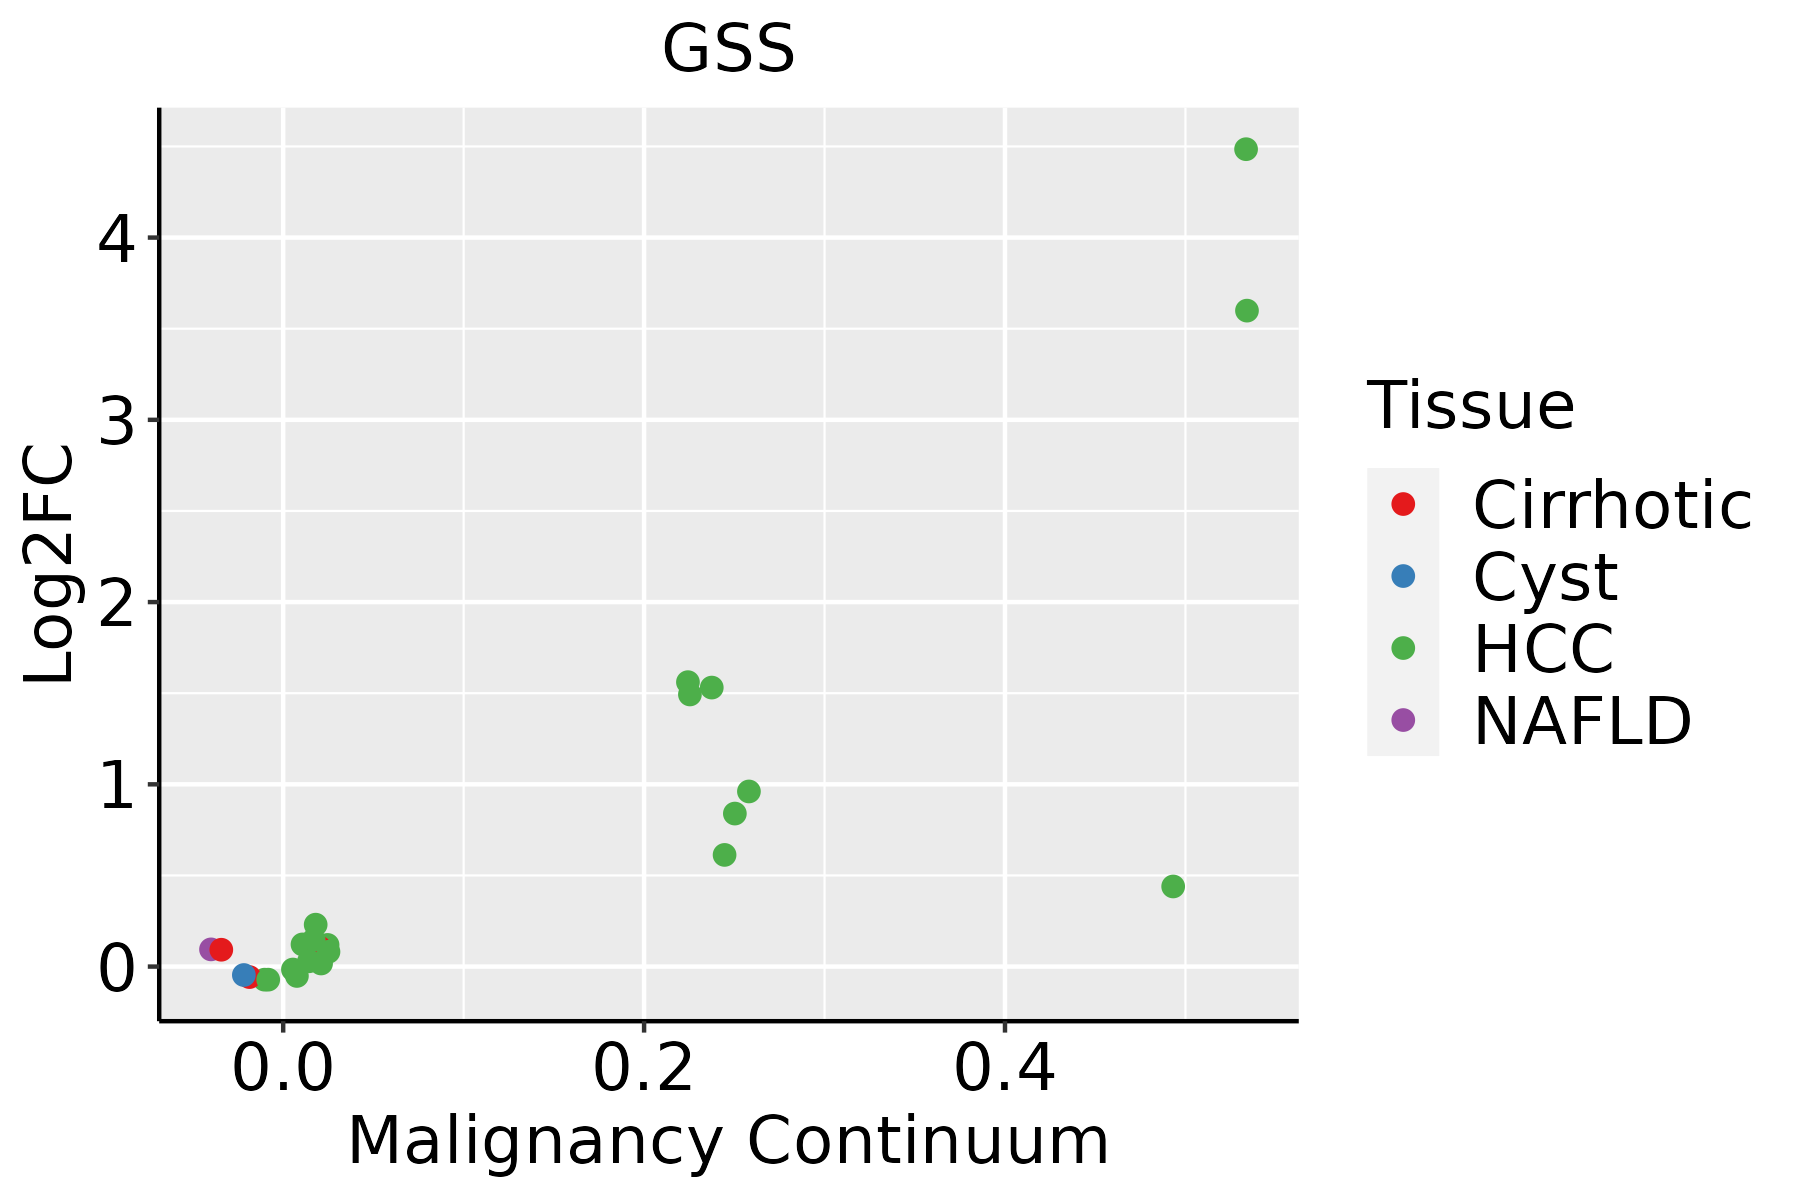 | HCC: Hepatocellular carcinoma |
| NAFLD: Non-alcoholic fatty liver disease | ||
| Oral Cavity | 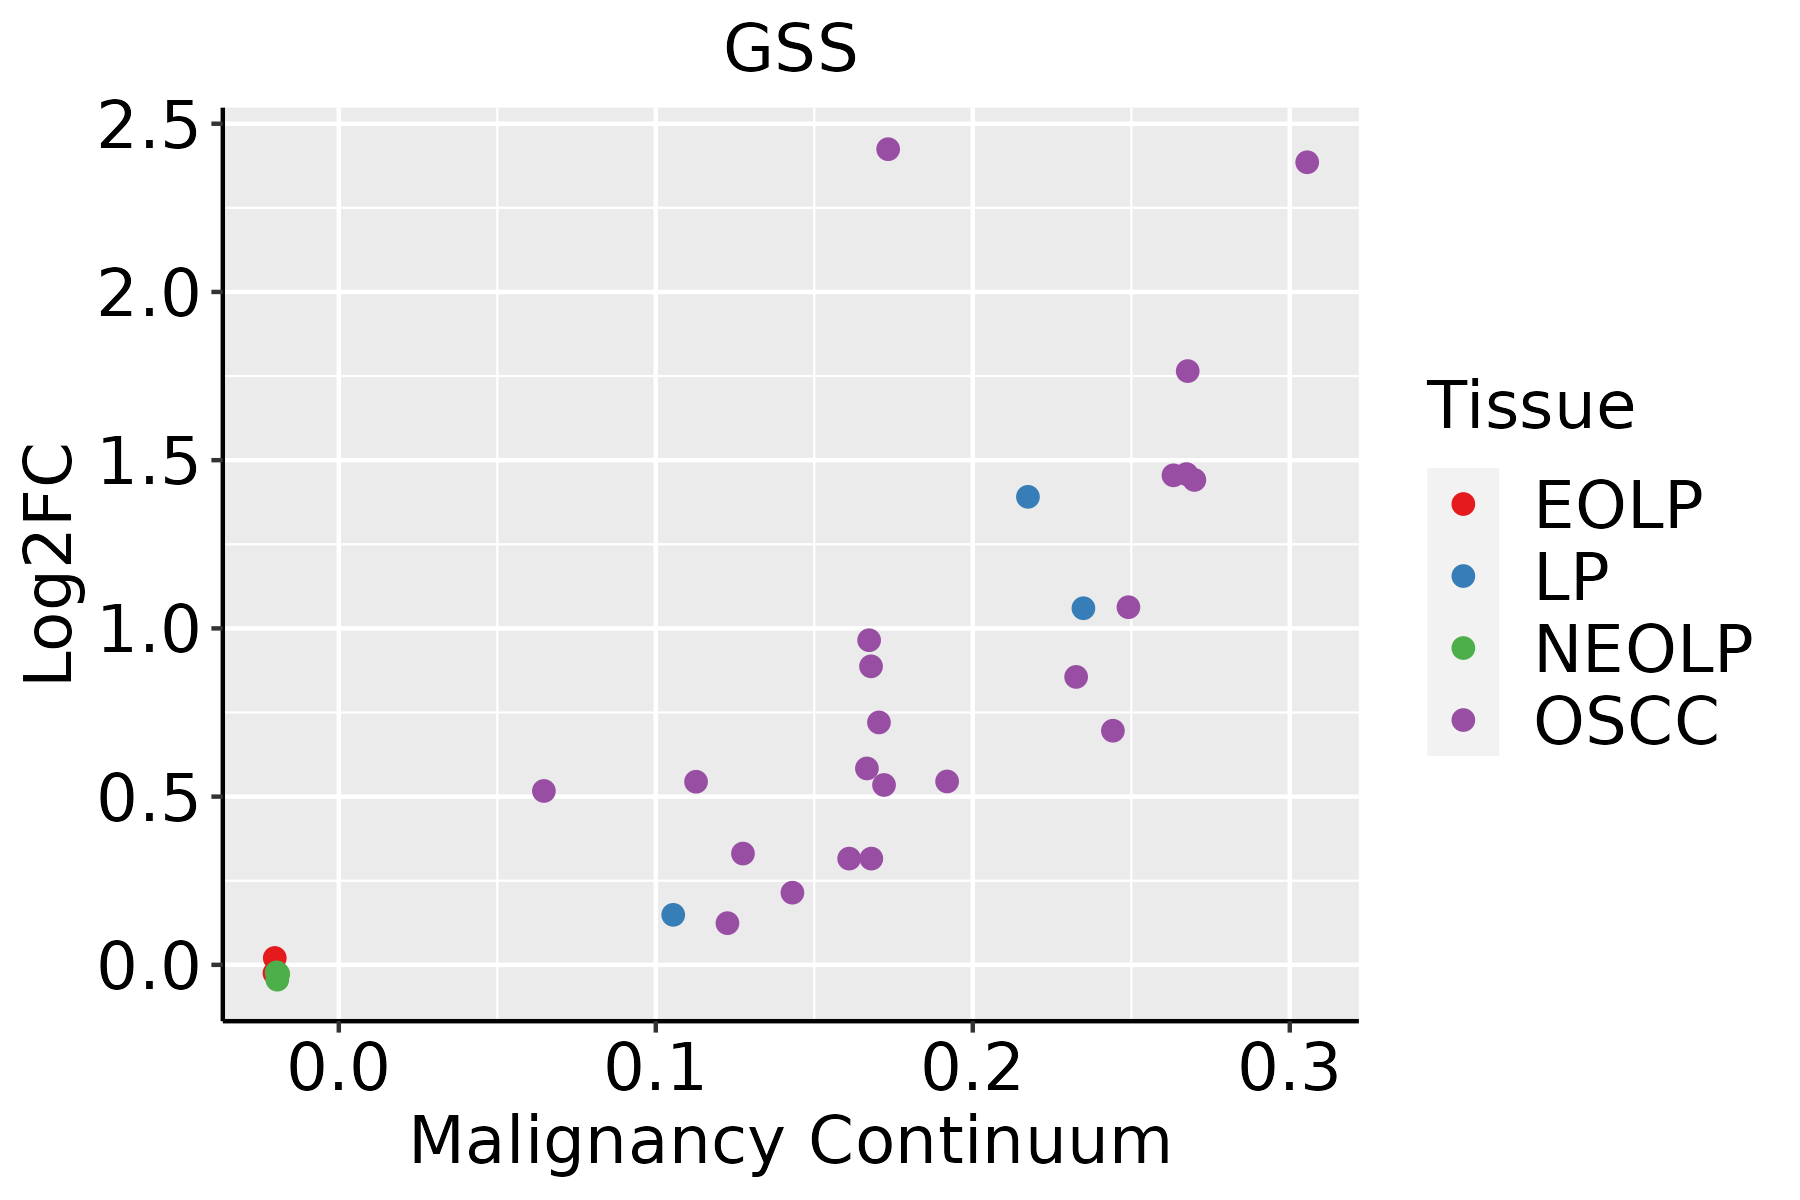 | EOLP: Erosive Oral lichen planus |
| LP: leukoplakia | ||
| NEOLP: Non-erosive oral lichen planus | ||
| OSCC: Oral squamous cell carcinoma | ||
| Skin | 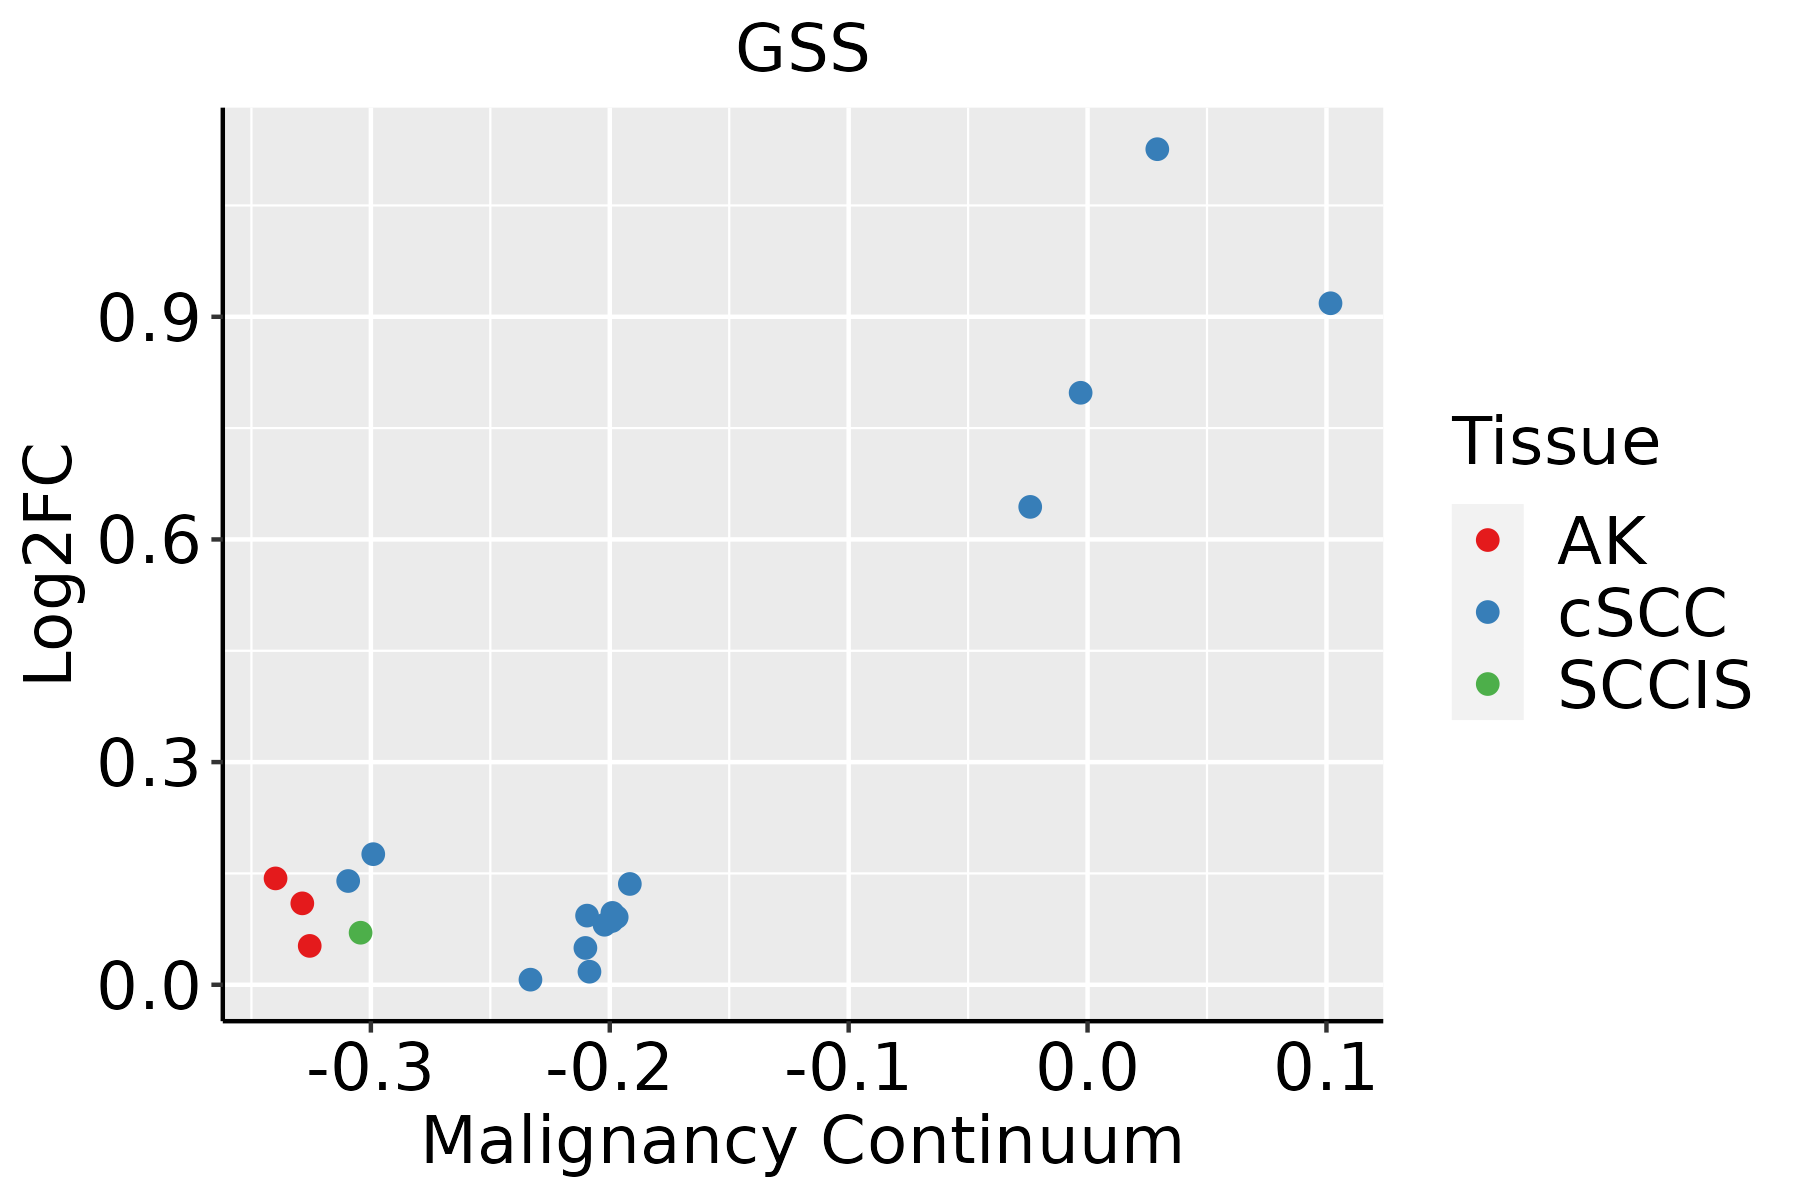 | AK: Actinic keratosis |
| cSCC: Cutaneous squamous cell carcinoma | ||
| SCCIS:squamous cell carcinoma in situ | ||
| Thyroid | 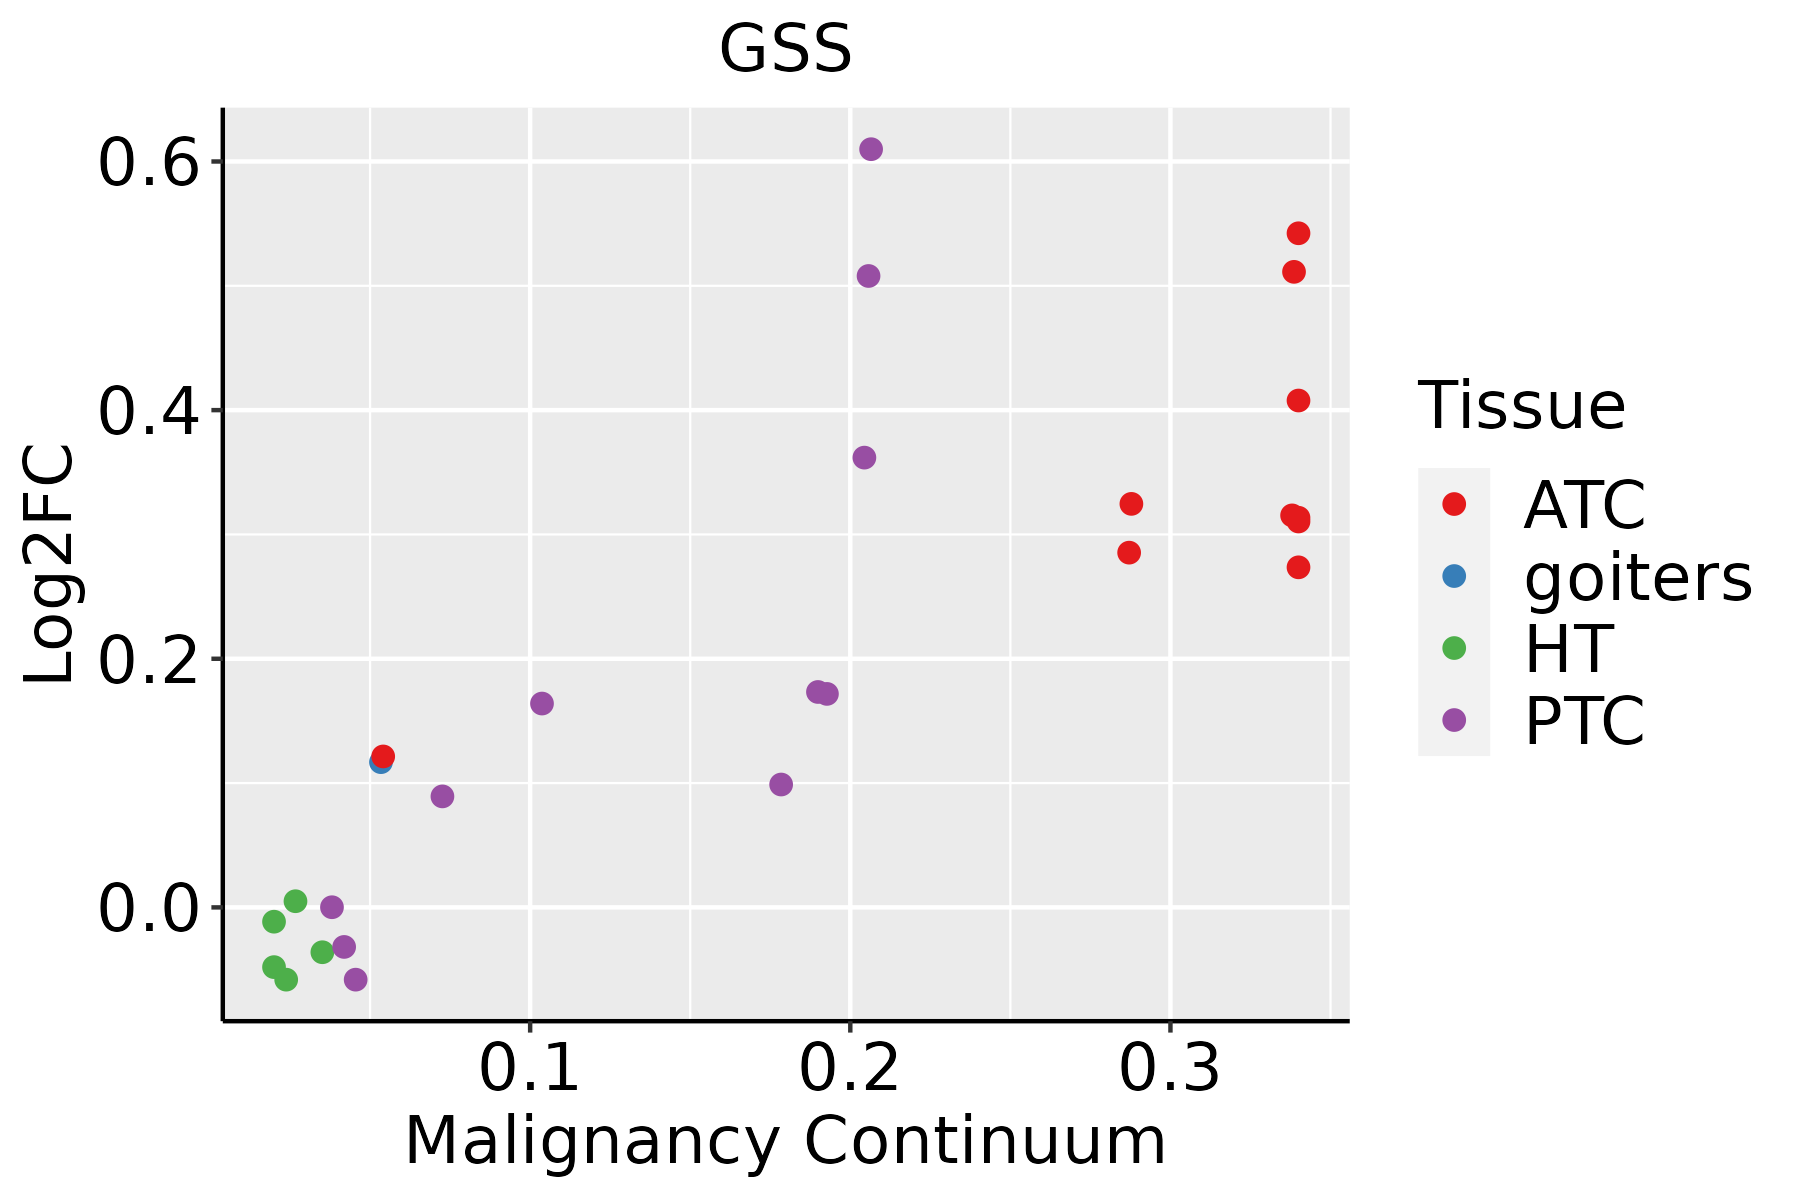 | ATC: Anaplastic thyroid cancer |
| HT: Hashimoto's thyroiditis | ||
| PTC: Papillary thyroid cancer |
| ∗log2FC in expression of this searched gene in stem-like cells from each diseased tissue sample relative to stem-like cells in normal samples in each tissue plotted against the malignancy continuum. Samples are colored based on if they are from different disease stage. |
Top |
Malignant transformation related pathway analysis |
| Find out the enriched GO biological processes and KEGG pathways involved in transition from healthy to precancer to cancer |
| Tissue | Disease Stage | Enriched GO biological Processes |
| Colorectum | AD |  |
| Colorectum | SER |  |
| Colorectum | MSS |  |
| Colorectum | MSI-H |  |
| Colorectum | FAP |  |
| ∗Top 15 enriched GO BP terms are showed in the bar plot of each disease state in each tissue. Each row represents a significant GO biological process which is colored according to the -log10(p.adjust). |
| Page: 1 2 3 4 5 6 7 8 9 |
| GO ID | Tissue | Disease Stage | Description | Gene Ratio | Bg Ratio | pvalue | p.adjust | Count |
| GO:0006979 | Colorectum | AD | response to oxidative stress | 145/3918 | 446/18723 | 5.16e-09 | 3.23e-07 | 145 |
| GO:0031667 | Colorectum | AD | response to nutrient levels | 138/3918 | 474/18723 | 1.22e-05 | 2.68e-04 | 138 |
| GO:0006790 | Colorectum | AD | sulfur compound metabolic process | 101/3918 | 339/18723 | 6.46e-05 | 1.07e-03 | 101 |
| GO:0009410 | Colorectum | AD | response to xenobiotic stimulus | 128/3918 | 462/18723 | 2.69e-04 | 3.31e-03 | 128 |
| GO:0007568 | Colorectum | AD | aging | 98/3918 | 339/18723 | 2.77e-04 | 3.39e-03 | 98 |
| GO:0046686 | Colorectum | AD | response to cadmium ion | 27/3918 | 68/18723 | 3.19e-04 | 3.80e-03 | 27 |
| GO:0010038 | Colorectum | AD | response to metal ion | 106/3918 | 373/18723 | 3.22e-04 | 3.83e-03 | 106 |
| GO:0006575 | Colorectum | AD | cellular modified amino acid metabolic process | 59/3918 | 188/18723 | 4.80e-04 | 5.27e-03 | 59 |
| GO:0006520 | Colorectum | AD | cellular amino acid metabolic process | 81/3918 | 284/18723 | 1.37e-03 | 1.19e-02 | 81 |
| GO:0042398 | Colorectum | AD | cellular modified amino acid biosynthetic process | 18/3918 | 46/18723 | 3.67e-03 | 2.60e-02 | 18 |
| GO:00069792 | Colorectum | MSS | response to oxidative stress | 128/3467 | 446/18723 | 7.65e-08 | 3.81e-06 | 128 |
| GO:00316672 | Colorectum | MSS | response to nutrient levels | 125/3467 | 474/18723 | 1.24e-05 | 2.88e-04 | 125 |
| GO:00423981 | Colorectum | MSS | cellular modified amino acid biosynthetic process | 20/3467 | 46/18723 | 8.26e-05 | 1.35e-03 | 20 |
| GO:00075681 | Colorectum | MSS | aging | 90/3467 | 339/18723 | 1.51e-04 | 2.19e-03 | 90 |
| GO:00065751 | Colorectum | MSS | cellular modified amino acid metabolic process | 55/3467 | 188/18723 | 2.16e-04 | 3.01e-03 | 55 |
| GO:00067902 | Colorectum | MSS | sulfur compound metabolic process | 85/3467 | 339/18723 | 1.52e-03 | 1.39e-02 | 85 |
| GO:00094101 | Colorectum | MSS | response to xenobiotic stimulus | 110/3467 | 462/18723 | 2.36e-03 | 1.92e-02 | 110 |
| GO:00100382 | Colorectum | MSS | response to metal ion | 90/3467 | 373/18723 | 3.76e-03 | 2.76e-02 | 90 |
| GO:00069794 | Colorectum | FAP | response to oxidative stress | 102/2622 | 446/18723 | 2.29e-07 | 1.33e-05 | 102 |
| GO:00316673 | Colorectum | FAP | response to nutrient levels | 95/2622 | 474/18723 | 1.59e-04 | 2.43e-03 | 95 |
| Page: 1 2 3 4 5 6 |
| Pathway ID | Tissue | Disease Stage | Description | Gene Ratio | Bg Ratio | pvalue | p.adjust | qvalue | Count |
| hsa04216 | Colorectum | AD | Ferroptosis | 21/2092 | 41/8465 | 2.23e-04 | 1.78e-03 | 1.13e-03 | 21 |
| hsa00480 | Colorectum | AD | Glutathione metabolism | 23/2092 | 57/8465 | 6.52e-03 | 2.76e-02 | 1.76e-02 | 23 |
| hsa042161 | Colorectum | AD | Ferroptosis | 21/2092 | 41/8465 | 2.23e-04 | 1.78e-03 | 1.13e-03 | 21 |
| hsa004801 | Colorectum | AD | Glutathione metabolism | 23/2092 | 57/8465 | 6.52e-03 | 2.76e-02 | 1.76e-02 | 23 |
| hsa042162 | Colorectum | MSS | Ferroptosis | 18/1875 | 41/8465 | 1.53e-03 | 8.53e-03 | 5.23e-03 | 18 |
| hsa004802 | Colorectum | MSS | Glutathione metabolism | 22/1875 | 57/8465 | 3.58e-03 | 1.64e-02 | 1.01e-02 | 22 |
| hsa042163 | Colorectum | MSS | Ferroptosis | 18/1875 | 41/8465 | 1.53e-03 | 8.53e-03 | 5.23e-03 | 18 |
| hsa004803 | Colorectum | MSS | Glutathione metabolism | 22/1875 | 57/8465 | 3.58e-03 | 1.64e-02 | 1.01e-02 | 22 |
| hsa042164 | Colorectum | FAP | Ferroptosis | 18/1404 | 41/8465 | 3.49e-05 | 3.65e-04 | 2.22e-04 | 18 |
| hsa042165 | Colorectum | FAP | Ferroptosis | 18/1404 | 41/8465 | 3.49e-05 | 3.65e-04 | 2.22e-04 | 18 |
| hsa0421628 | Esophagus | HGIN | Ferroptosis | 15/1383 | 41/8465 | 1.35e-03 | 1.26e-02 | 1.00e-02 | 15 |
| hsa04216111 | Esophagus | HGIN | Ferroptosis | 15/1383 | 41/8465 | 1.35e-03 | 1.26e-02 | 1.00e-02 | 15 |
| hsa0048018 | Esophagus | ESCC | Glutathione metabolism | 44/4205 | 57/8465 | 1.81e-05 | 9.03e-05 | 4.63e-05 | 44 |
| hsa0421629 | Esophagus | ESCC | Ferroptosis | 33/4205 | 41/8465 | 4.58e-05 | 1.99e-04 | 1.02e-04 | 33 |
| hsa012405 | Esophagus | ESCC | Biosynthesis of cofactors | 97/4205 | 153/8465 | 3.88e-04 | 1.35e-03 | 6.94e-04 | 97 |
| hsa0048019 | Esophagus | ESCC | Glutathione metabolism | 44/4205 | 57/8465 | 1.81e-05 | 9.03e-05 | 4.63e-05 | 44 |
| hsa0421638 | Esophagus | ESCC | Ferroptosis | 33/4205 | 41/8465 | 4.58e-05 | 1.99e-04 | 1.02e-04 | 33 |
| hsa0124012 | Esophagus | ESCC | Biosynthesis of cofactors | 97/4205 | 153/8465 | 3.88e-04 | 1.35e-03 | 6.94e-04 | 97 |
| hsa012402 | Liver | HCC | Biosynthesis of cofactors | 103/4020 | 153/8465 | 4.67e-07 | 5.05e-06 | 2.81e-06 | 103 |
| hsa0421641 | Liver | HCC | Ferroptosis | 33/4020 | 41/8465 | 1.42e-05 | 9.88e-05 | 5.50e-05 | 33 |
| Page: 1 2 |
Top |
Cell-cell communication analysis |
| Identification of potential cell-cell interactions between two cell types and their ligand-receptor pairs for different disease states |
| Ligand | Receptor | LRpair | Pathway | Tissue | Disease Stage |
| Page: 1 |
Top |
Single-cell gene regulatory network inference analysis |
| Find out the significant the regulons (TFs) and the target genes of each regulon across cell types for different disease states |
| TF | Cell Type | Tissue | Disease Stage | Target Gene | RSS | Regulon Activity |
| ∗The dot plots of a searched regulon are shown for all cell subpopulations in each disease state of each tissue based on the regulon specific score inferred using pySCENIC and by calculating the average expression. |
| Page: 1 |
Top |
Somatic mutation of malignant transformation related genes |
| Annotation of somatic variants for genes involved in malignant transformation |
| Hugo Symbol | Variant Class | Variant Classification | dbSNP RS | HGVSc | HGVSp | HGVSp Short | SWISSPROT | BIOTYPE | SIFT | PolyPhen | Tumor Sample Barcode | Tissue | Histology | Sex | Age | Stage | Therapy Types | Drugs | Outcome |
| GSS | SNV | Missense_Mutation | c.376N>G | p.Ser126Ala | p.S126A | P48637 | protein_coding | deleterious(0.04) | probably_damaging(0.984) | TCGA-A8-A08R-01 | Breast | breast invasive carcinoma | Female | <65 | I/II | Unknown | Unknown | SD | |
| GSS | SNV | Missense_Mutation | c.523G>C | p.Glu175Gln | p.E175Q | P48637 | protein_coding | tolerated(0.09) | probably_damaging(0.919) | TCGA-AC-A23H-01 | Breast | breast invasive carcinoma | Female | >=65 | I/II | Unknown | Unknown | PD | |
| GSS | SNV | Missense_Mutation | c.1139N>C | p.Val380Ala | p.V380A | P48637 | protein_coding | tolerated(0.74) | benign(0.005) | TCGA-D8-A1JK-01 | Breast | breast invasive carcinoma | Female | >=65 | I/II | Unknown | Unknown | SD | |
| GSS | SNV | Missense_Mutation | rs531425565 | c.268N>G | p.Leu90Val | p.L90V | P48637 | protein_coding | deleterious(0) | probably_damaging(0.955) | TCGA-VS-A958-01 | Cervix | cervical & endocervical cancer | Female | <65 | I/II | Chemotherapy | cisplatin | CR |
| GSS | SNV | Missense_Mutation | novel | c.928N>A | p.Glu310Lys | p.E310K | P48637 | protein_coding | tolerated(0.26) | probably_damaging(0.988) | TCGA-VS-A9UP-01 | Cervix | cervical & endocervical cancer | Female | <65 | I/II | Chemotherapy | cisplatin | PD |
| GSS | SNV | Missense_Mutation | c.940C>T | p.Pro314Ser | p.P314S | P48637 | protein_coding | deleterious(0.03) | benign(0.413) | TCGA-AA-A00N-01 | Colorectum | colon adenocarcinoma | Male | >=65 | I/II | Unknown | Unknown | PD | |
| GSS | SNV | Missense_Mutation | c.1328A>C | p.Lys443Thr | p.K443T | P48637 | protein_coding | tolerated(0.06) | possibly_damaging(0.672) | TCGA-AA-A010-01 | Colorectum | colon adenocarcinoma | Female | <65 | I/II | Chemotherapy | folinic | CR | |
| GSS | SNV | Missense_Mutation | rs780544238 | c.755N>A | p.Arg252Gln | p.R252Q | P48637 | protein_coding | deleterious(0.05) | benign(0.125) | TCGA-AA-A022-01 | Colorectum | colon adenocarcinoma | Female | >=65 | I/II | Unknown | Unknown | SD |
| GSS | SNV | Missense_Mutation | novel | c.541T>C | p.Ser181Pro | p.S181P | P48637 | protein_coding | tolerated(0.4) | benign(0.001) | TCGA-AG-A00Y-01 | Colorectum | rectum adenocarcinoma | Male | >=65 | I/II | Unknown | Unknown | PD |
| GSS | SNV | Missense_Mutation | rs140328832 | c.430N>A | p.Glu144Lys | p.E144K | P48637 | protein_coding | deleterious(0) | probably_damaging(0.998) | TCGA-A5-A0G1-01 | Endometrium | uterine corpus endometrioid carcinoma | Female | >=65 | I/II | Unknown | Unknown | SD |
| Page: 1 2 3 4 |
Top |
Related drugs of malignant transformation related genes |
| Identification of chemicals and drugs interact with genes involved in malignant transfromation |
| (DGIdb 4.0) |
| Entrez ID | Symbol | Category | Interaction Types | Drug Claim Name | Drug Name | PMIDs |
| Page: 1 |

Copyright 2023-Present -The University of Texas Health Science Center at Houston |