
|
|||||
|
 | |
| |
| |
| |
| |
| |
|
Gene: GSR |
Gene summary for GSR |
| Gene information | Species | Human | Gene symbol | GSR | Gene ID | 2936 |
| Gene name | glutathione-disulfide reductase | |
| Gene Alias | GR | |
| Cytomap | 8p12 | |
| Gene Type | protein-coding | GO ID | GO:0006091 | UniProtAcc | P00390 |
Top |
Malignant transformation analysis |
| Identification of the aberrant gene expression in precancerous and cancerous lesions by comparing the gene expression of stem-like cells in diseased tissues with normal stem cells |
| Entrez ID | Symbol | Replicates | Species | Organ | Tissue | Adj P-value | Log2FC | Malignancy |
| 2936 | GSR | HTA11_347_2000001011 | Human | Colorectum | AD | 4.73e-10 | 5.70e-01 | -0.1954 |
| 2936 | GSR | HTA11_7862_2000001011 | Human | Colorectum | AD | 3.09e-07 | 7.01e-01 | -0.0179 |
| 2936 | GSR | HTA11_99999970781_79442 | Human | Colorectum | MSS | 9.80e-04 | 3.89e-01 | 0.294 |
| 2936 | GSR | A002-C-010 | Human | Colorectum | FAP | 3.43e-04 | -1.81e-01 | 0.242 |
| 2936 | GSR | A015-C-203 | Human | Colorectum | FAP | 3.88e-11 | -2.14e-01 | -0.1294 |
| 2936 | GSR | A014-C-040 | Human | Colorectum | FAP | 2.17e-02 | -4.03e-01 | -0.1184 |
| 2936 | GSR | A002-C-201 | Human | Colorectum | FAP | 1.66e-05 | -1.29e-01 | 0.0324 |
| 2936 | GSR | A002-C-203 | Human | Colorectum | FAP | 3.15e-04 | -1.98e-01 | 0.2786 |
| 2936 | GSR | A001-C-108 | Human | Colorectum | FAP | 4.27e-05 | -2.16e-01 | -0.0272 |
| 2936 | GSR | A002-C-205 | Human | Colorectum | FAP | 7.02e-10 | -2.20e-01 | -0.1236 |
| 2936 | GSR | A015-C-006 | Human | Colorectum | FAP | 9.72e-06 | -2.40e-01 | -0.0994 |
| 2936 | GSR | A015-C-106 | Human | Colorectum | FAP | 1.02e-03 | -9.38e-02 | -0.0511 |
| 2936 | GSR | A002-C-114 | Human | Colorectum | FAP | 2.37e-07 | -2.01e-01 | -0.1561 |
| 2936 | GSR | A015-C-104 | Human | Colorectum | FAP | 1.67e-12 | -1.95e-01 | -0.1899 |
| 2936 | GSR | A001-C-014 | Human | Colorectum | FAP | 4.47e-04 | -1.81e-01 | 0.0135 |
| 2936 | GSR | A002-C-016 | Human | Colorectum | FAP | 4.67e-09 | -8.35e-02 | 0.0521 |
| 2936 | GSR | A015-C-002 | Human | Colorectum | FAP | 9.21e-04 | -1.48e-01 | -0.0763 |
| 2936 | GSR | A001-C-203 | Human | Colorectum | FAP | 2.72e-03 | -1.34e-01 | -0.0481 |
| 2936 | GSR | A002-C-116 | Human | Colorectum | FAP | 2.55e-15 | -1.20e-01 | -0.0452 |
| 2936 | GSR | A014-C-008 | Human | Colorectum | FAP | 2.66e-05 | -2.18e-01 | -0.191 |
| Page: 1 2 3 4 5 |
| Tissue | Expression Dynamics | Abbreviation |
| Colorectum (GSE201348) | 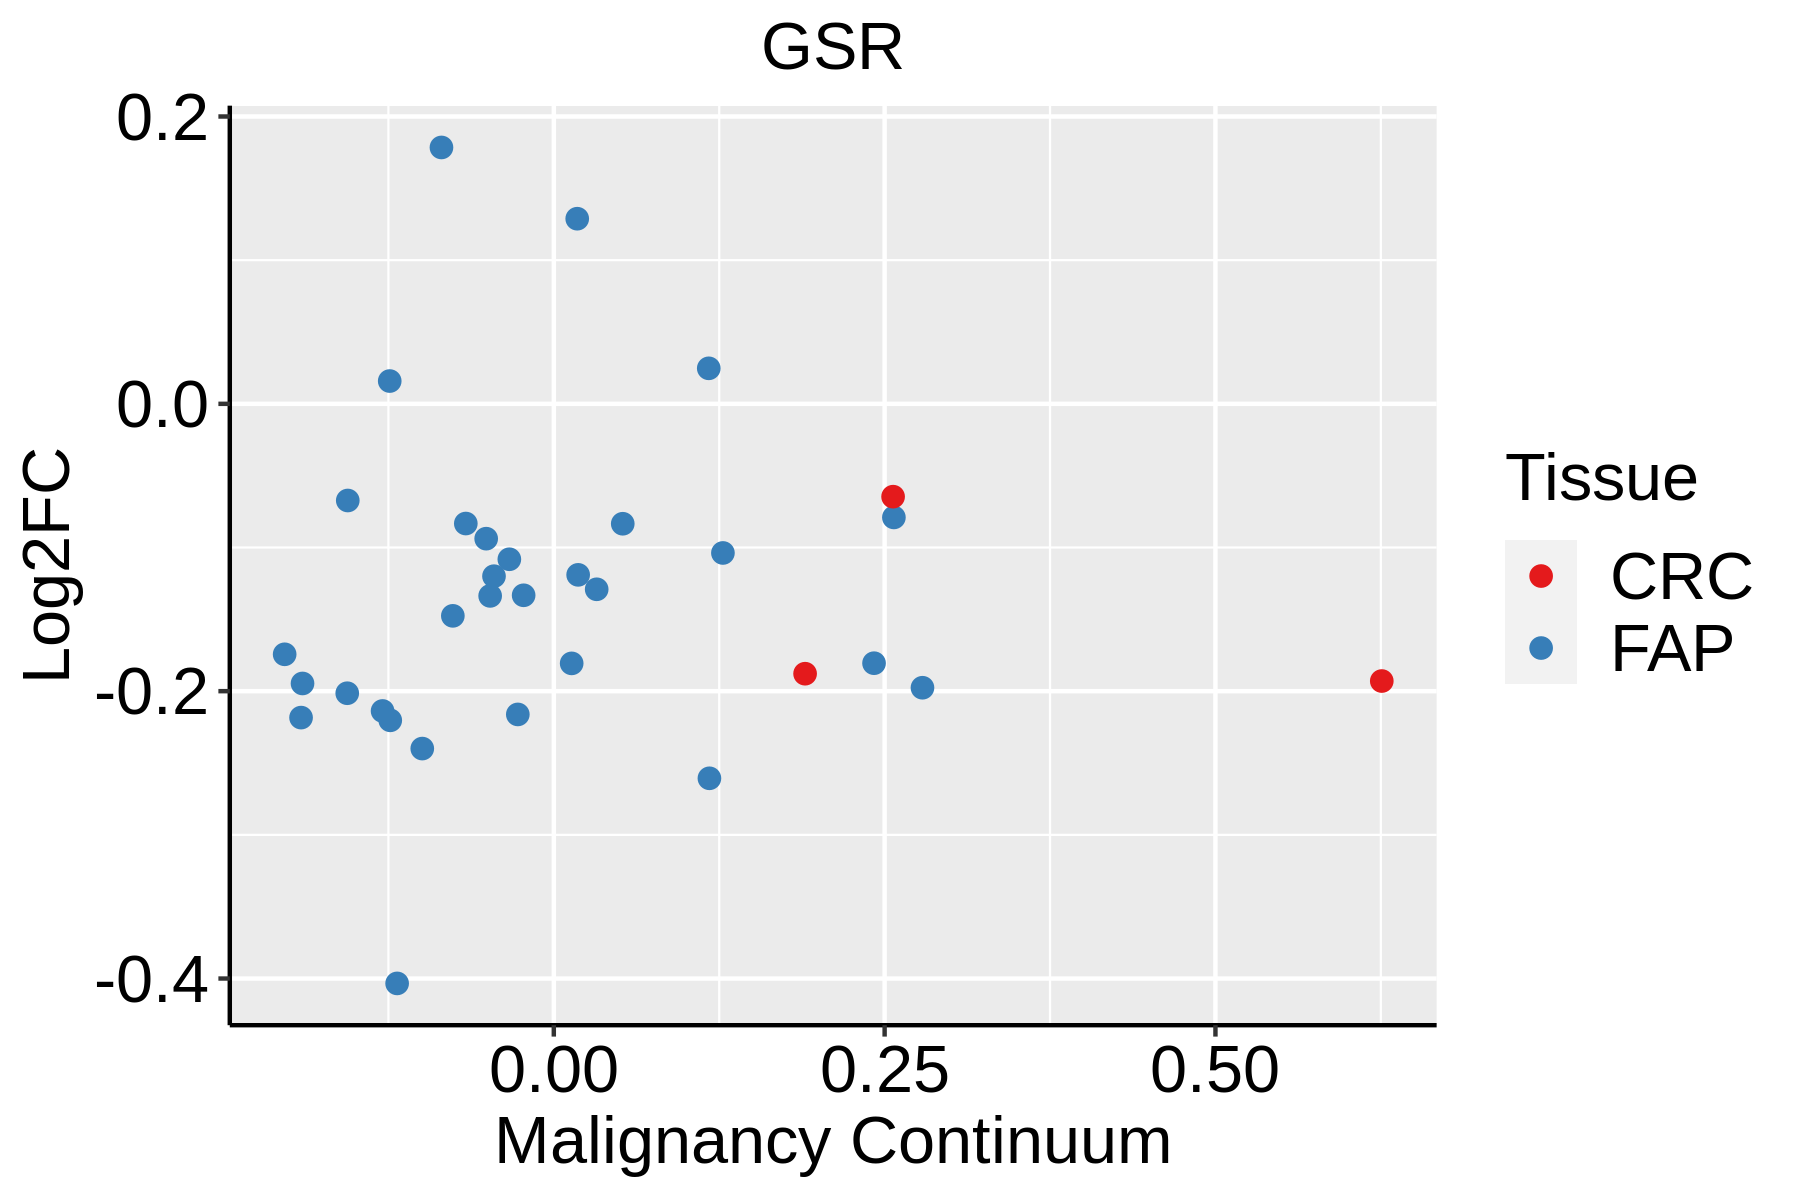 | FAP: Familial adenomatous polyposis |
| CRC: Colorectal cancer | ||
| Colorectum (HTA11) |  | AD: Adenomas |
| SER: Sessile serrated lesions | ||
| MSI-H: Microsatellite-high colorectal cancer | ||
| MSS: Microsatellite stable colorectal cancer | ||
| Esophagus | 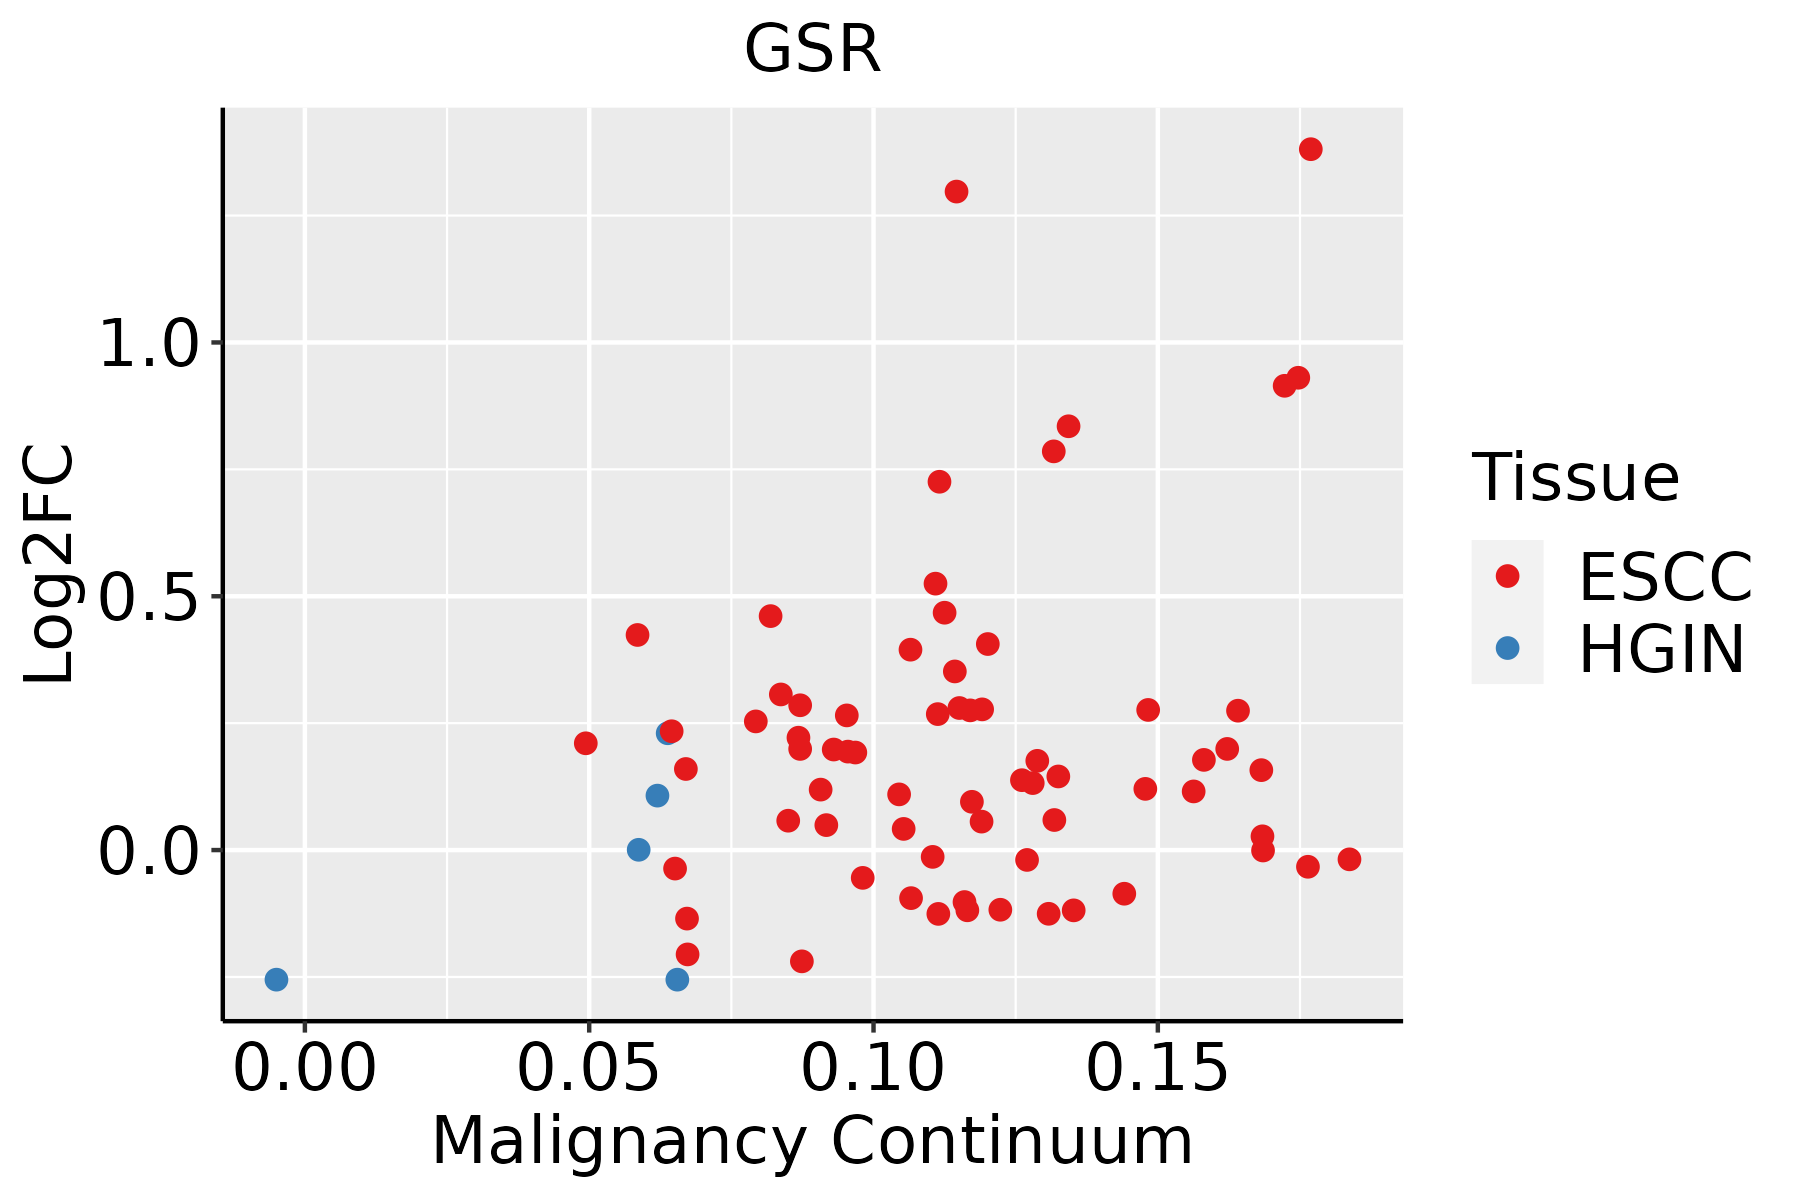 | ESCC: Esophageal squamous cell carcinoma |
| HGIN: High-grade intraepithelial neoplasias | ||
| LGIN: Low-grade intraepithelial neoplasias | ||
| Liver | 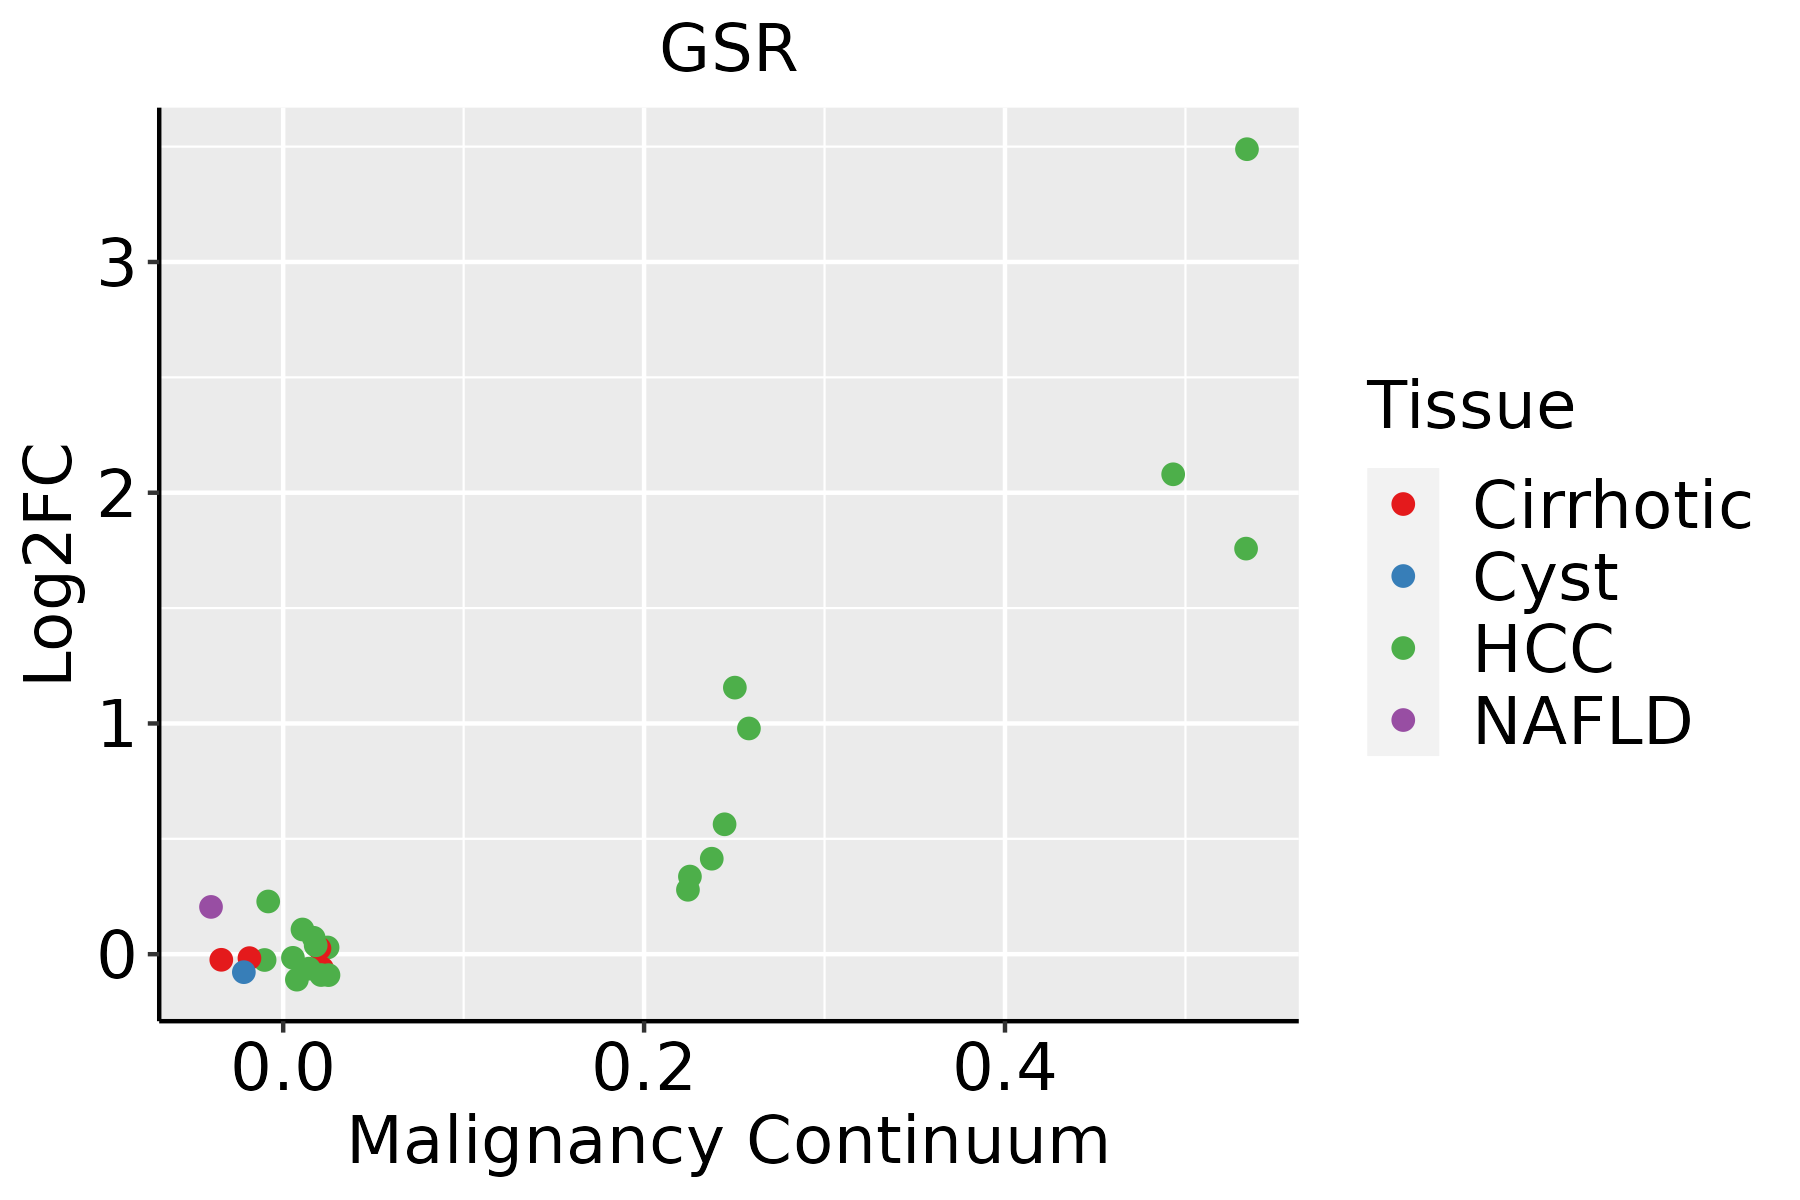 | HCC: Hepatocellular carcinoma |
| NAFLD: Non-alcoholic fatty liver disease | ||
| Oral Cavity | 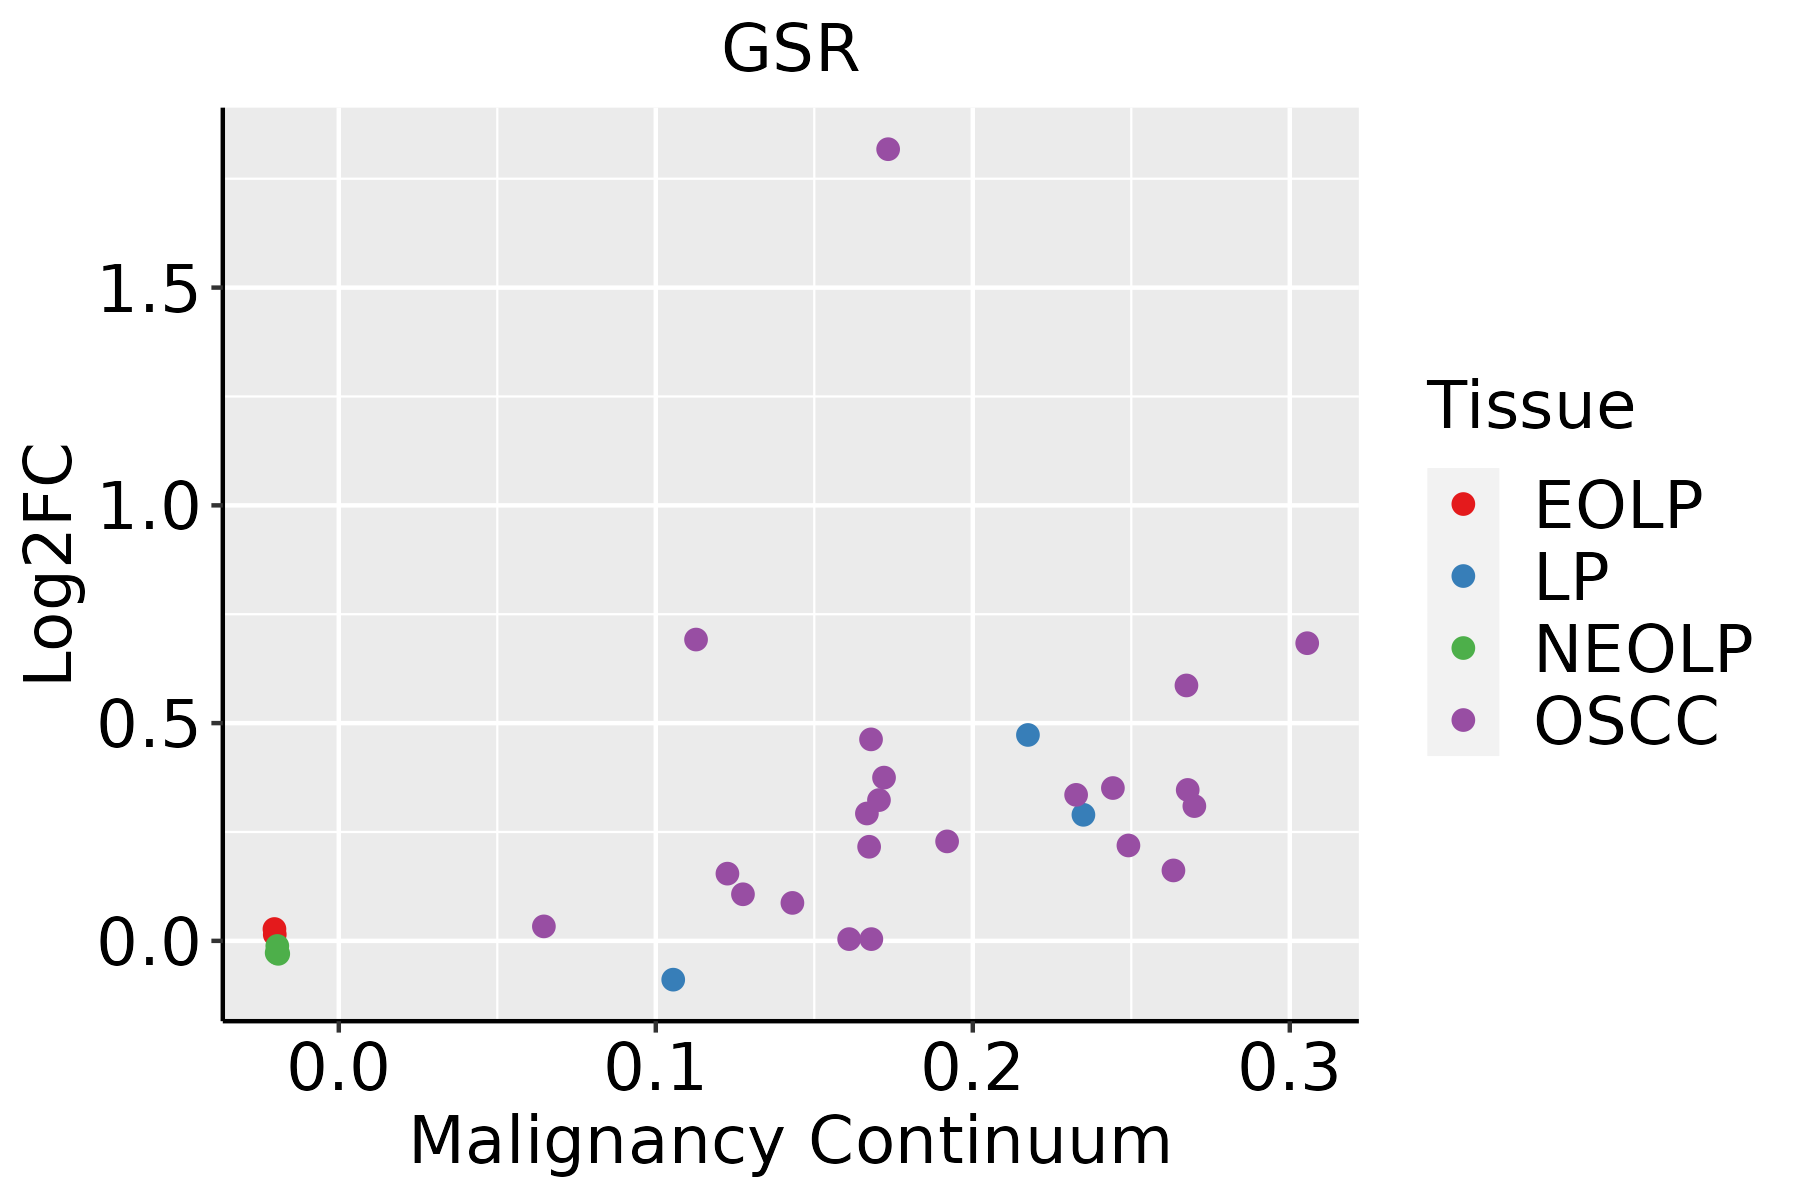 | EOLP: Erosive Oral lichen planus |
| LP: leukoplakia | ||
| NEOLP: Non-erosive oral lichen planus | ||
| OSCC: Oral squamous cell carcinoma |
| ∗log2FC in expression of this searched gene in stem-like cells from each diseased tissue sample relative to stem-like cells in normal samples in each tissue plotted against the malignancy continuum. Samples are colored based on if they are from different disease stage. |
Top |
Malignant transformation related pathway analysis |
| Find out the enriched GO biological processes and KEGG pathways involved in transition from healthy to precancer to cancer |
| Tissue | Disease Stage | Enriched GO biological Processes |
| Colorectum | AD |  |
| Colorectum | SER |  |
| Colorectum | MSS |  |
| Colorectum | MSI-H |  |
| Colorectum | FAP |  |
| ∗Top 15 enriched GO BP terms are showed in the bar plot of each disease state in each tissue. Each row represents a significant GO biological process which is colored according to the -log10(p.adjust). |
| Page: 1 2 3 4 5 6 7 8 9 |
| GO ID | Tissue | Disease Stage | Description | Gene Ratio | Bg Ratio | pvalue | p.adjust | Count |
| GO:0006091 | Colorectum | AD | generation of precursor metabolites and energy | 209/3918 | 490/18723 | 3.17e-28 | 6.61e-25 | 209 |
| GO:0022900 | Colorectum | AD | electron transport chain | 89/3918 | 175/18723 | 1.42e-18 | 8.91e-16 | 89 |
| GO:0006979 | Colorectum | AD | response to oxidative stress | 145/3918 | 446/18723 | 5.16e-09 | 3.23e-07 | 145 |
| GO:0062197 | Colorectum | AD | cellular response to chemical stress | 109/3918 | 337/18723 | 5.33e-07 | 1.95e-05 | 109 |
| GO:0009636 | Colorectum | AD | response to toxic substance | 88/3918 | 262/18723 | 1.12e-06 | 3.72e-05 | 88 |
| GO:0034599 | Colorectum | AD | cellular response to oxidative stress | 94/3918 | 288/18723 | 2.03e-06 | 6.02e-05 | 94 |
| GO:0098754 | Colorectum | AD | detoxification | 53/3918 | 152/18723 | 4.63e-05 | 7.98e-04 | 53 |
| GO:0006790 | Colorectum | AD | sulfur compound metabolic process | 101/3918 | 339/18723 | 6.46e-05 | 1.07e-03 | 101 |
| GO:0097237 | Colorectum | AD | cellular response to toxic substance | 44/3918 | 124/18723 | 1.24e-04 | 1.80e-03 | 44 |
| GO:1990748 | Colorectum | AD | cellular detoxification | 41/3918 | 116/18723 | 2.29e-04 | 2.97e-03 | 41 |
| GO:0006575 | Colorectum | AD | cellular modified amino acid metabolic process | 59/3918 | 188/18723 | 4.80e-04 | 5.27e-03 | 59 |
| GO:0098869 | Colorectum | AD | cellular oxidant detoxification | 33/3918 | 101/18723 | 3.88e-03 | 2.72e-02 | 33 |
| GO:0045454 | Colorectum | AD | cell redox homeostasis | 14/3918 | 35/18723 | 7.92e-03 | 4.73e-02 | 14 |
| GO:00060912 | Colorectum | MSS | generation of precursor metabolites and energy | 186/3467 | 490/18723 | 1.14e-24 | 2.15e-21 | 186 |
| GO:00229002 | Colorectum | MSS | electron transport chain | 83/3467 | 175/18723 | 2.06e-18 | 1.17e-15 | 83 |
| GO:00069792 | Colorectum | MSS | response to oxidative stress | 128/3467 | 446/18723 | 7.65e-08 | 3.81e-06 | 128 |
| GO:00621972 | Colorectum | MSS | cellular response to chemical stress | 102/3467 | 337/18723 | 9.73e-08 | 4.71e-06 | 102 |
| GO:00345992 | Colorectum | MSS | cellular response to oxidative stress | 88/3467 | 288/18723 | 4.58e-07 | 1.77e-05 | 88 |
| GO:00096362 | Colorectum | MSS | response to toxic substance | 73/3467 | 262/18723 | 1.26e-04 | 1.94e-03 | 73 |
| GO:00065751 | Colorectum | MSS | cellular modified amino acid metabolic process | 55/3467 | 188/18723 | 2.16e-04 | 3.01e-03 | 55 |
| Page: 1 2 3 4 |
| Pathway ID | Tissue | Disease Stage | Description | Gene Ratio | Bg Ratio | pvalue | p.adjust | qvalue | Count |
| hsa05415 | Colorectum | AD | Diabetic cardiomyopathy | 114/2092 | 203/8465 | 3.65e-22 | 3.06e-20 | 1.95e-20 | 114 |
| hsa00480 | Colorectum | AD | Glutathione metabolism | 23/2092 | 57/8465 | 6.52e-03 | 2.76e-02 | 1.76e-02 | 23 |
| hsa054151 | Colorectum | AD | Diabetic cardiomyopathy | 114/2092 | 203/8465 | 3.65e-22 | 3.06e-20 | 1.95e-20 | 114 |
| hsa004801 | Colorectum | AD | Glutathione metabolism | 23/2092 | 57/8465 | 6.52e-03 | 2.76e-02 | 1.76e-02 | 23 |
| hsa054154 | Colorectum | MSS | Diabetic cardiomyopathy | 106/1875 | 203/8465 | 2.47e-21 | 1.62e-19 | 9.92e-20 | 106 |
| hsa004802 | Colorectum | MSS | Glutathione metabolism | 22/1875 | 57/8465 | 3.58e-03 | 1.64e-02 | 1.01e-02 | 22 |
| hsa054155 | Colorectum | MSS | Diabetic cardiomyopathy | 106/1875 | 203/8465 | 2.47e-21 | 1.62e-19 | 9.92e-20 | 106 |
| hsa004803 | Colorectum | MSS | Glutathione metabolism | 22/1875 | 57/8465 | 3.58e-03 | 1.64e-02 | 1.01e-02 | 22 |
| hsa054158 | Colorectum | FAP | Diabetic cardiomyopathy | 70/1404 | 203/8465 | 2.62e-10 | 2.18e-08 | 1.33e-08 | 70 |
| hsa054159 | Colorectum | FAP | Diabetic cardiomyopathy | 70/1404 | 203/8465 | 2.62e-10 | 2.18e-08 | 1.33e-08 | 70 |
| hsa05415211 | Esophagus | ESCC | Diabetic cardiomyopathy | 146/4205 | 203/8465 | 5.81e-11 | 7.78e-10 | 3.99e-10 | 146 |
| hsa0048018 | Esophagus | ESCC | Glutathione metabolism | 44/4205 | 57/8465 | 1.81e-05 | 9.03e-05 | 4.63e-05 | 44 |
| hsa0541538 | Esophagus | ESCC | Diabetic cardiomyopathy | 146/4205 | 203/8465 | 5.81e-11 | 7.78e-10 | 3.99e-10 | 146 |
| hsa0048019 | Esophagus | ESCC | Glutathione metabolism | 44/4205 | 57/8465 | 1.81e-05 | 9.03e-05 | 4.63e-05 | 44 |
| hsa0541522 | Liver | HCC | Diabetic cardiomyopathy | 151/4020 | 203/8465 | 2.72e-15 | 1.01e-13 | 5.63e-14 | 151 |
| hsa0048022 | Liver | HCC | Glutathione metabolism | 42/4020 | 57/8465 | 5.00e-05 | 2.62e-04 | 1.46e-04 | 42 |
| hsa0541532 | Liver | HCC | Diabetic cardiomyopathy | 151/4020 | 203/8465 | 2.72e-15 | 1.01e-13 | 5.63e-14 | 151 |
| hsa0048032 | Liver | HCC | Glutathione metabolism | 42/4020 | 57/8465 | 5.00e-05 | 2.62e-04 | 1.46e-04 | 42 |
| hsa0541529 | Oral cavity | OSCC | Diabetic cardiomyopathy | 131/3704 | 203/8465 | 1.33e-09 | 1.49e-08 | 7.57e-09 | 131 |
| hsa0048016 | Oral cavity | OSCC | Glutathione metabolism | 36/3704 | 57/8465 | 2.41e-03 | 6.41e-03 | 3.26e-03 | 36 |
| Page: 1 2 |
Top |
Cell-cell communication analysis |
| Identification of potential cell-cell interactions between two cell types and their ligand-receptor pairs for different disease states |
| Ligand | Receptor | LRpair | Pathway | Tissue | Disease Stage |
| Page: 1 |
Top |
Single-cell gene regulatory network inference analysis |
| Find out the significant the regulons (TFs) and the target genes of each regulon across cell types for different disease states |
| TF | Cell Type | Tissue | Disease Stage | Target Gene | RSS | Regulon Activity |
| ∗The dot plots of a searched regulon are shown for all cell subpopulations in each disease state of each tissue based on the regulon specific score inferred using pySCENIC and by calculating the average expression. |
| Page: 1 |
Top |
Somatic mutation of malignant transformation related genes |
| Annotation of somatic variants for genes involved in malignant transformation |
| Hugo Symbol | Variant Class | Variant Classification | dbSNP RS | HGVSc | HGVSp | HGVSp Short | SWISSPROT | BIOTYPE | SIFT | PolyPhen | Tumor Sample Barcode | Tissue | Histology | Sex | Age | Stage | Therapy Types | Drugs | Outcome |
| GSR | insertion | Nonsense_Mutation | novel | c.1436_1437insAGGTCTTTAACACTTTATTTCTATTAGGTTTTACC | p.Met479IlefsTer4 | p.M479Ifs*4 | P00390 | protein_coding | TCGA-AO-A03T-01 | Breast | breast invasive carcinoma | Female | <65 | I/II | Chemotherapy | cyclophosphamide | SD | ||
| GSR | deletion | Frame_Shift_Del | c.1259delN | p.Pro420LeufsTer18 | p.P420Lfs*18 | P00390 | protein_coding | TCGA-D8-A1XQ-01 | Breast | breast invasive carcinoma | Female | >=65 | I/II | Unknown | Unknown | SD | |||
| GSR | SNV | Missense_Mutation | novel | c.1354N>A | p.His452Asn | p.H452N | P00390 | protein_coding | tolerated(0.17) | probably_damaging(0.979) | TCGA-MA-AA41-01 | Cervix | cervical & endocervical cancer | Female | <65 | I/II | Unknown | Unknown | SD |
| GSR | SNV | Missense_Mutation | rs779830894 | c.1081N>A | p.Glu361Lys | p.E361K | P00390 | protein_coding | tolerated(0.43) | possibly_damaging(0.774) | TCGA-AA-3977-01 | Colorectum | colon adenocarcinoma | Male | >=65 | I/II | Unknown | Unknown | SD |
| GSR | SNV | Missense_Mutation | c.1416N>C | p.Glu472Asp | p.E472D | P00390 | protein_coding | deleterious(0.02) | probably_damaging(0.959) | TCGA-AA-A03F-01 | Colorectum | colon adenocarcinoma | Female | >=65 | III/IV | Unknown | Unknown | PD | |
| GSR | SNV | Missense_Mutation | rs138721223 | c.1075N>A | p.Val359Ile | p.V359I | P00390 | protein_coding | deleterious(0) | probably_damaging(0.995) | TCGA-AD-A5EJ-01 | Colorectum | colon adenocarcinoma | Female | >=65 | I/II | Unknown | Unknown | SD |
| GSR | SNV | Missense_Mutation | rs758849140 | c.607N>G | p.Met203Val | p.M203V | P00390 | protein_coding | tolerated(0.55) | benign(0) | TCGA-AD-A5EJ-01 | Colorectum | colon adenocarcinoma | Female | >=65 | I/II | Unknown | Unknown | SD |
| GSR | SNV | Missense_Mutation | rs779830894 | c.1081N>A | p.Glu361Lys | p.E361K | P00390 | protein_coding | tolerated(0.43) | possibly_damaging(0.774) | TCGA-AZ-4315-01 | Colorectum | colon adenocarcinoma | Male | <65 | I/II | Unknown | Unknown | SD |
| GSR | deletion | Frame_Shift_Del | c.1259delN | p.Pro420LeufsTer18 | p.P420Lfs*18 | P00390 | protein_coding | TCGA-AA-3492-01 | Colorectum | colon adenocarcinoma | Female | >=65 | I/II | Unknown | Unknown | SD | |||
| GSR | SNV | Missense_Mutation | c.688T>G | p.Leu230Val | p.L230V | P00390 | protein_coding | tolerated(0.18) | possibly_damaging(0.703) | TCGA-A5-A1OF-01 | Endometrium | uterine corpus endometrioid carcinoma | Female | <65 | I/II | Unknown | Unknown | SD |
| Page: 1 2 3 4 5 |
Top |
Related drugs of malignant transformation related genes |
| Identification of chemicals and drugs interact with genes involved in malignant transfromation |
| (DGIdb 4.0) |
| Entrez ID | Symbol | Category | Interaction Types | Drug Claim Name | Drug Name | PMIDs |
| 2936 | GSR | EXTERNAL SIDE OF PLASMA MEMBRANE, DRUGGABLE GENOME, ENZYME | THYROXINE | THYROXINE | 11059392 | |
| 2936 | GSR | EXTERNAL SIDE OF PLASMA MEMBRANE, DRUGGABLE GENOME, ENZYME | VITAMIN E | 2035236 | ||
| 2936 | GSR | EXTERNAL SIDE OF PLASMA MEMBRANE, DRUGGABLE GENOME, ENZYME | MUSTARD | 15102853 | ||
| 2936 | GSR | EXTERNAL SIDE OF PLASMA MEMBRANE, DRUGGABLE GENOME, ENZYME | L-alanyl-l-glutamine | ALANYL GLUTAMINE | ||
| 2936 | GSR | EXTERNAL SIDE OF PLASMA MEMBRANE, DRUGGABLE GENOME, ENZYME | taxanes | 26194361 | ||
| 2936 | GSR | EXTERNAL SIDE OF PLASMA MEMBRANE, DRUGGABLE GENOME, ENZYME | ENALAPRIL | ENALAPRIL | 10712274 | |
| 2936 | GSR | EXTERNAL SIDE OF PLASMA MEMBRANE, DRUGGABLE GENOME, ENZYME | SELENIUM | 2035236 | ||
| 2936 | GSR | EXTERNAL SIDE OF PLASMA MEMBRANE, DRUGGABLE GENOME, ENZYME | QUERCETIN | QUERCETIN | 1478066 | |
| 2936 | GSR | EXTERNAL SIDE OF PLASMA MEMBRANE, DRUGGABLE GENOME, ENZYME | carboplatin | CARBOPLATIN | 26194361 | |
| 2936 | GSR | EXTERNAL SIDE OF PLASMA MEMBRANE, DRUGGABLE GENOME, ENZYME | OFLOXACIN | OFLOXACIN | 15008519 |
| Page: 1 2 3 |

Copyright 2023-Present -The University of Texas Health Science Center at Houston |