
|
|||||
|
 | |
| |
| |
| |
| |
| |
|
Gene: GSKIP |
Gene summary for GSKIP |
| Gene information | Species | Human | Gene symbol | GSKIP | Gene ID | 51527 |
| Gene name | GSK3B interacting protein | |
| Gene Alias | C14orf129 | |
| Cytomap | 14q32.2 | |
| Gene Type | protein-coding | GO ID | GO:0001932 | UniProtAcc | A0A024R6P6 |
Top |
Malignant transformation analysis |
| Identification of the aberrant gene expression in precancerous and cancerous lesions by comparing the gene expression of stem-like cells in diseased tissues with normal stem cells |
| Entrez ID | Symbol | Replicates | Species | Organ | Tissue | Adj P-value | Log2FC | Malignancy |
| 51527 | GSKIP | LZE4T | Human | Esophagus | ESCC | 1.13e-10 | 1.46e-01 | 0.0811 |
| 51527 | GSKIP | LZE5T | Human | Esophagus | ESCC | 1.13e-03 | 1.08e-01 | 0.0514 |
| 51527 | GSKIP | LZE8T | Human | Esophagus | ESCC | 3.37e-03 | 5.68e-02 | 0.067 |
| 51527 | GSKIP | LZE20T | Human | Esophagus | ESCC | 4.84e-06 | 1.38e-01 | 0.0662 |
| 51527 | GSKIP | LZE22T | Human | Esophagus | ESCC | 3.87e-03 | 3.22e-01 | 0.068 |
| 51527 | GSKIP | LZE24T | Human | Esophagus | ESCC | 5.00e-14 | 4.28e-01 | 0.0596 |
| 51527 | GSKIP | LZE6T | Human | Esophagus | ESCC | 3.55e-02 | 2.82e-02 | 0.0845 |
| 51527 | GSKIP | P2T-E | Human | Esophagus | ESCC | 2.30e-16 | 1.86e-01 | 0.1177 |
| 51527 | GSKIP | P4T-E | Human | Esophagus | ESCC | 1.77e-23 | 4.46e-01 | 0.1323 |
| 51527 | GSKIP | P5T-E | Human | Esophagus | ESCC | 8.81e-12 | 1.64e-01 | 0.1327 |
| 51527 | GSKIP | P8T-E | Human | Esophagus | ESCC | 5.51e-18 | 2.72e-01 | 0.0889 |
| 51527 | GSKIP | P9T-E | Human | Esophagus | ESCC | 1.53e-09 | 5.82e-02 | 0.1131 |
| 51527 | GSKIP | P10T-E | Human | Esophagus | ESCC | 5.93e-10 | 2.66e-01 | 0.116 |
| 51527 | GSKIP | P11T-E | Human | Esophagus | ESCC | 1.74e-09 | 3.95e-01 | 0.1426 |
| 51527 | GSKIP | P12T-E | Human | Esophagus | ESCC | 1.35e-20 | 4.49e-01 | 0.1122 |
| 51527 | GSKIP | P15T-E | Human | Esophagus | ESCC | 5.16e-17 | 3.82e-01 | 0.1149 |
| 51527 | GSKIP | P16T-E | Human | Esophagus | ESCC | 2.96e-17 | 1.59e-01 | 0.1153 |
| 51527 | GSKIP | P17T-E | Human | Esophagus | ESCC | 3.38e-03 | 2.00e-01 | 0.1278 |
| 51527 | GSKIP | P19T-E | Human | Esophagus | ESCC | 2.43e-05 | 3.75e-01 | 0.1662 |
| 51527 | GSKIP | P20T-E | Human | Esophagus | ESCC | 2.80e-07 | 1.87e-01 | 0.1124 |
| Page: 1 2 3 4 5 |
| Tissue | Expression Dynamics | Abbreviation |
| Esophagus | 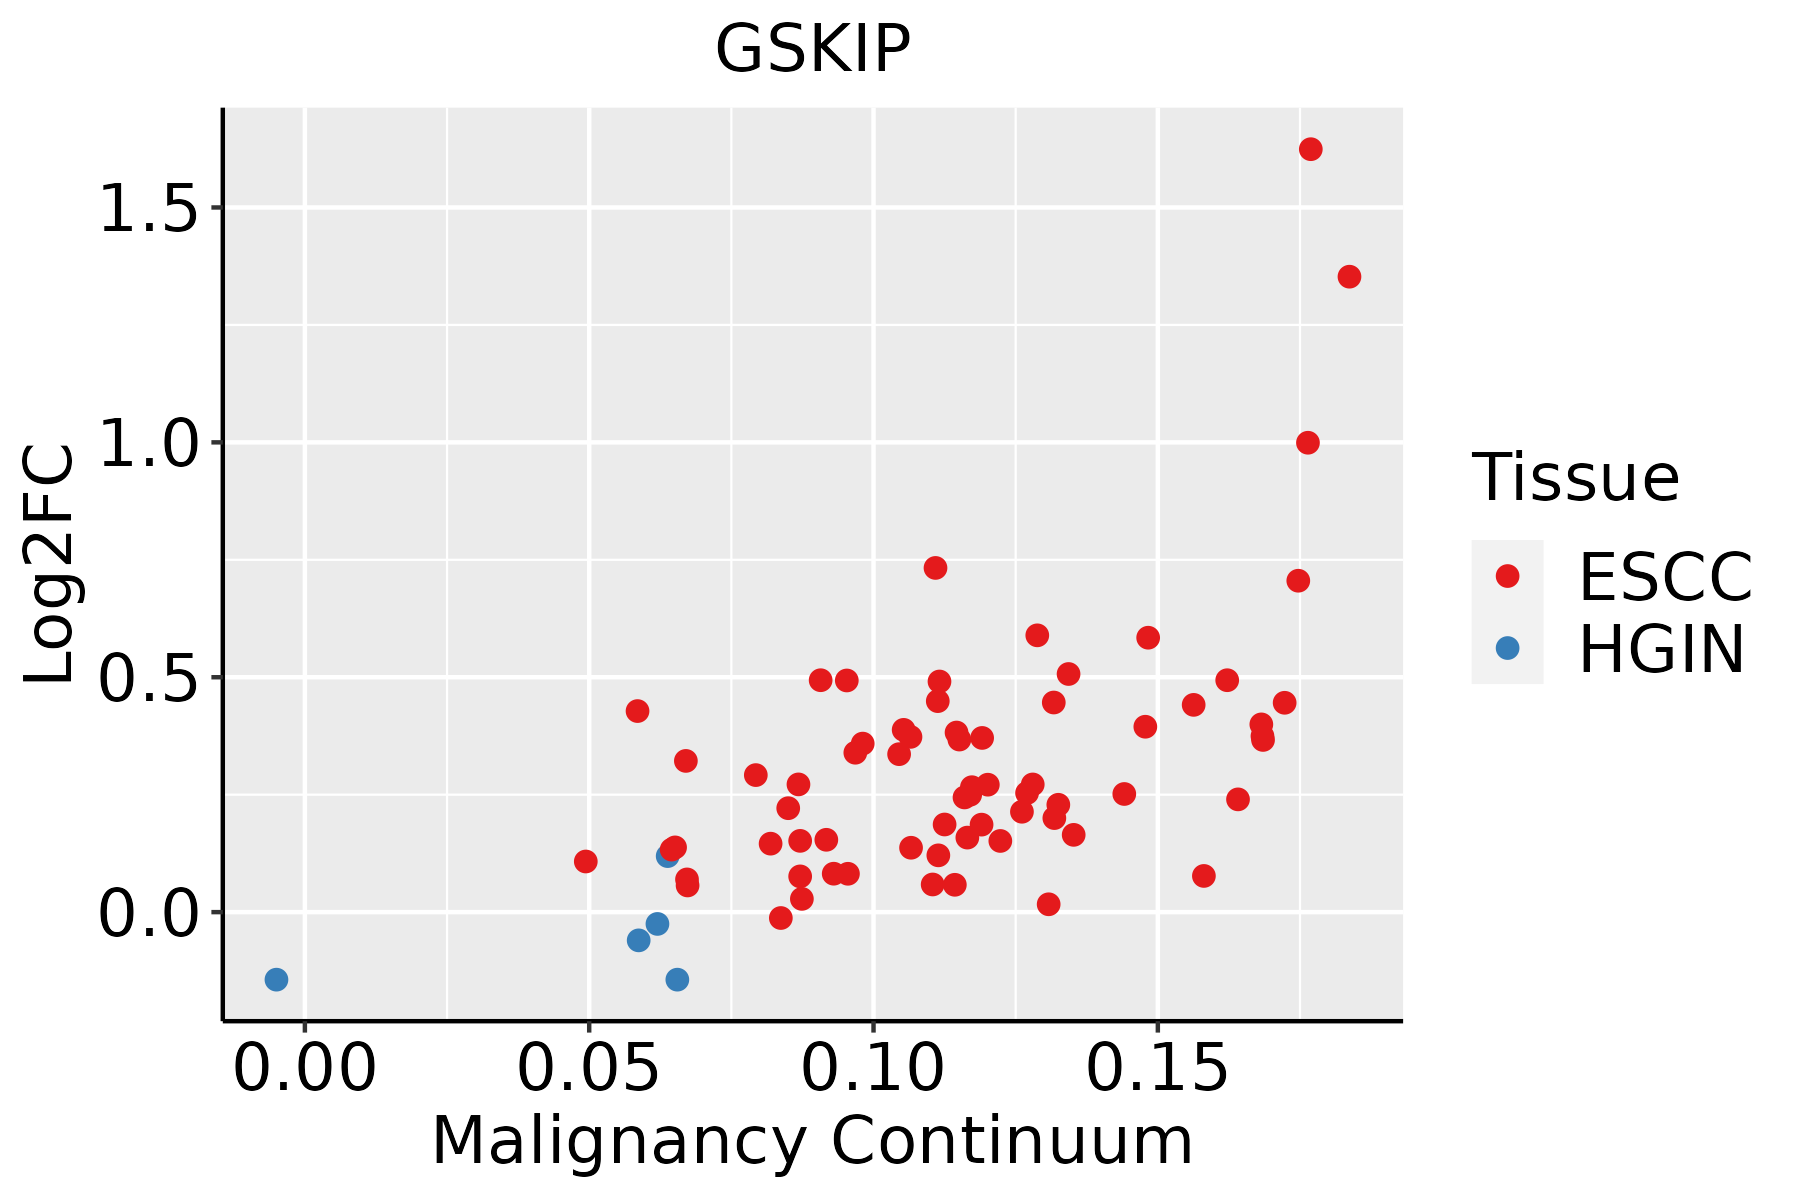 | ESCC: Esophageal squamous cell carcinoma |
| HGIN: High-grade intraepithelial neoplasias | ||
| LGIN: Low-grade intraepithelial neoplasias | ||
| Oral Cavity | 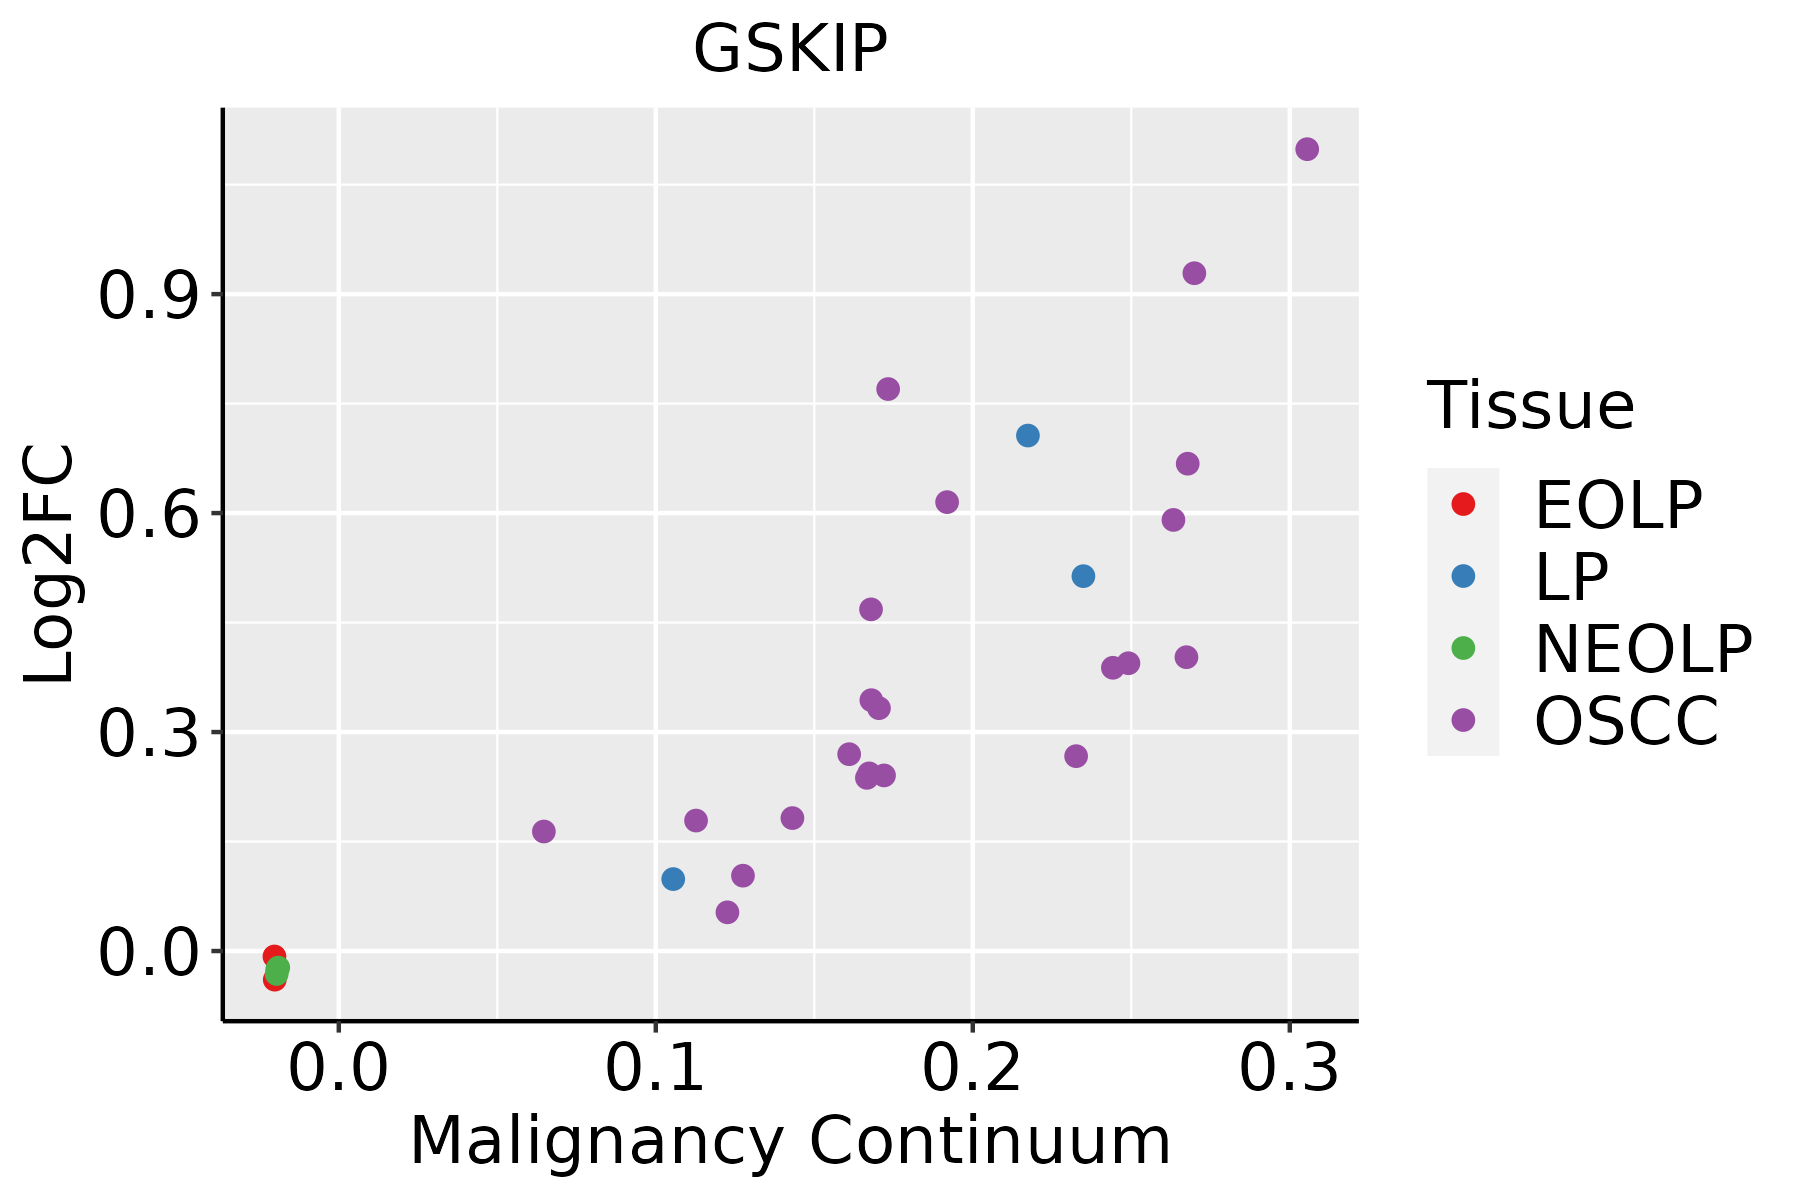 | EOLP: Erosive Oral lichen planus |
| LP: leukoplakia | ||
| NEOLP: Non-erosive oral lichen planus | ||
| OSCC: Oral squamous cell carcinoma | ||
| Skin | 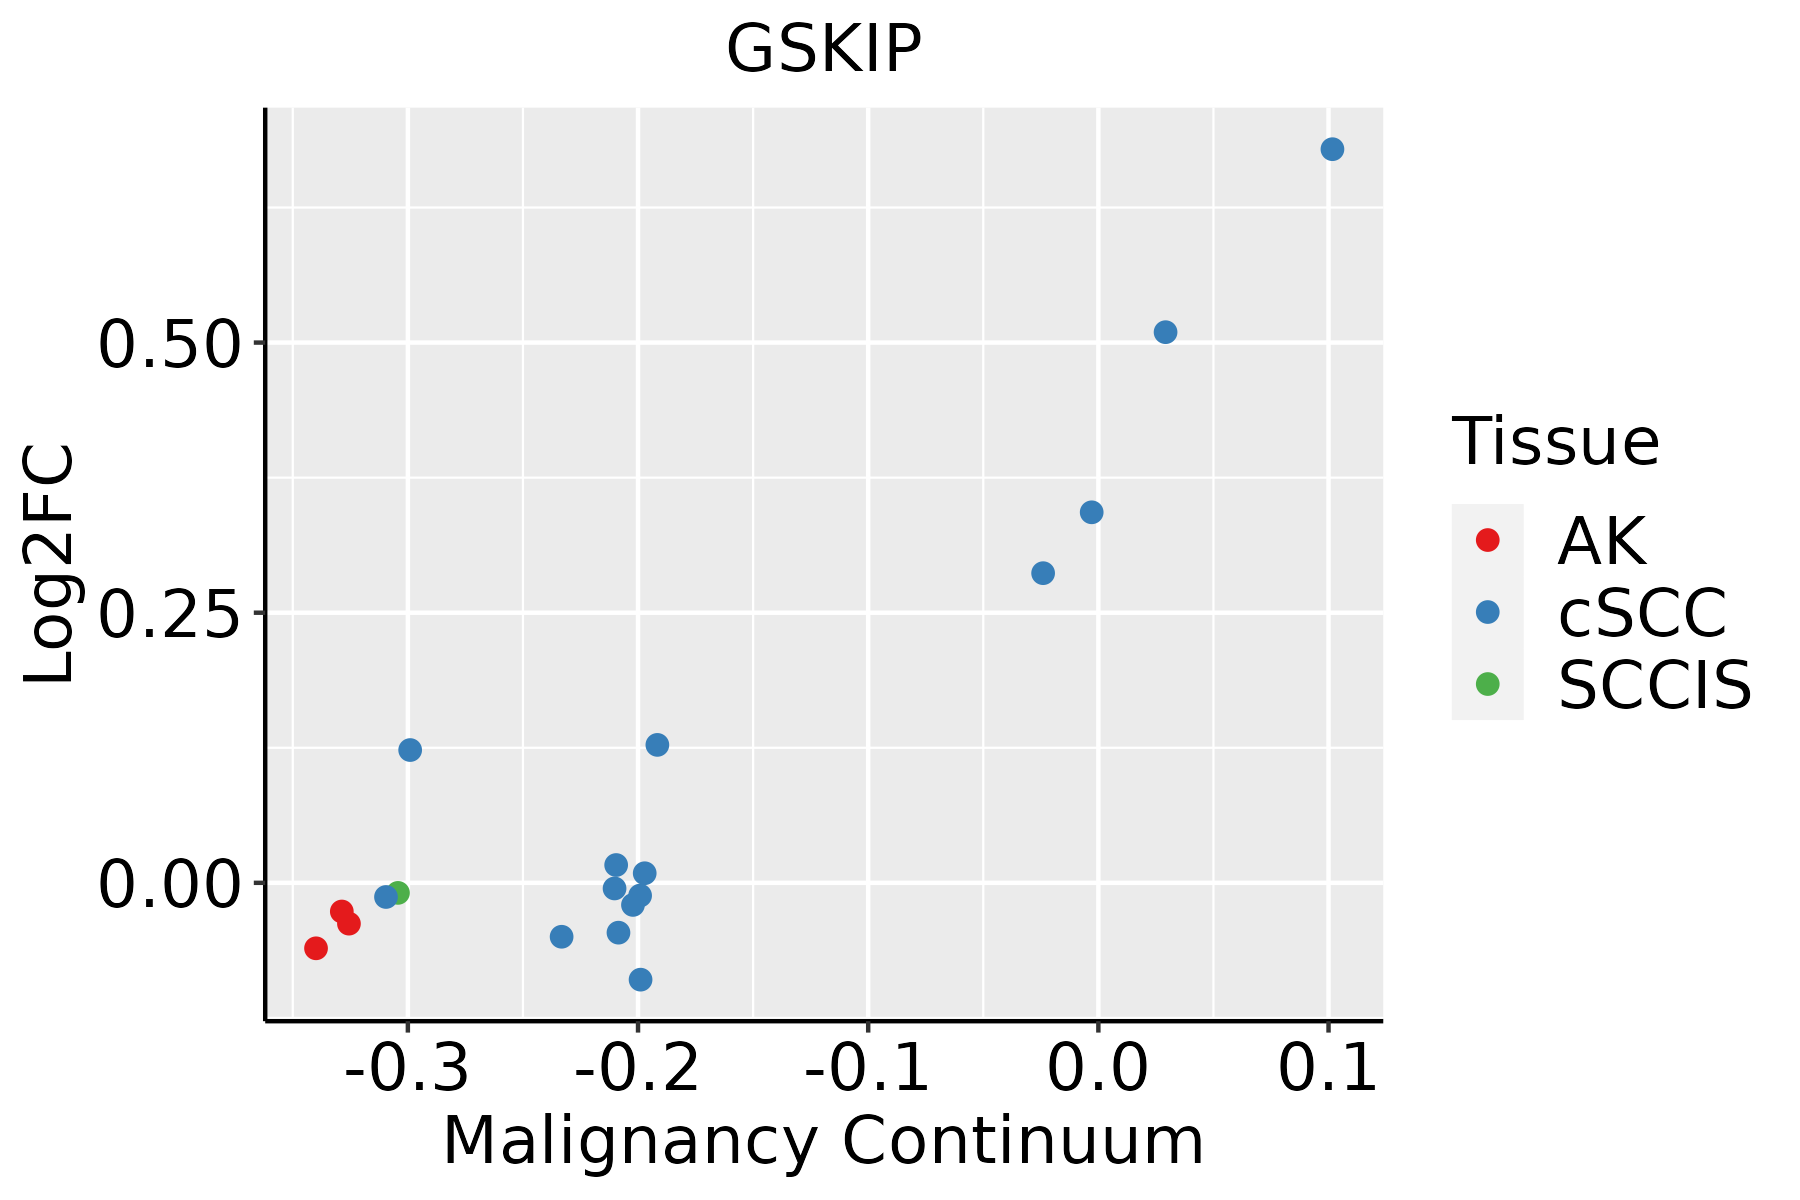 | AK: Actinic keratosis |
| cSCC: Cutaneous squamous cell carcinoma | ||
| SCCIS:squamous cell carcinoma in situ |
| ∗log2FC in expression of this searched gene in stem-like cells from each diseased tissue sample relative to stem-like cells in normal samples in each tissue plotted against the malignancy continuum. Samples are colored based on if they are from different disease stage. |
Top |
Malignant transformation related pathway analysis |
| Find out the enriched GO biological processes and KEGG pathways involved in transition from healthy to precancer to cancer |
| Tissue | Disease Stage | Enriched GO biological Processes |
| Colorectum | AD |  |
| Colorectum | SER |  |
| Colorectum | MSS |  |
| Colorectum | MSI-H |  |
| Colorectum | FAP |  |
| ∗Top 15 enriched GO BP terms are showed in the bar plot of each disease state in each tissue. Each row represents a significant GO biological process which is colored according to the -log10(p.adjust). |
| Page: 1 2 3 4 5 6 7 8 9 |
| GO ID | Tissue | Disease Stage | Description | Gene Ratio | Bg Ratio | pvalue | p.adjust | Count |
| GO:0097193111 | Esophagus | ESCC | intrinsic apoptotic signaling pathway | 222/8552 | 288/18723 | 5.87e-28 | 2.02e-25 | 222 |
| GO:0006979111 | Esophagus | ESCC | response to oxidative stress | 303/8552 | 446/18723 | 7.15e-22 | 1.30e-19 | 303 |
| GO:0062197111 | Esophagus | ESCC | cellular response to chemical stress | 234/8552 | 337/18723 | 5.37e-19 | 5.97e-17 | 234 |
| GO:0034599111 | Esophagus | ESCC | cellular response to oxidative stress | 197/8552 | 288/18723 | 3.76e-15 | 2.15e-13 | 197 |
| GO:0010563111 | Esophagus | ESCC | negative regulation of phosphorus metabolic process | 274/8552 | 442/18723 | 2.32e-12 | 9.41e-11 | 274 |
| GO:0045936111 | Esophagus | ESCC | negative regulation of phosphate metabolic process | 273/8552 | 441/18723 | 3.18e-12 | 1.25e-10 | 273 |
| GO:0051348111 | Esophagus | ESCC | negative regulation of transferase activity | 177/8552 | 268/18723 | 1.08e-11 | 4.00e-10 | 177 |
| GO:0042326111 | Esophagus | ESCC | negative regulation of phosphorylation | 237/8552 | 385/18723 | 1.86e-10 | 5.33e-09 | 237 |
| GO:001605517 | Esophagus | ESCC | Wnt signaling pathway | 268/8552 | 444/18723 | 2.32e-10 | 6.58e-09 | 268 |
| GO:019873817 | Esophagus | ESCC | cell-cell signaling by wnt | 269/8552 | 446/18723 | 2.41e-10 | 6.79e-09 | 269 |
| GO:0001933111 | Esophagus | ESCC | negative regulation of protein phosphorylation | 213/8552 | 342/18723 | 3.54e-10 | 9.76e-09 | 213 |
| GO:003367319 | Esophagus | ESCC | negative regulation of kinase activity | 154/8552 | 237/18723 | 1.38e-09 | 3.27e-08 | 154 |
| GO:000646920 | Esophagus | ESCC | negative regulation of protein kinase activity | 140/8552 | 212/18723 | 1.53e-09 | 3.56e-08 | 140 |
| GO:0008631110 | Esophagus | ESCC | intrinsic apoptotic signaling pathway in response to oxidative stress | 38/8552 | 45/18723 | 8.42e-08 | 1.43e-06 | 38 |
| GO:003011117 | Esophagus | ESCC | regulation of Wnt signaling pathway | 194/8552 | 328/18723 | 5.39e-07 | 7.14e-06 | 194 |
| GO:006007016 | Esophagus | ESCC | canonical Wnt signaling pathway | 180/8552 | 303/18723 | 9.15e-07 | 1.17e-05 | 180 |
| GO:006082817 | Esophagus | ESCC | regulation of canonical Wnt signaling pathway | 153/8552 | 253/18723 | 1.38e-06 | 1.67e-05 | 153 |
| GO:009026316 | Esophagus | ESCC | positive regulation of canonical Wnt signaling pathway | 69/8552 | 106/18723 | 4.22e-05 | 3.39e-04 | 69 |
| GO:003017716 | Esophagus | ESCC | positive regulation of Wnt signaling pathway | 87/8552 | 140/18723 | 6.18e-05 | 4.73e-04 | 87 |
| GO:003647320 | Esophagus | ESCC | cell death in response to oxidative stress | 59/8552 | 95/18723 | 9.12e-04 | 4.65e-03 | 59 |
| Page: 1 2 3 |
| Pathway ID | Tissue | Disease Stage | Description | Gene Ratio | Bg Ratio | pvalue | p.adjust | qvalue | Count |
| Page: 1 |
Top |
Cell-cell communication analysis |
| Identification of potential cell-cell interactions between two cell types and their ligand-receptor pairs for different disease states |
| Ligand | Receptor | LRpair | Pathway | Tissue | Disease Stage |
| Page: 1 |
Top |
Single-cell gene regulatory network inference analysis |
| Find out the significant the regulons (TFs) and the target genes of each regulon across cell types for different disease states |
| TF | Cell Type | Tissue | Disease Stage | Target Gene | RSS | Regulon Activity |
| ∗The dot plots of a searched regulon are shown for all cell subpopulations in each disease state of each tissue based on the regulon specific score inferred using pySCENIC and by calculating the average expression. |
| Page: 1 |
Top |
Somatic mutation of malignant transformation related genes |
| Annotation of somatic variants for genes involved in malignant transformation |
| Hugo Symbol | Variant Class | Variant Classification | dbSNP RS | HGVSc | HGVSp | HGVSp Short | SWISSPROT | BIOTYPE | SIFT | PolyPhen | Tumor Sample Barcode | Tissue | Histology | Sex | Age | Stage | Therapy Types | Drugs | Outcome |
| GSKIP | SNV | Missense_Mutation | c.295T>A | p.Leu99Ile | p.L99I | Q9P0R6 | protein_coding | tolerated(0.2) | benign(0.015) | TCGA-D8-A1XB-01 | Breast | breast invasive carcinoma | Female | <65 | I/II | Unknown | Unknown | SD | |
| GSKIP | SNV | Missense_Mutation | novel | c.289G>T | p.Asp97Tyr | p.D97Y | Q9P0R6 | protein_coding | deleterious(0.01) | possibly_damaging(0.778) | TCGA-AG-A002-01 | Colorectum | rectum adenocarcinoma | Male | <65 | I/II | Unknown | Unknown | SD |
| GSKIP | SNV | Missense_Mutation | novel | c.40T>C | p.Ser14Pro | p.S14P | Q9P0R6 | protein_coding | tolerated_low_confidence(0.13) | benign(0.133) | TCGA-A5-A0G2-01 | Endometrium | uterine corpus endometrioid carcinoma | Female | <65 | III/IV | Unknown | Unknown | SD |
| GSKIP | SNV | Missense_Mutation | novel | c.124N>C | p.Asn42His | p.N42H | Q9P0R6 | protein_coding | tolerated(0.12) | probably_damaging(0.917) | TCGA-AJ-A3EL-01 | Endometrium | uterine corpus endometrioid carcinoma | Female | <65 | I/II | Unknown | Unknown | SD |
| GSKIP | SNV | Missense_Mutation | novel | c.157N>A | p.Val53Ile | p.V53I | Q9P0R6 | protein_coding | tolerated(0.29) | benign(0.007) | TCGA-AX-A06F-01 | Endometrium | uterine corpus endometrioid carcinoma | Female | <65 | III/IV | Chemotherapy | carboplatin | SD |
| GSKIP | SNV | Missense_Mutation | novel | c.379C>A | p.Leu127Ile | p.L127I | Q9P0R6 | protein_coding | tolerated(0.22) | probably_damaging(0.995) | TCGA-AX-A0J1-01 | Endometrium | uterine corpus endometrioid carcinoma | Female | >=65 | I/II | Unknown | Unknown | SD |
| GSKIP | SNV | Missense_Mutation | rs755565686 | c.179C>T | p.Ala60Val | p.A60V | Q9P0R6 | protein_coding | tolerated(0.11) | benign(0.191) | TCGA-AX-A1CE-01 | Endometrium | uterine corpus endometrioid carcinoma | Female | <65 | I/II | Unspecific | Paclitaxel | SD |
| GSKIP | SNV | Missense_Mutation | c.59N>T | p.Ser20Leu | p.S20L | Q9P0R6 | protein_coding | tolerated_low_confidence(0.11) | benign(0.015) | TCGA-91-6830-01 | Lung | lung adenocarcinoma | Female | >=65 | I/II | Unknown | Unknown | PD | |
| GSKIP | SNV | Missense_Mutation | rs755731284 | c.247G>C | p.Ala83Pro | p.A83P | Q9P0R6 | protein_coding | tolerated(0.06) | possibly_damaging(0.843) | TCGA-56-7223-01 | Lung | lung squamous cell carcinoma | Male | >=65 | III/IV | Unknown | Unknown | PD |
| GSKIP | SNV | Missense_Mutation | novel | c.266G>A | p.Gly89Asp | p.G89D | Q9P0R6 | protein_coding | deleterious(0.02) | probably_damaging(0.93) | TCGA-CV-A6K1-01 | Oral cavity | head & neck squamous cell carcinoma | Male | >=65 | I/II | Unknown | Unknown | PD |
| Page: 1 2 |
Top |
Related drugs of malignant transformation related genes |
| Identification of chemicals and drugs interact with genes involved in malignant transfromation |
| (DGIdb 4.0) |
| Entrez ID | Symbol | Category | Interaction Types | Drug Claim Name | Drug Name | PMIDs |
| Page: 1 |

Copyright 2023-Present -The University of Texas Health Science Center at Houston |