
|
|||||
|
 | |
| |
| |
| |
| |
| |
|
Gene: GSDMD |
Gene summary for GSDMD |
| Gene information | Species | Human | Gene symbol | GSDMD | Gene ID | 79792 |
| Gene name | gasdermin D | |
| Gene Alias | DF5L | |
| Cytomap | 8q24.3 | |
| Gene Type | protein-coding | GO ID | GO:0001816 | UniProtAcc | P57764 |
Top |
Malignant transformation analysis |
| Identification of the aberrant gene expression in precancerous and cancerous lesions by comparing the gene expression of stem-like cells in diseased tissues with normal stem cells |
| Entrez ID | Symbol | Replicates | Species | Organ | Tissue | Adj P-value | Log2FC | Malignancy |
| 79792 | GSDMD | GSM4909308 | Human | Breast | IDC | 1.04e-03 | 2.36e-01 | 0.158 |
| 79792 | GSDMD | GSM4909311 | Human | Breast | IDC | 2.63e-05 | 5.50e-02 | 0.1534 |
| 79792 | GSDMD | GSM4909317 | Human | Breast | IDC | 8.29e-20 | 5.47e-01 | 0.1355 |
| 79792 | GSDMD | GSM4909318 | Human | Breast | IDC | 4.01e-03 | 4.79e-01 | 0.2031 |
| 79792 | GSDMD | GSM4909319 | Human | Breast | IDC | 7.23e-15 | 1.74e-01 | 0.1563 |
| 79792 | GSDMD | GSM4909321 | Human | Breast | IDC | 3.62e-07 | 3.06e-01 | 0.1559 |
| 79792 | GSDMD | brca2 | Human | Breast | Precancer | 2.23e-04 | 2.12e-01 | -0.024 |
| 79792 | GSDMD | brca3 | Human | Breast | Precancer | 9.87e-05 | 2.46e-01 | -0.0263 |
| 79792 | GSDMD | M1 | Human | Breast | IDC | 1.77e-03 | 2.86e-01 | 0.1577 |
| 79792 | GSDMD | P1 | Human | Breast | IDC | 1.47e-04 | 4.99e-02 | 0.1527 |
| 79792 | GSDMD | P2 | Human | Breast | IDC | 5.11e-05 | 3.67e-01 | 0.21 |
| 79792 | GSDMD | DCIS2 | Human | Breast | DCIS | 2.70e-45 | 1.68e-01 | 0.0085 |
| 79792 | GSDMD | HTA11_2487_2000001011 | Human | Colorectum | SER | 5.20e-12 | 4.71e-01 | -0.1808 |
| 79792 | GSDMD | HTA11_1938_2000001011 | Human | Colorectum | AD | 2.35e-15 | 4.70e-01 | -0.0811 |
| 79792 | GSDMD | HTA11_78_2000001011 | Human | Colorectum | AD | 3.85e-12 | 4.20e-01 | -0.1088 |
| 79792 | GSDMD | HTA11_347_2000001011 | Human | Colorectum | AD | 6.65e-11 | 3.81e-01 | -0.1954 |
| 79792 | GSDMD | HTA11_2112_2000001011 | Human | Colorectum | SER | 5.93e-05 | 6.91e-01 | -0.2196 |
| 79792 | GSDMD | HTA11_83_2000001011 | Human | Colorectum | SER | 3.99e-03 | 3.24e-01 | -0.1526 |
| 79792 | GSDMD | HTA11_696_2000001011 | Human | Colorectum | AD | 1.57e-13 | 5.06e-01 | -0.1464 |
| 79792 | GSDMD | HTA11_866_2000001011 | Human | Colorectum | AD | 1.55e-04 | 2.10e-01 | -0.1001 |
| Page: 1 2 3 4 5 6 7 8 |
| Tissue | Expression Dynamics | Abbreviation |
| Breast | 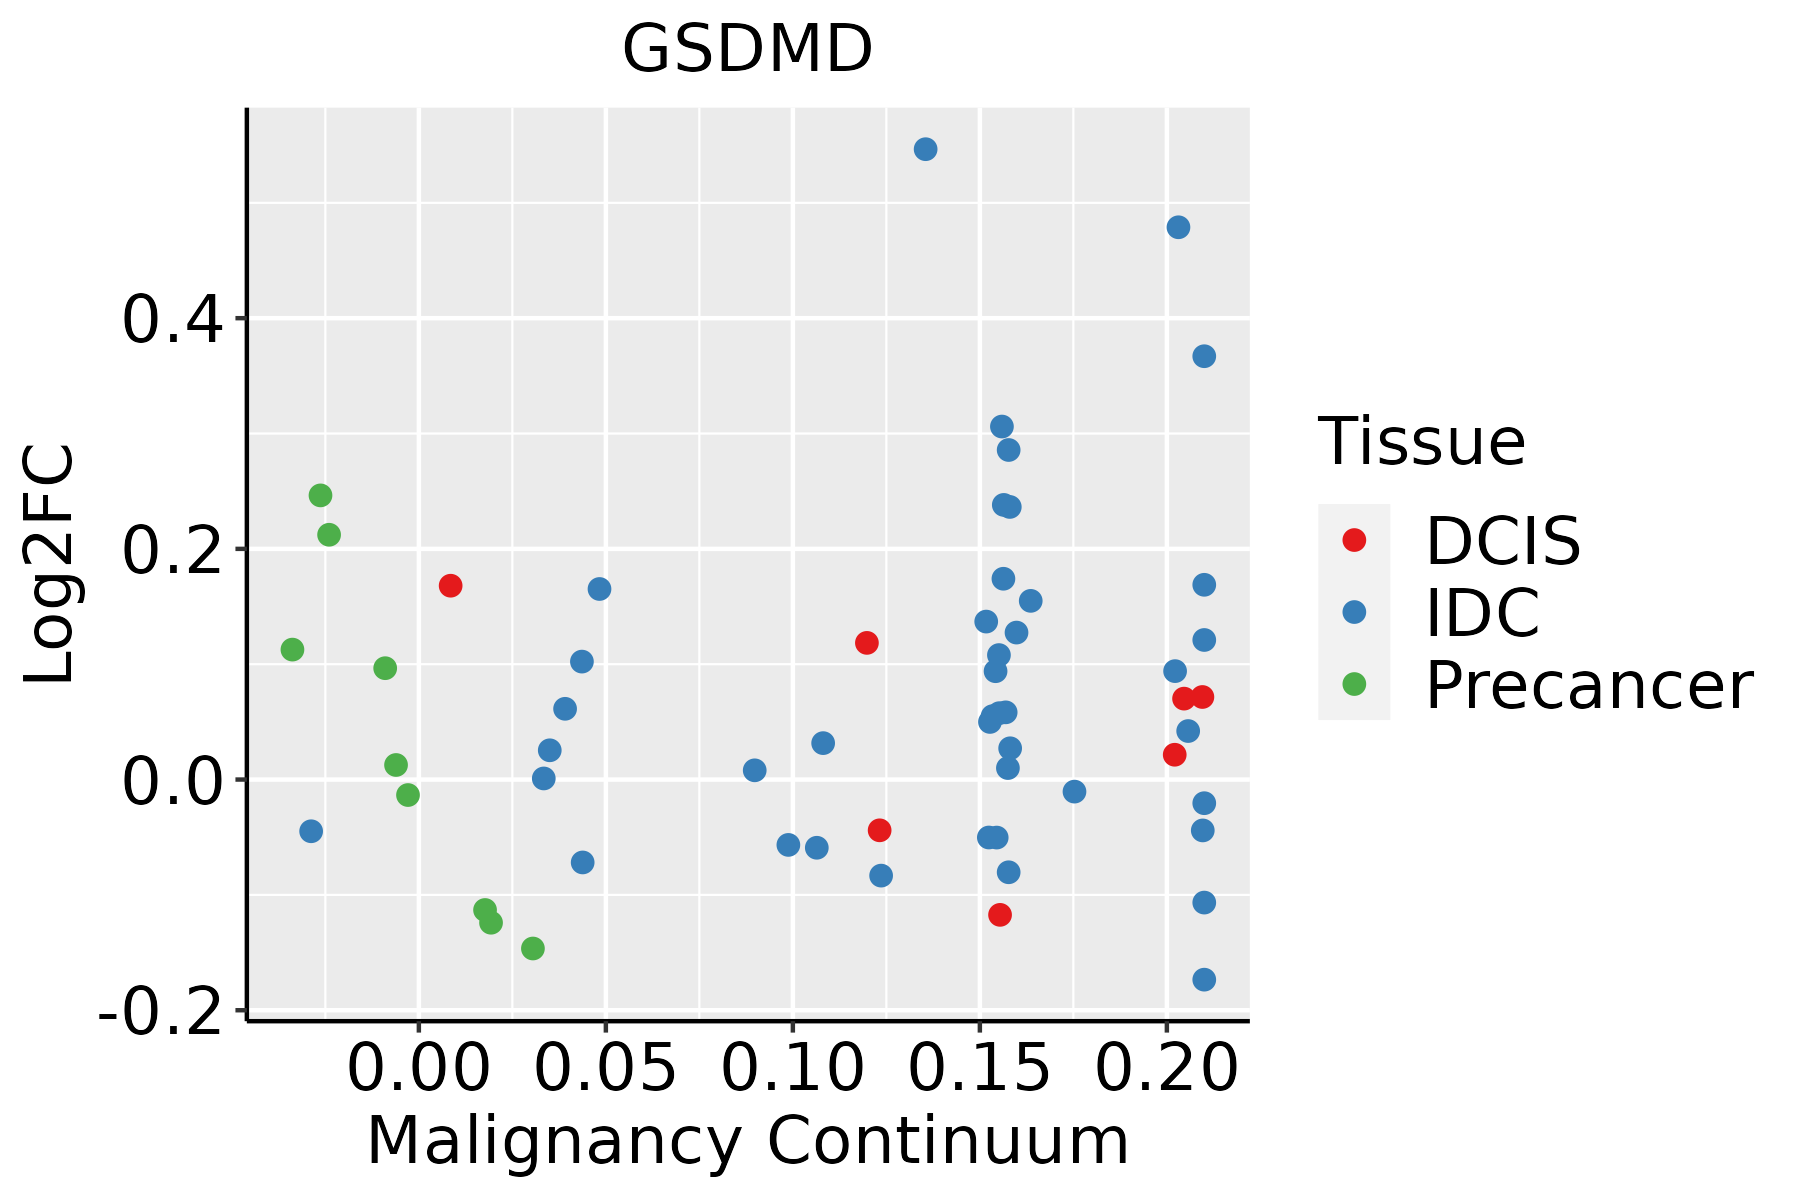 | IDC: Invasive ductal carcinoma |
| DCIS: Ductal carcinoma in situ | ||
| Precancer(BRCA1-mut): Precancerous lesion from BRCA1 mutation carriers | ||
| Colorectum (GSE201348) |  | FAP: Familial adenomatous polyposis |
| CRC: Colorectal cancer | ||
| Colorectum (HTA11) |  | AD: Adenomas |
| SER: Sessile serrated lesions | ||
| MSI-H: Microsatellite-high colorectal cancer | ||
| MSS: Microsatellite stable colorectal cancer | ||
| Esophagus | 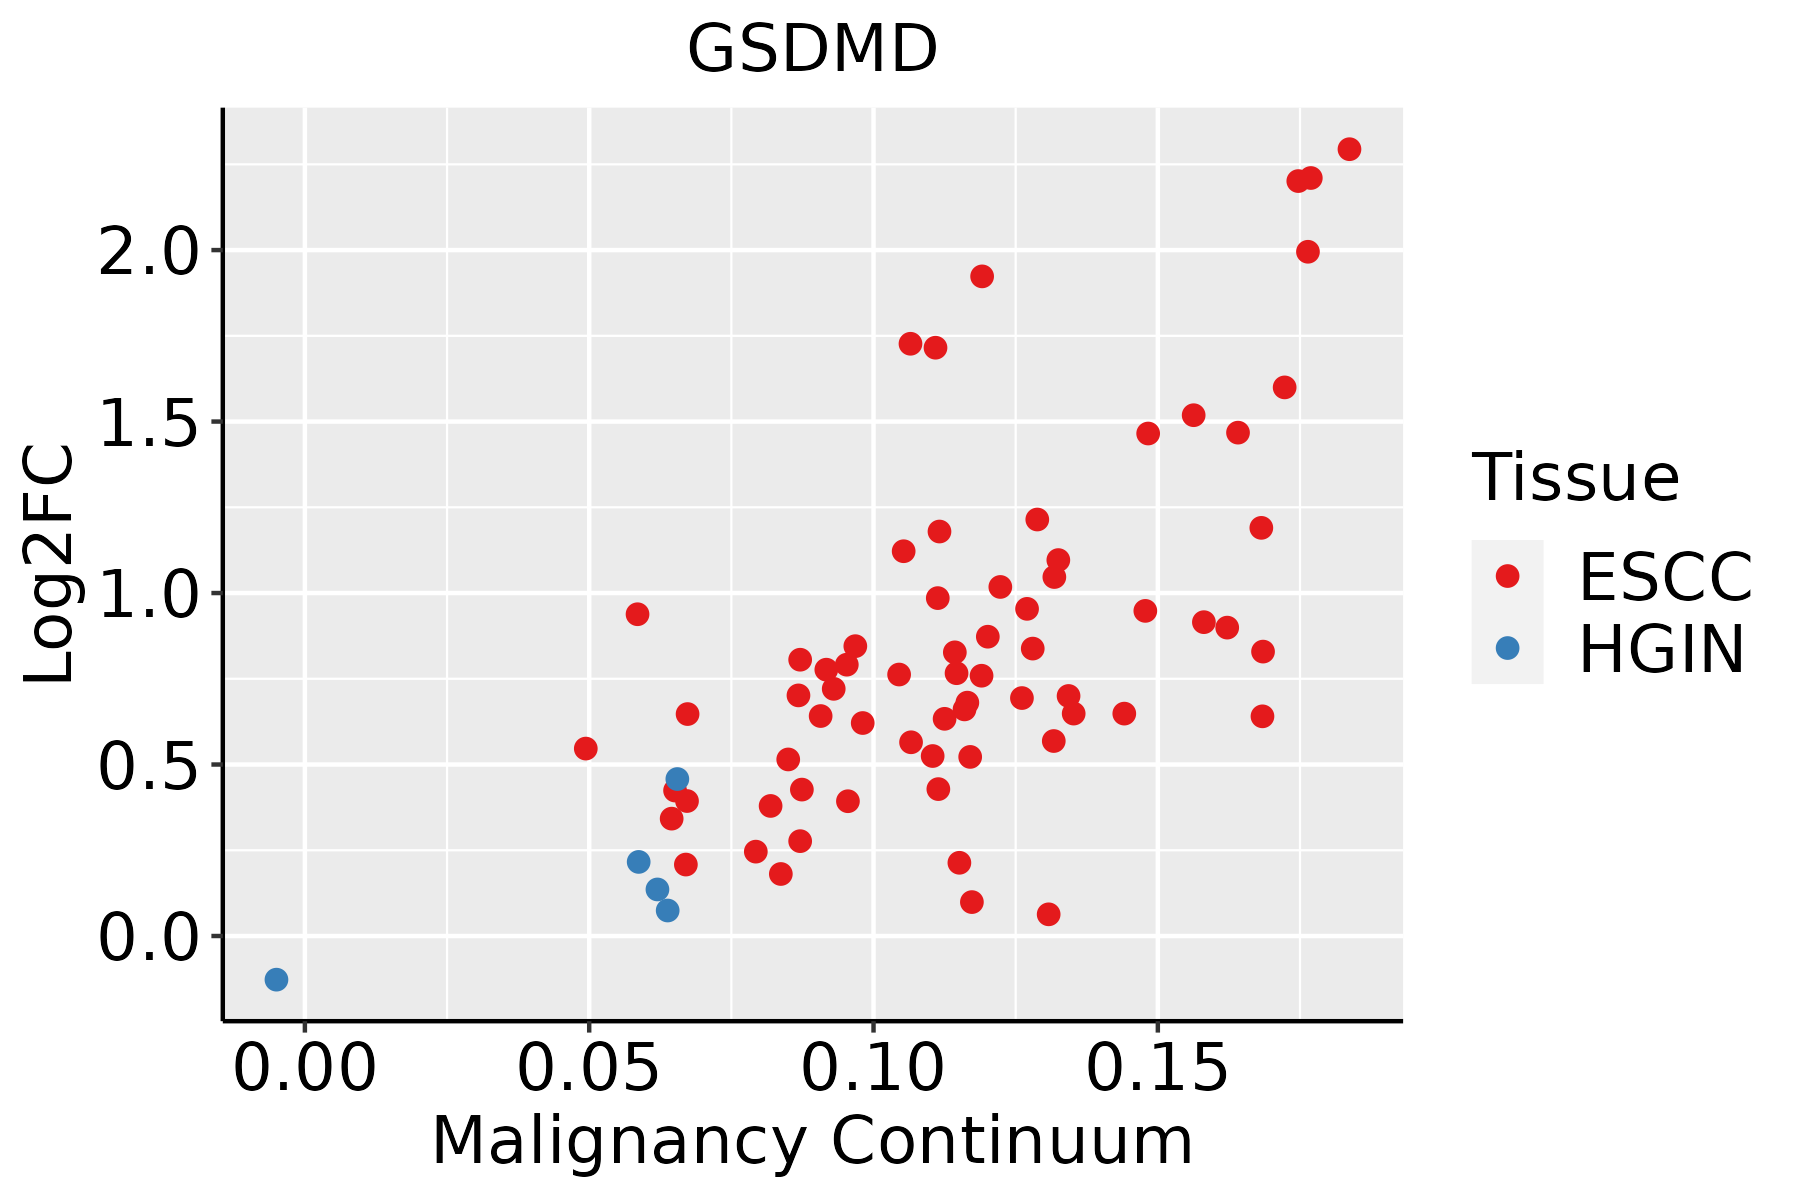 | ESCC: Esophageal squamous cell carcinoma |
| HGIN: High-grade intraepithelial neoplasias | ||
| LGIN: Low-grade intraepithelial neoplasias | ||
| Liver | 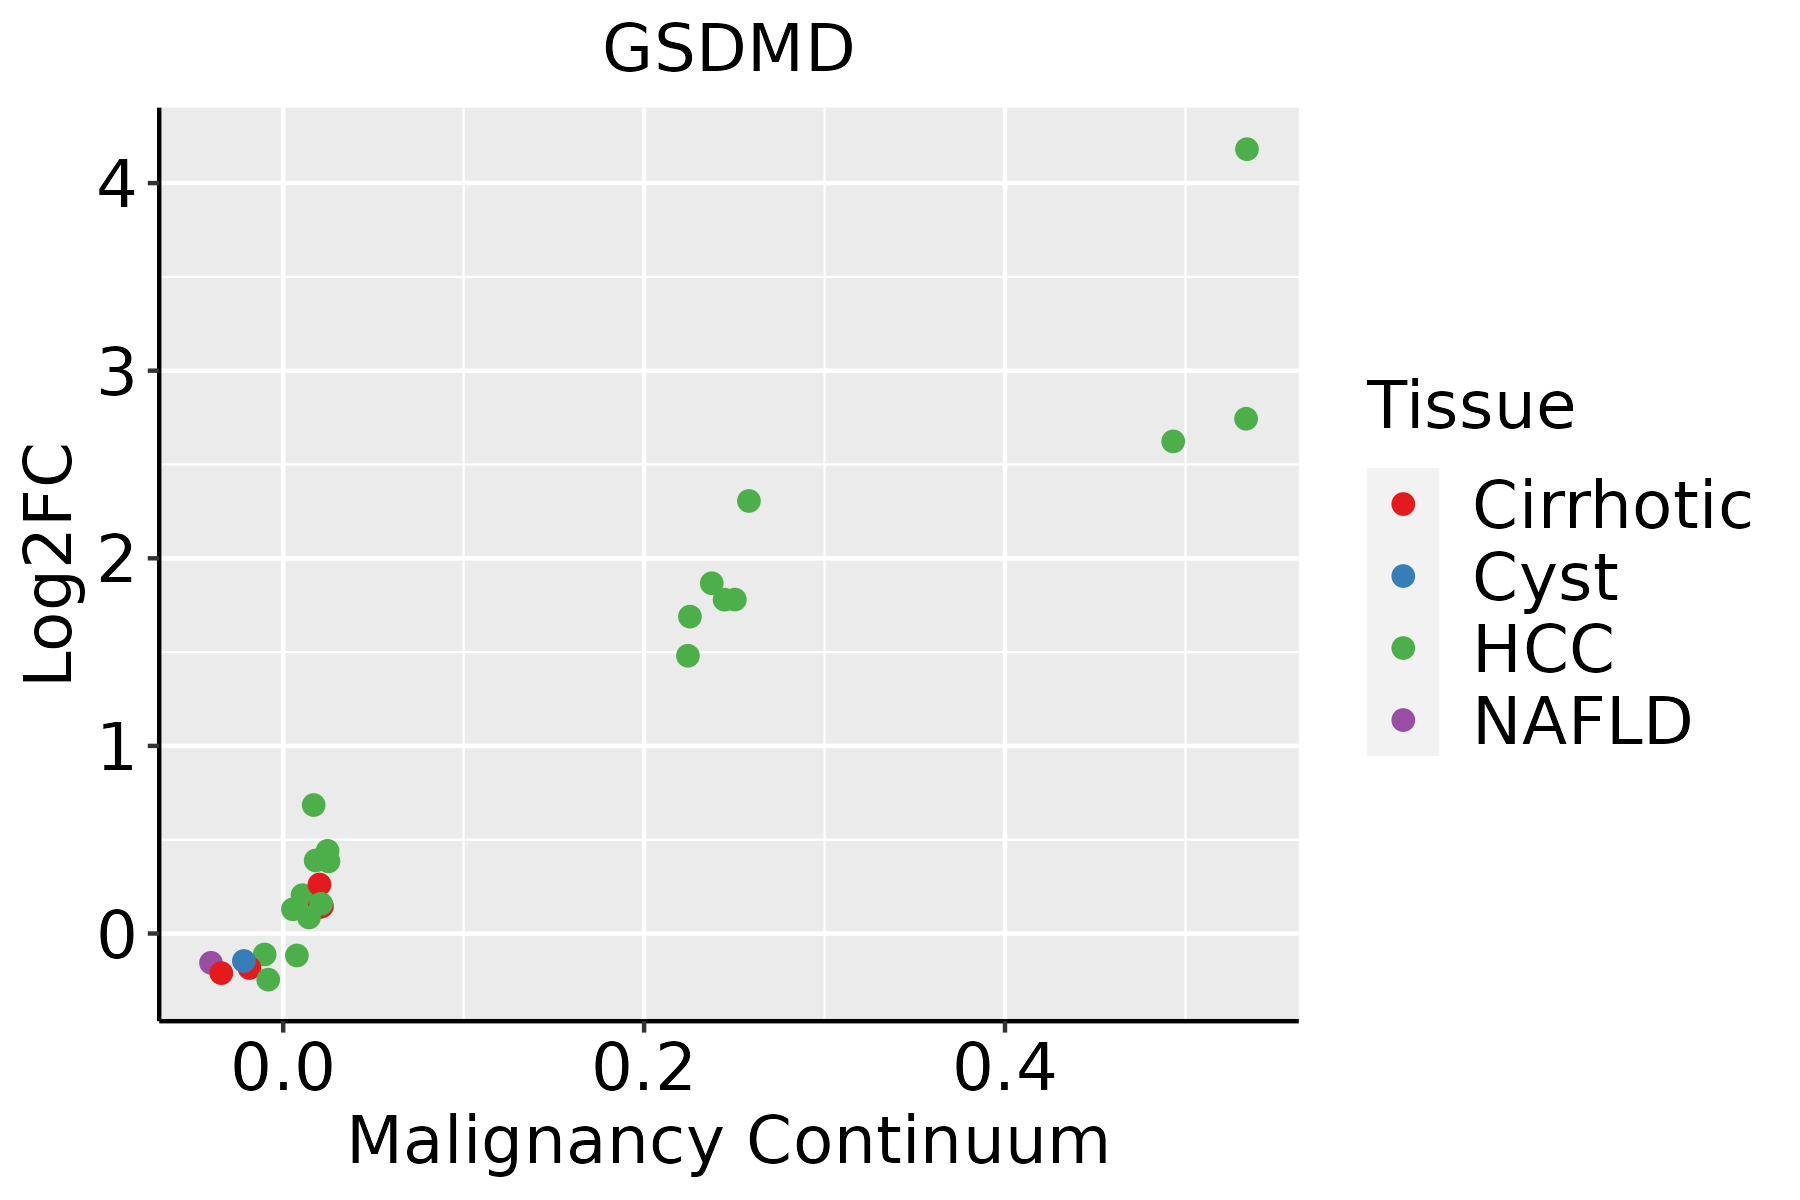 | HCC: Hepatocellular carcinoma |
| NAFLD: Non-alcoholic fatty liver disease | ||
| Oral Cavity | 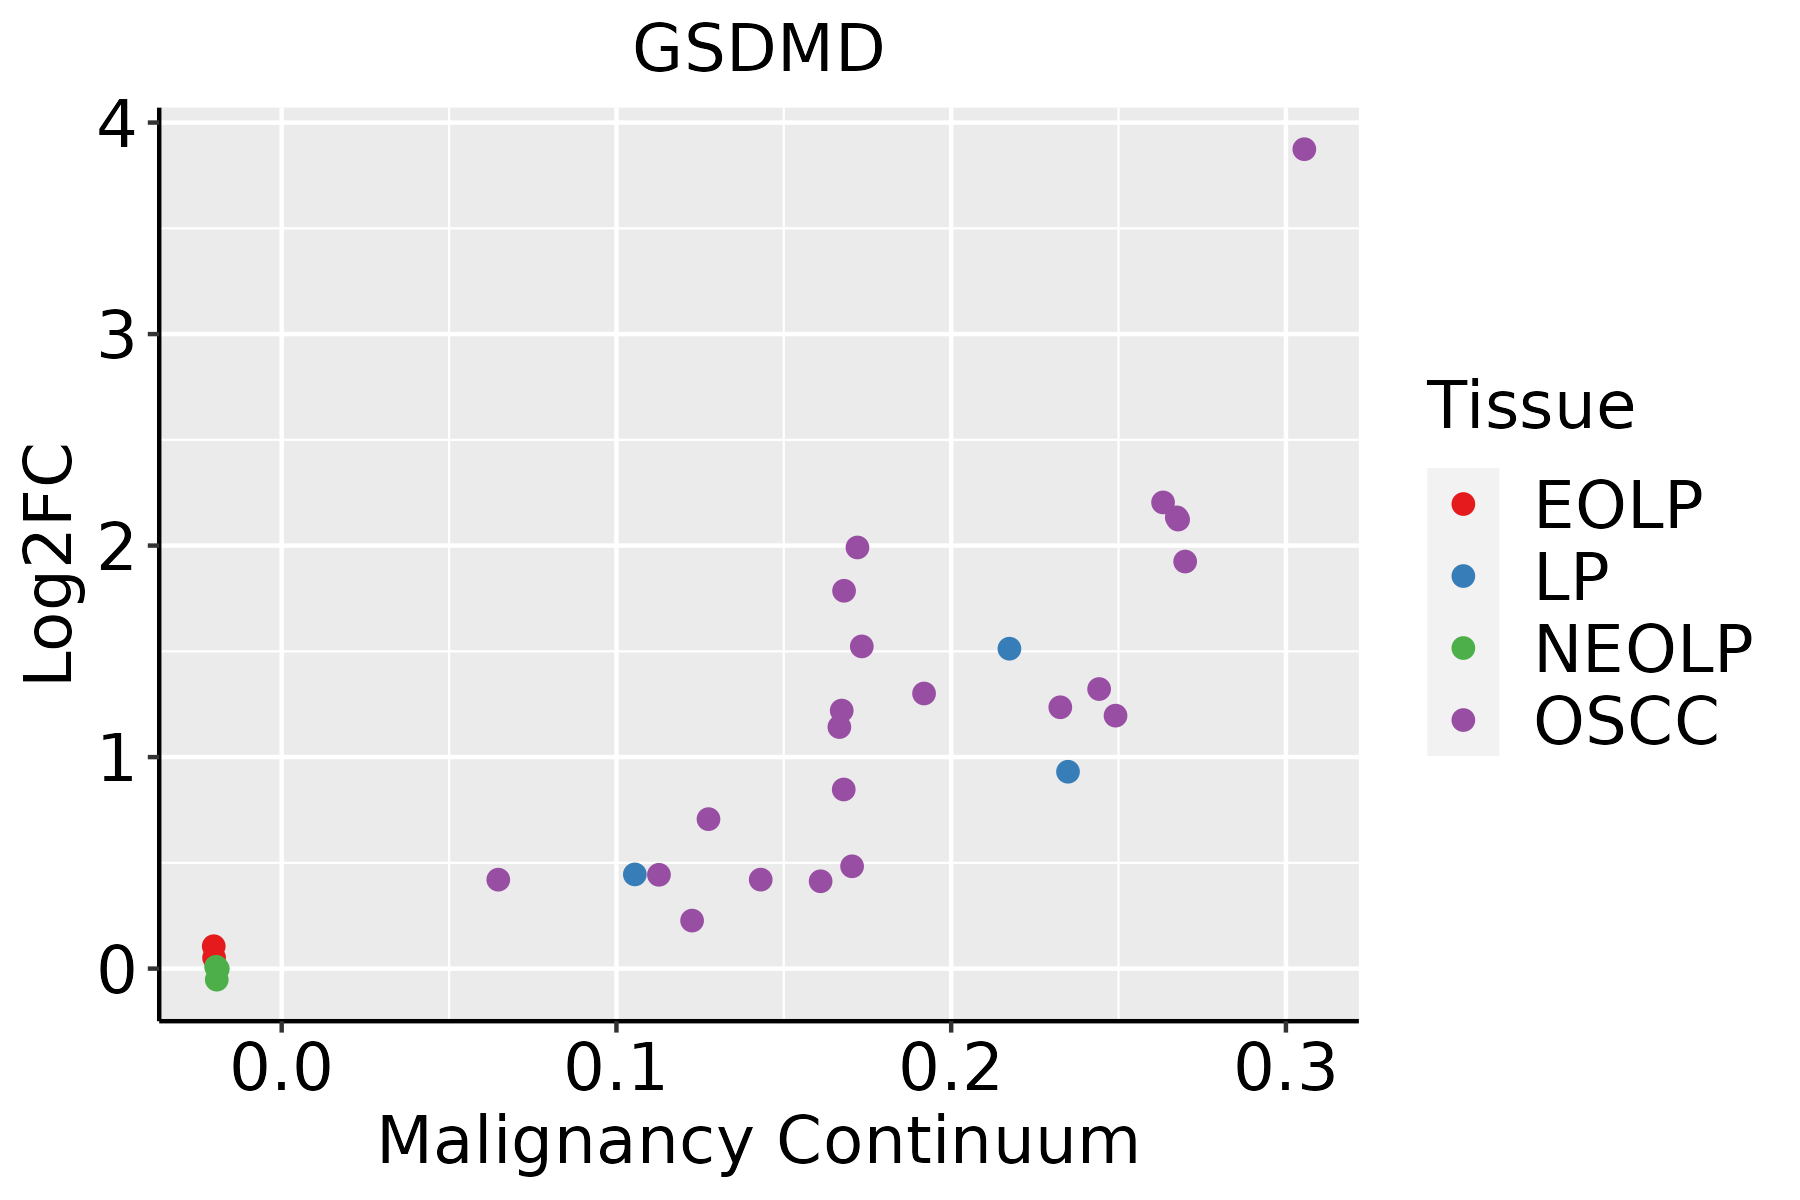 | EOLP: Erosive Oral lichen planus |
| LP: leukoplakia | ||
| NEOLP: Non-erosive oral lichen planus | ||
| OSCC: Oral squamous cell carcinoma | ||
| Skin | 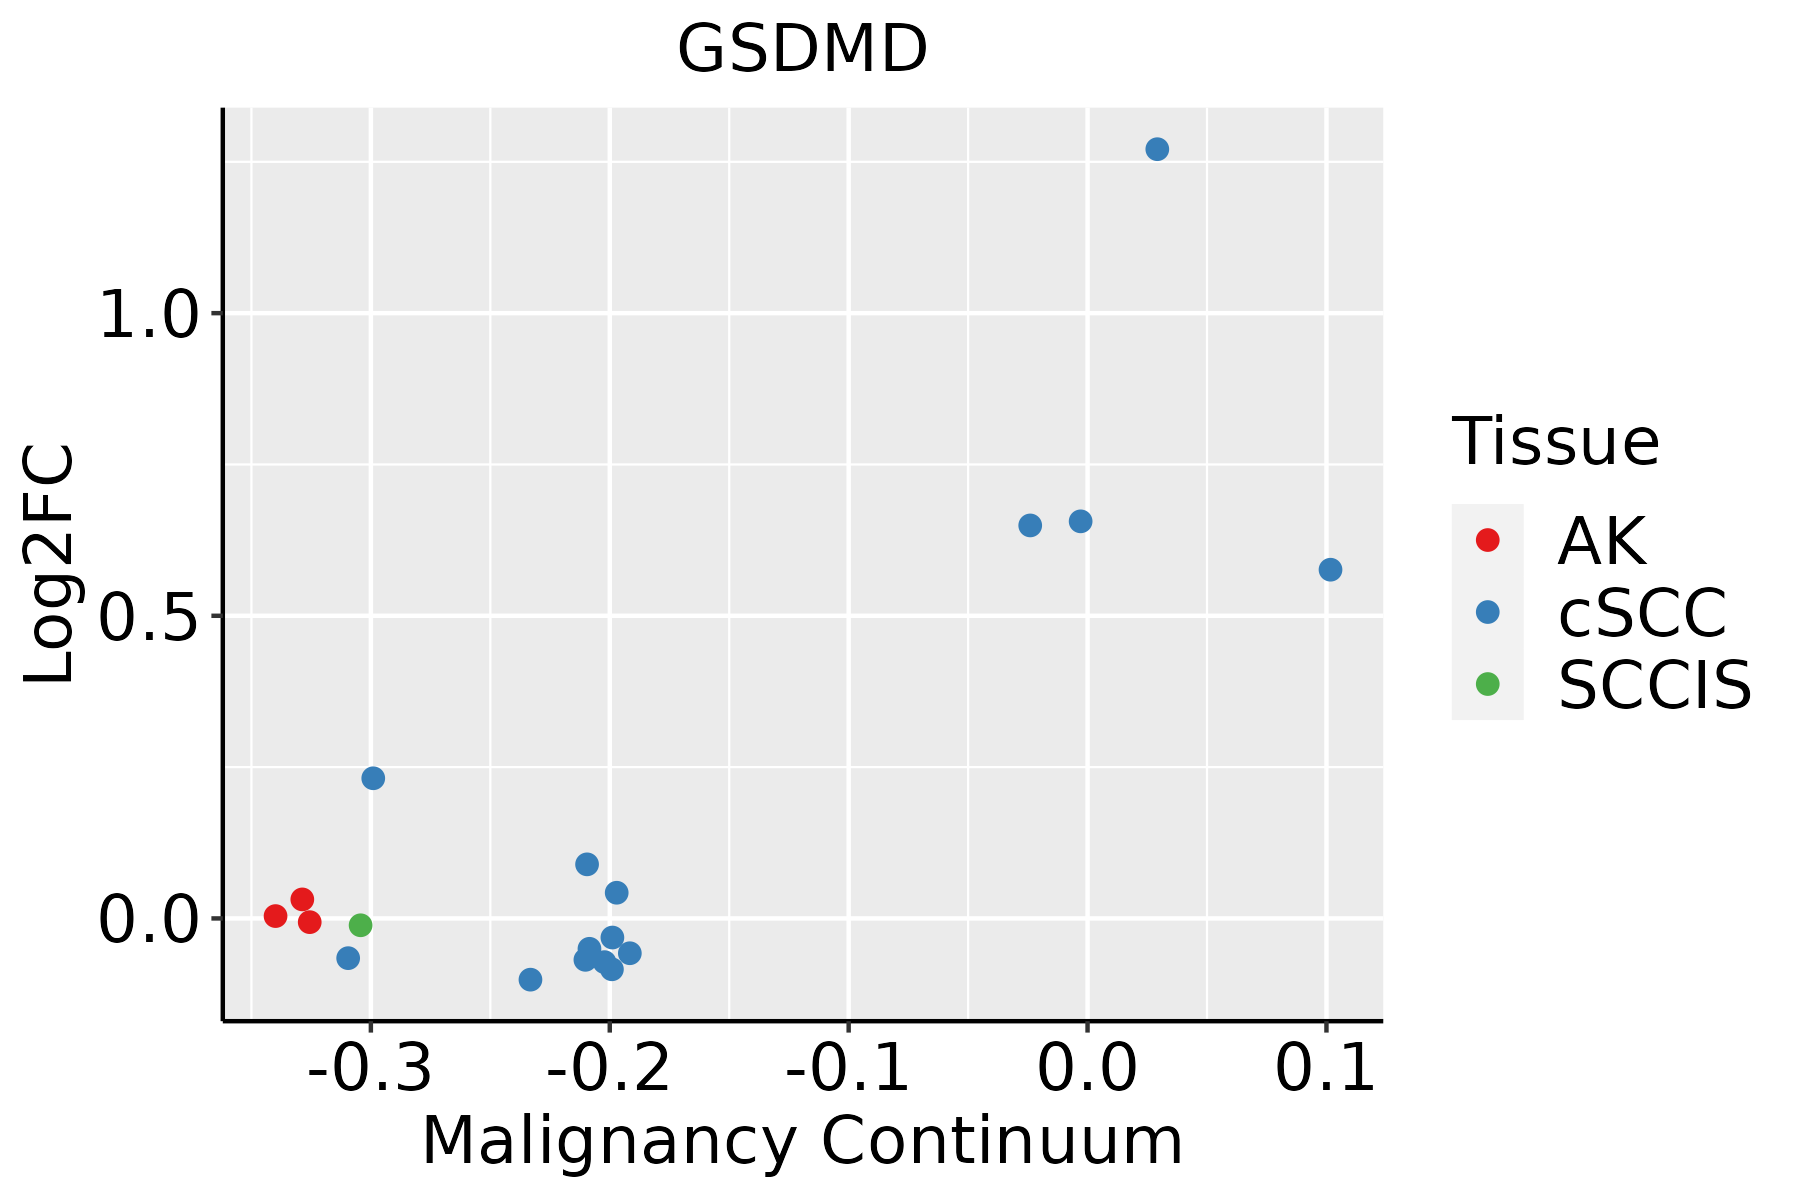 | AK: Actinic keratosis |
| cSCC: Cutaneous squamous cell carcinoma | ||
| SCCIS:squamous cell carcinoma in situ | ||
| Thyroid | 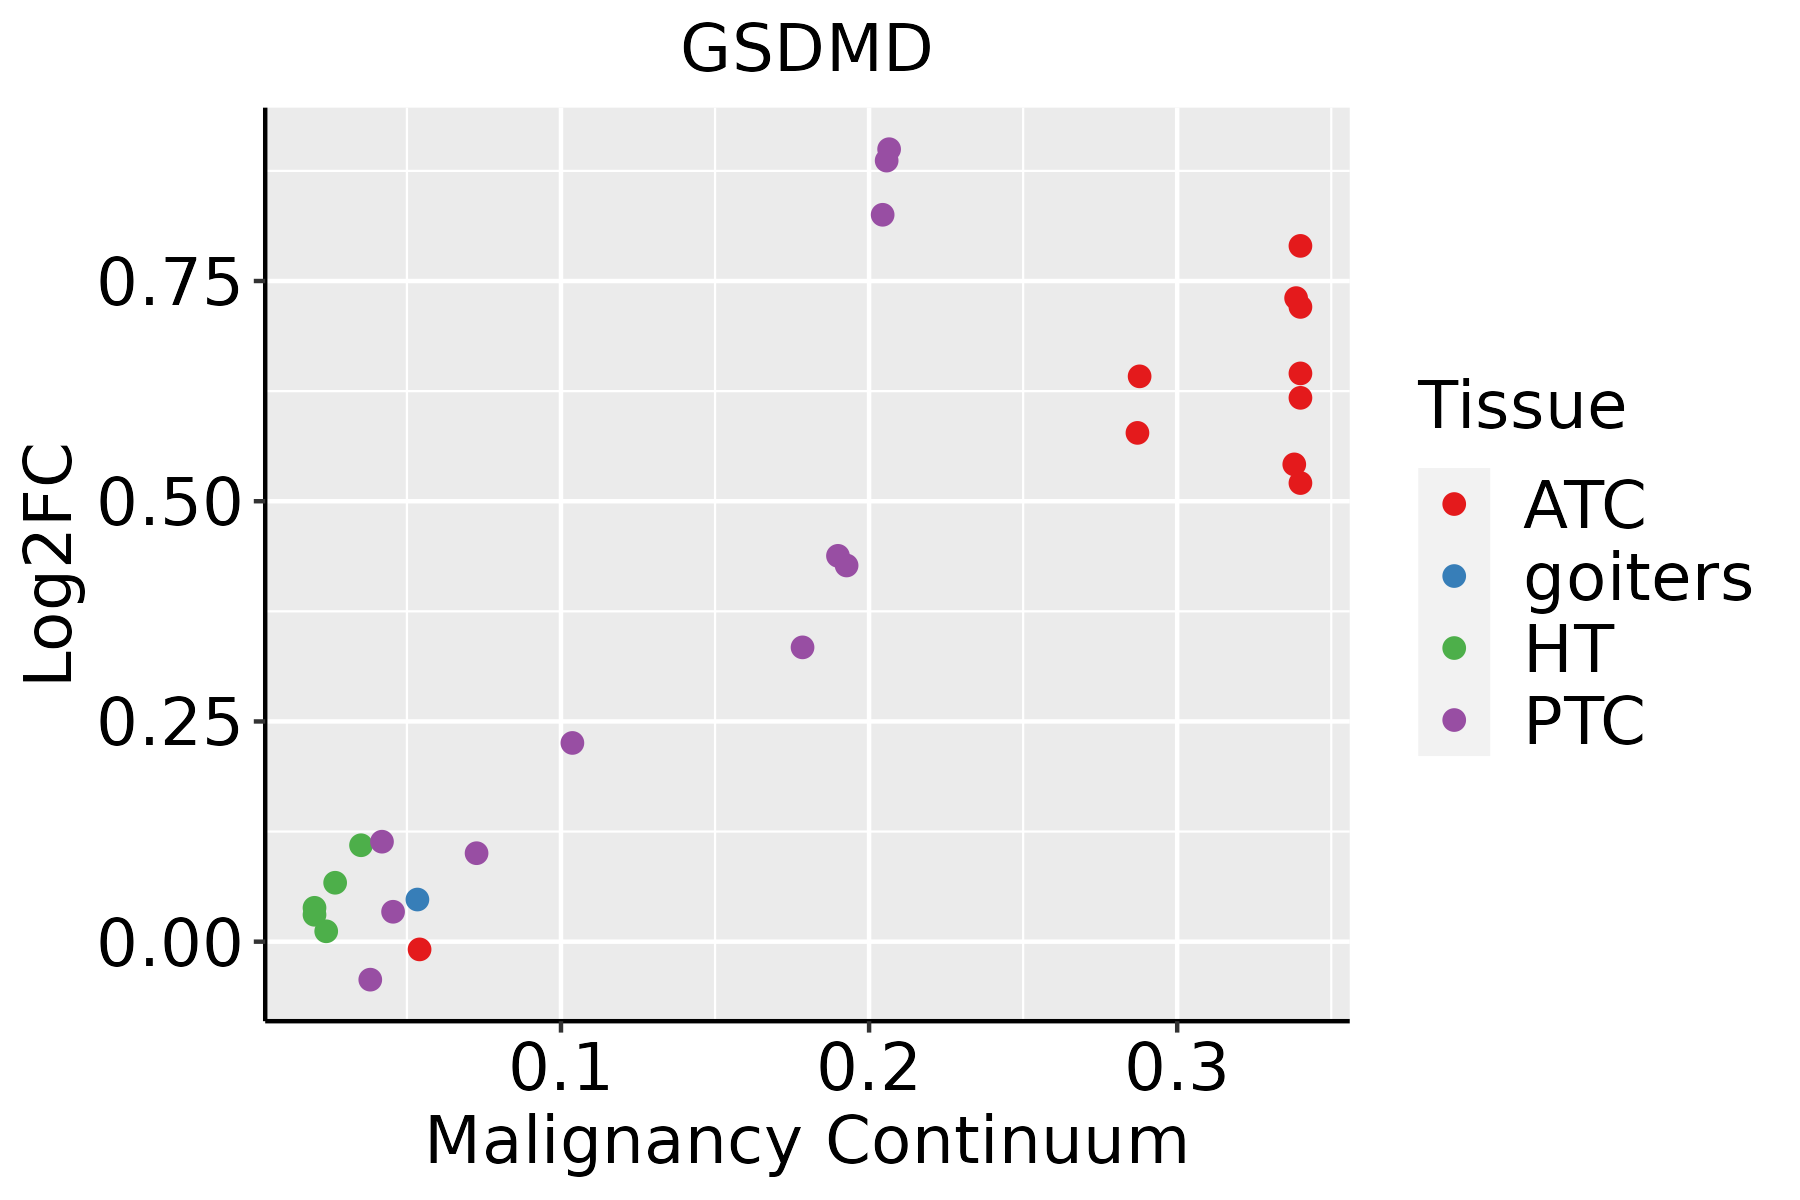 | ATC: Anaplastic thyroid cancer |
| HT: Hashimoto's thyroiditis | ||
| PTC: Papillary thyroid cancer |
| ∗log2FC in expression of this searched gene in stem-like cells from each diseased tissue sample relative to stem-like cells in normal samples in each tissue plotted against the malignancy continuum. Samples are colored based on if they are from different disease stage. |
Top |
Malignant transformation related pathway analysis |
| Find out the enriched GO biological processes and KEGG pathways involved in transition from healthy to precancer to cancer |
| Tissue | Disease Stage | Enriched GO biological Processes |
| Colorectum | AD |  |
| Colorectum | SER |  |
| Colorectum | MSS |  |
| Colorectum | MSI-H |  |
| Colorectum | FAP |  |
| ∗Top 15 enriched GO BP terms are showed in the bar plot of each disease state in each tissue. Each row represents a significant GO biological process which is colored according to the -log10(p.adjust). |
| Page: 1 2 3 4 5 6 7 8 9 |
| GO ID | Tissue | Disease Stage | Description | Gene Ratio | Bg Ratio | pvalue | p.adjust | Count |
| GO:00018196 | Breast | Precancer | positive regulation of cytokine production | 52/1080 | 467/18723 | 4.18e-06 | 1.29e-04 | 52 |
| GO:00714969 | Breast | Precancer | cellular response to external stimulus | 33/1080 | 320/18723 | 9.01e-04 | 1.03e-02 | 33 |
| GO:00316688 | Breast | Precancer | cellular response to extracellular stimulus | 27/1080 | 246/18723 | 1.02e-03 | 1.13e-02 | 27 |
| GO:0032732 | Breast | Precancer | positive regulation of interleukin-1 production | 11/1080 | 73/18723 | 2.96e-03 | 2.55e-02 | 11 |
| GO:000181911 | Breast | IDC | positive regulation of cytokine production | 61/1434 | 467/18723 | 2.81e-05 | 6.58e-04 | 61 |
| GO:007149614 | Breast | IDC | cellular response to external stimulus | 45/1434 | 320/18723 | 5.40e-05 | 1.15e-03 | 45 |
| GO:003166814 | Breast | IDC | cellular response to extracellular stimulus | 35/1434 | 246/18723 | 2.79e-04 | 4.26e-03 | 35 |
| GO:00358214 | Breast | IDC | modulation of process of other organism | 16/1434 | 106/18723 | 6.70e-03 | 4.66e-02 | 16 |
| GO:000181921 | Breast | DCIS | positive regulation of cytokine production | 63/1390 | 467/18723 | 2.76e-06 | 9.42e-05 | 63 |
| GO:007149623 | Breast | DCIS | cellular response to external stimulus | 45/1390 | 320/18723 | 2.55e-05 | 5.87e-04 | 45 |
| GO:003166822 | Breast | DCIS | cellular response to extracellular stimulus | 35/1390 | 246/18723 | 1.54e-04 | 2.59e-03 | 35 |
| GO:00327321 | Breast | DCIS | positive regulation of interleukin-1 production | 13/1390 | 73/18723 | 2.57e-03 | 2.30e-02 | 13 |
| GO:0071496 | Colorectum | AD | cellular response to external stimulus | 94/3918 | 320/18723 | 1.98e-04 | 2.64e-03 | 94 |
| GO:0031668 | Colorectum | AD | cellular response to extracellular stimulus | 71/3918 | 246/18723 | 1.86e-03 | 1.52e-02 | 71 |
| GO:0035821 | Colorectum | AD | modulation of process of other organism | 34/3918 | 106/18723 | 4.73e-03 | 3.22e-02 | 34 |
| GO:00714961 | Colorectum | SER | cellular response to external stimulus | 70/2897 | 320/18723 | 1.40e-03 | 1.53e-02 | 70 |
| GO:00316681 | Colorectum | SER | cellular response to extracellular stimulus | 54/2897 | 246/18723 | 4.26e-03 | 3.45e-02 | 54 |
| GO:00714962 | Colorectum | MSS | cellular response to external stimulus | 82/3467 | 320/18723 | 9.30e-04 | 9.44e-03 | 82 |
| GO:00358211 | Colorectum | MSS | modulation of process of other organism | 33/3467 | 106/18723 | 1.18e-03 | 1.14e-02 | 33 |
| GO:00316682 | Colorectum | MSS | cellular response to extracellular stimulus | 62/3467 | 246/18723 | 5.39e-03 | 3.67e-02 | 62 |
| Page: 1 2 3 |
| Pathway ID | Tissue | Disease Stage | Description | Gene Ratio | Bg Ratio | pvalue | p.adjust | qvalue | Count |
| hsa0513218 | Breast | Precancer | Salmonella infection | 49/684 | 249/8465 | 2.92e-09 | 6.15e-08 | 4.71e-08 | 49 |
| hsa0513219 | Breast | Precancer | Salmonella infection | 49/684 | 249/8465 | 2.92e-09 | 6.15e-08 | 4.71e-08 | 49 |
| hsa0513224 | Breast | IDC | Salmonella infection | 55/867 | 249/8465 | 2.07e-08 | 4.49e-07 | 3.36e-07 | 55 |
| hsa0513234 | Breast | IDC | Salmonella infection | 55/867 | 249/8465 | 2.07e-08 | 4.49e-07 | 3.36e-07 | 55 |
| hsa0513243 | Breast | DCIS | Salmonella infection | 55/846 | 249/8465 | 8.71e-09 | 1.87e-07 | 1.38e-07 | 55 |
| hsa0513253 | Breast | DCIS | Salmonella infection | 55/846 | 249/8465 | 8.71e-09 | 1.87e-07 | 1.38e-07 | 55 |
| hsa05132 | Colorectum | AD | Salmonella infection | 102/2092 | 249/8465 | 7.65e-09 | 1.28e-07 | 8.17e-08 | 102 |
| hsa051321 | Colorectum | AD | Salmonella infection | 102/2092 | 249/8465 | 7.65e-09 | 1.28e-07 | 8.17e-08 | 102 |
| hsa051322 | Colorectum | SER | Salmonella infection | 77/1580 | 249/8465 | 1.56e-06 | 2.35e-05 | 1.71e-05 | 77 |
| hsa051323 | Colorectum | SER | Salmonella infection | 77/1580 | 249/8465 | 1.56e-06 | 2.35e-05 | 1.71e-05 | 77 |
| hsa051324 | Colorectum | MSS | Salmonella infection | 92/1875 | 249/8465 | 5.23e-08 | 9.74e-07 | 5.97e-07 | 92 |
| hsa051325 | Colorectum | MSS | Salmonella infection | 92/1875 | 249/8465 | 5.23e-08 | 9.74e-07 | 5.97e-07 | 92 |
| hsa0513210 | Colorectum | CRC | Salmonella infection | 48/1091 | 249/8465 | 2.43e-03 | 1.69e-02 | 1.15e-02 | 48 |
| hsa0513211 | Colorectum | CRC | Salmonella infection | 48/1091 | 249/8465 | 2.43e-03 | 1.69e-02 | 1.15e-02 | 48 |
| hsa0513239 | Esophagus | HGIN | Salmonella infection | 69/1383 | 249/8465 | 3.02e-06 | 4.47e-05 | 3.55e-05 | 69 |
| hsa046219 | Esophagus | HGIN | NOD-like receptor signaling pathway | 45/1383 | 186/8465 | 3.40e-03 | 2.54e-02 | 2.02e-02 | 45 |
| hsa05132115 | Esophagus | HGIN | Salmonella infection | 69/1383 | 249/8465 | 3.02e-06 | 4.47e-05 | 3.55e-05 | 69 |
| hsa0462114 | Esophagus | HGIN | NOD-like receptor signaling pathway | 45/1383 | 186/8465 | 3.40e-03 | 2.54e-02 | 2.02e-02 | 45 |
| hsa05132211 | Esophagus | ESCC | Salmonella infection | 191/4205 | 249/8465 | 6.51e-19 | 5.45e-17 | 2.79e-17 | 191 |
| hsa0462122 | Esophagus | ESCC | NOD-like receptor signaling pathway | 116/4205 | 186/8465 | 2.90e-04 | 1.03e-03 | 5.30e-04 | 116 |
| Page: 1 2 |
Top |
Cell-cell communication analysis |
| Identification of potential cell-cell interactions between two cell types and their ligand-receptor pairs for different disease states |
| Ligand | Receptor | LRpair | Pathway | Tissue | Disease Stage |
| Page: 1 |
Top |
Single-cell gene regulatory network inference analysis |
| Find out the significant the regulons (TFs) and the target genes of each regulon across cell types for different disease states |
| TF | Cell Type | Tissue | Disease Stage | Target Gene | RSS | Regulon Activity |
| ∗The dot plots of a searched regulon are shown for all cell subpopulations in each disease state of each tissue based on the regulon specific score inferred using pySCENIC and by calculating the average expression. |
| Page: 1 |
Top |
Somatic mutation of malignant transformation related genes |
| Annotation of somatic variants for genes involved in malignant transformation |
| Hugo Symbol | Variant Class | Variant Classification | dbSNP RS | HGVSc | HGVSp | HGVSp Short | SWISSPROT | BIOTYPE | SIFT | PolyPhen | Tumor Sample Barcode | Tissue | Histology | Sex | Age | Stage | Therapy Types | Drugs | Outcome |
| GSDMD | insertion | Frame_Shift_Ins | novel | c.98_99insTGCTCATGGTACCGTAGACAACAGGGAGAACACTGTAATT | p.Phe34AlafsTer22 | p.F34Afs*22 | P57764 | protein_coding | TCGA-AN-A0FX-01 | Breast | breast invasive carcinoma | Female | <65 | I/II | Unknown | Unknown | SD | ||
| GSDMD | SNV | Missense_Mutation | c.43N>C | p.Glu15Gln | p.E15Q | P57764 | protein_coding | deleterious(0) | probably_damaging(0.989) | TCGA-EA-A3HU-01 | Cervix | cervical & endocervical cancer | Female | <65 | I/II | Unknown | Unknown | SD | |
| GSDMD | SNV | Missense_Mutation | c.1430N>T | p.Ser477Leu | p.S477L | P57764 | protein_coding | tolerated(0.74) | benign(0.003) | TCGA-FU-A3HY-01 | Cervix | cervical & endocervical cancer | Female | <65 | I/II | Chemotherapy | cisplatin | CR | |
| GSDMD | SNV | Missense_Mutation | rs753713126 | c.962N>A | p.Arg321Gln | p.R321Q | P57764 | protein_coding | tolerated(0.55) | benign(0.024) | TCGA-AD-6901-01 | Colorectum | colon adenocarcinoma | Male | >=65 | I/II | Chemotherapy | xeloda | PD |
| GSDMD | SNV | Missense_Mutation | c.415N>A | p.Leu139Met | p.L139M | P57764 | protein_coding | deleterious(0) | probably_damaging(0.999) | TCGA-D5-6928-01 | Colorectum | colon adenocarcinoma | Male | >=65 | I/II | Unknown | Unknown | SD | |
| GSDMD | SNV | Missense_Mutation | rs577037853 | c.685N>A | p.Val229Ile | p.V229I | P57764 | protein_coding | tolerated(1) | benign(0.009) | TCGA-G4-6302-01 | Colorectum | colon adenocarcinoma | Female | >=65 | I/II | Unknown | Unknown | SD |
| GSDMD | SNV | Missense_Mutation | c.1452C>G | p.His484Gln | p.H484Q | P57764 | protein_coding | tolerated_low_confidence(0.16) | benign(0) | TCGA-G4-6303-01 | Colorectum | colon adenocarcinoma | Female | <65 | III/IV | Chemotherapy | 5-fu | PD | |
| GSDMD | SNV | Missense_Mutation | novel | c.473A>G | p.Tyr158Cys | p.Y158C | P57764 | protein_coding | deleterious(0) | probably_damaging(0.961) | TCGA-A5-A0VP-01 | Endometrium | uterine corpus endometrioid carcinoma | Female | >=65 | I/II | Unknown | Unknown | SD |
| GSDMD | SNV | Missense_Mutation | novel | c.925N>G | p.Cys309Gly | p.C309G | P57764 | protein_coding | tolerated(0.14) | benign(0.196) | TCGA-AP-A059-01 | Endometrium | uterine corpus endometrioid carcinoma | Female | >=65 | I/II | Unknown | Unknown | SD |
| GSDMD | SNV | Missense_Mutation | rs143201688 | c.158N>A | p.Arg53His | p.R53H | P57764 | protein_coding | deleterious(0.01) | probably_damaging(0.966) | TCGA-AP-A0LM-01 | Endometrium | uterine corpus endometrioid carcinoma | Female | <65 | III/IV | Chemotherapy | cisplatin | SD |
| Page: 1 2 3 4 |
Top |
Related drugs of malignant transformation related genes |
| Identification of chemicals and drugs interact with genes involved in malignant transfromation |
| (DGIdb 4.0) |
| Entrez ID | Symbol | Category | Interaction Types | Drug Claim Name | Drug Name | PMIDs |
| Page: 1 |

Copyright 2023-Present -The University of Texas Health Science Center at Houston |