
|
|||||
|
 | |
| |
| |
| |
| |
| |
|
Gene: GSDMC |
Gene summary for GSDMC |
| Gene information | Species | Human | Gene symbol | GSDMC | Gene ID | 56169 |
| Gene name | gasdermin C | |
| Gene Alias | MLZE | |
| Cytomap | 8q24.21 | |
| Gene Type | protein-coding | GO ID | GO:0002376 | UniProtAcc | Q9BYG8 |
Top |
Malignant transformation analysis |
| Identification of the aberrant gene expression in precancerous and cancerous lesions by comparing the gene expression of stem-like cells in diseased tissues with normal stem cells |
| Entrez ID | Symbol | Replicates | Species | Organ | Tissue | Adj P-value | Log2FC | Malignancy |
| 56169 | GSDMC | LZE4T | Human | Esophagus | ESCC | 6.95e-04 | 3.24e-01 | 0.0811 |
| 56169 | GSDMC | LZE22T | Human | Esophagus | ESCC | 3.93e-02 | 4.58e-01 | 0.068 |
| 56169 | GSDMC | P5T-E | Human | Esophagus | ESCC | 7.61e-16 | 5.37e-01 | 0.1327 |
| 56169 | GSDMC | P8T-E | Human | Esophagus | ESCC | 2.51e-02 | 6.99e-02 | 0.0889 |
| 56169 | GSDMC | P9T-E | Human | Esophagus | ESCC | 2.60e-12 | 2.52e-01 | 0.1131 |
| 56169 | GSDMC | P10T-E | Human | Esophagus | ESCC | 1.68e-04 | 1.95e-01 | 0.116 |
| 56169 | GSDMC | P11T-E | Human | Esophagus | ESCC | 1.13e-09 | 4.58e-01 | 0.1426 |
| 56169 | GSDMC | P12T-E | Human | Esophagus | ESCC | 7.08e-10 | 2.75e-01 | 0.1122 |
| 56169 | GSDMC | P15T-E | Human | Esophagus | ESCC | 4.38e-13 | 4.47e-01 | 0.1149 |
| 56169 | GSDMC | P17T-E | Human | Esophagus | ESCC | 4.40e-06 | 5.28e-01 | 0.1278 |
| 56169 | GSDMC | P19T-E | Human | Esophagus | ESCC | 1.50e-04 | 6.41e-01 | 0.1662 |
| 56169 | GSDMC | P21T-E | Human | Esophagus | ESCC | 9.04e-32 | 7.43e-01 | 0.1617 |
| 56169 | GSDMC | P23T-E | Human | Esophagus | ESCC | 6.95e-04 | 1.65e-01 | 0.108 |
| 56169 | GSDMC | P24T-E | Human | Esophagus | ESCC | 1.56e-02 | -2.58e-03 | 0.1287 |
| 56169 | GSDMC | P26T-E | Human | Esophagus | ESCC | 3.76e-06 | 2.29e-01 | 0.1276 |
| 56169 | GSDMC | P28T-E | Human | Esophagus | ESCC | 7.52e-09 | 7.94e-02 | 0.1149 |
| 56169 | GSDMC | P30T-E | Human | Esophagus | ESCC | 3.04e-09 | 5.54e-01 | 0.137 |
| 56169 | GSDMC | P31T-E | Human | Esophagus | ESCC | 7.20e-09 | 2.76e-01 | 0.1251 |
| 56169 | GSDMC | P36T-E | Human | Esophagus | ESCC | 2.09e-02 | 1.80e-01 | 0.1187 |
| 56169 | GSDMC | P37T-E | Human | Esophagus | ESCC | 3.77e-11 | 2.42e-01 | 0.1371 |
| Page: 1 2 3 |
| Tissue | Expression Dynamics | Abbreviation |
| Esophagus | 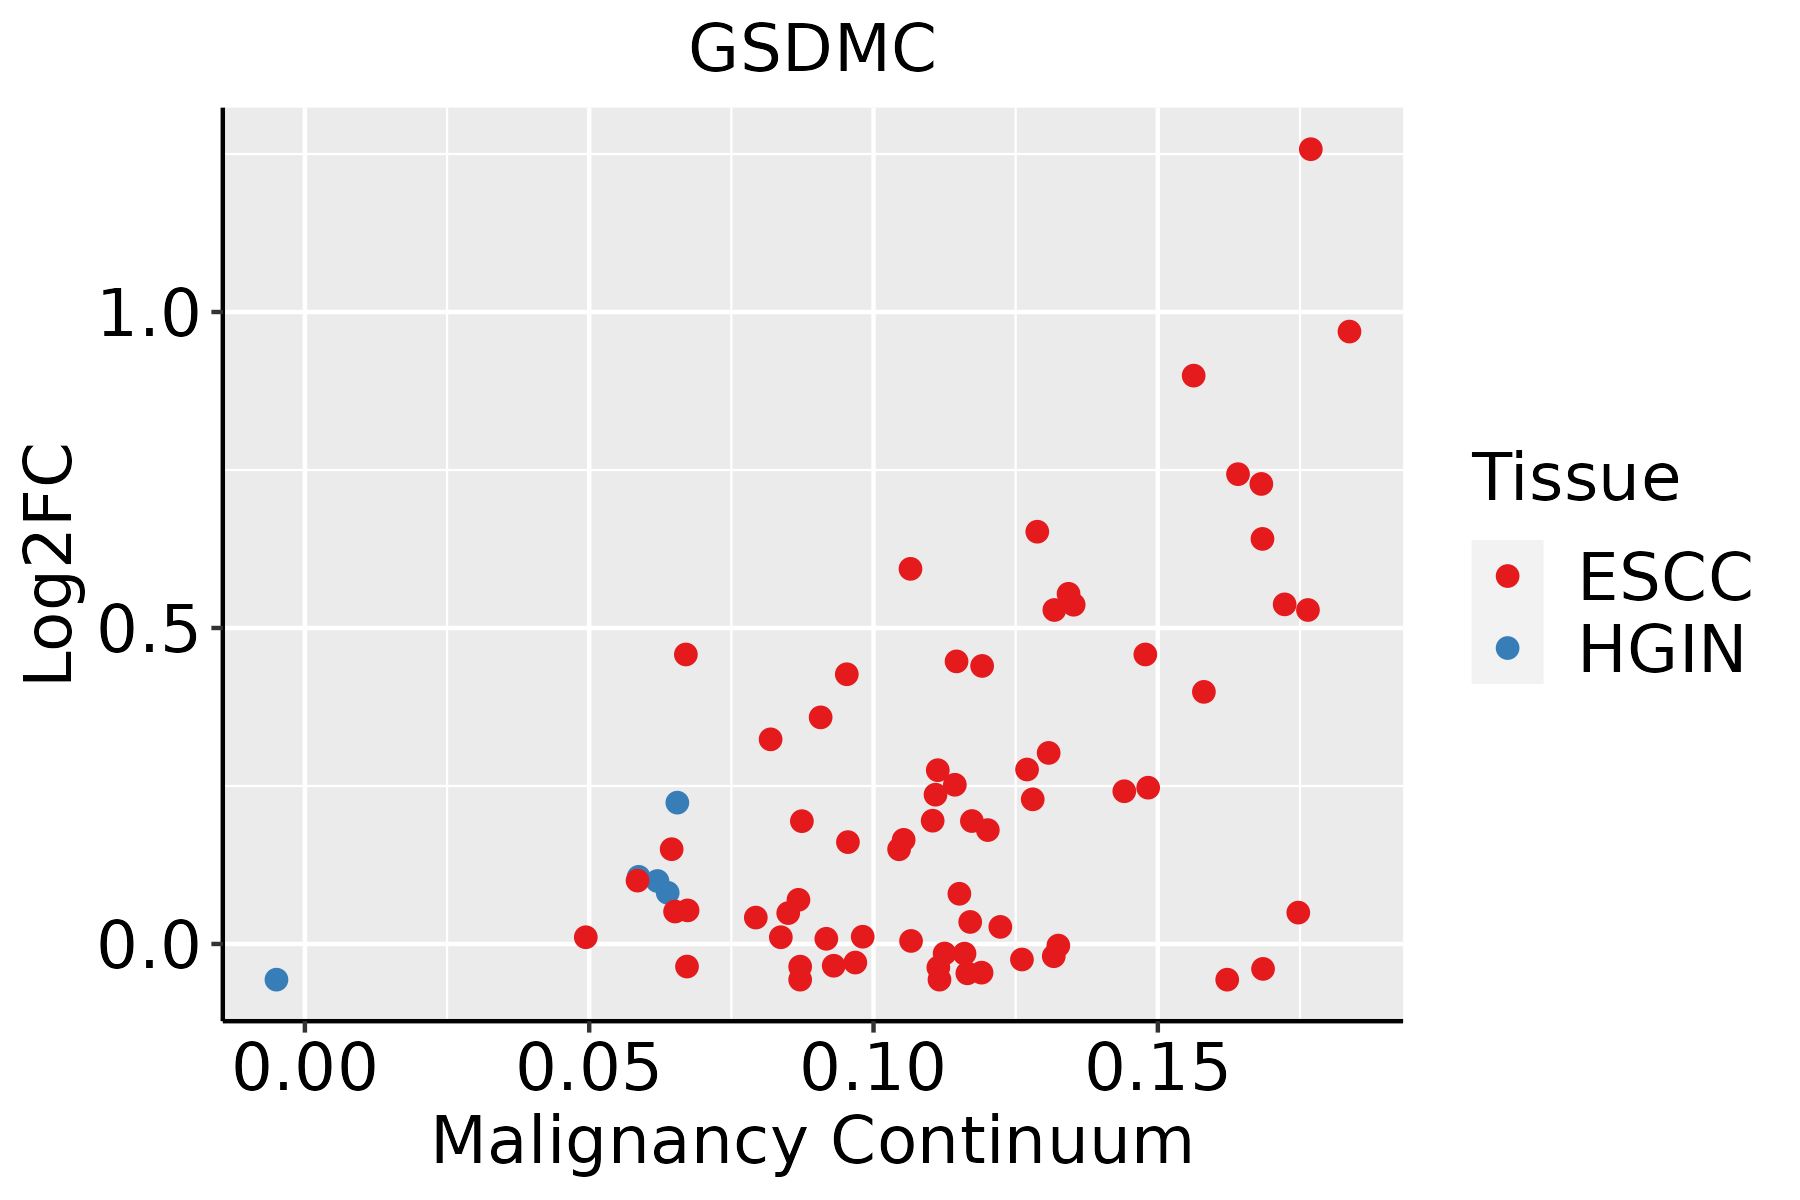 | ESCC: Esophageal squamous cell carcinoma |
| HGIN: High-grade intraepithelial neoplasias | ||
| LGIN: Low-grade intraepithelial neoplasias | ||
| Oral Cavity | 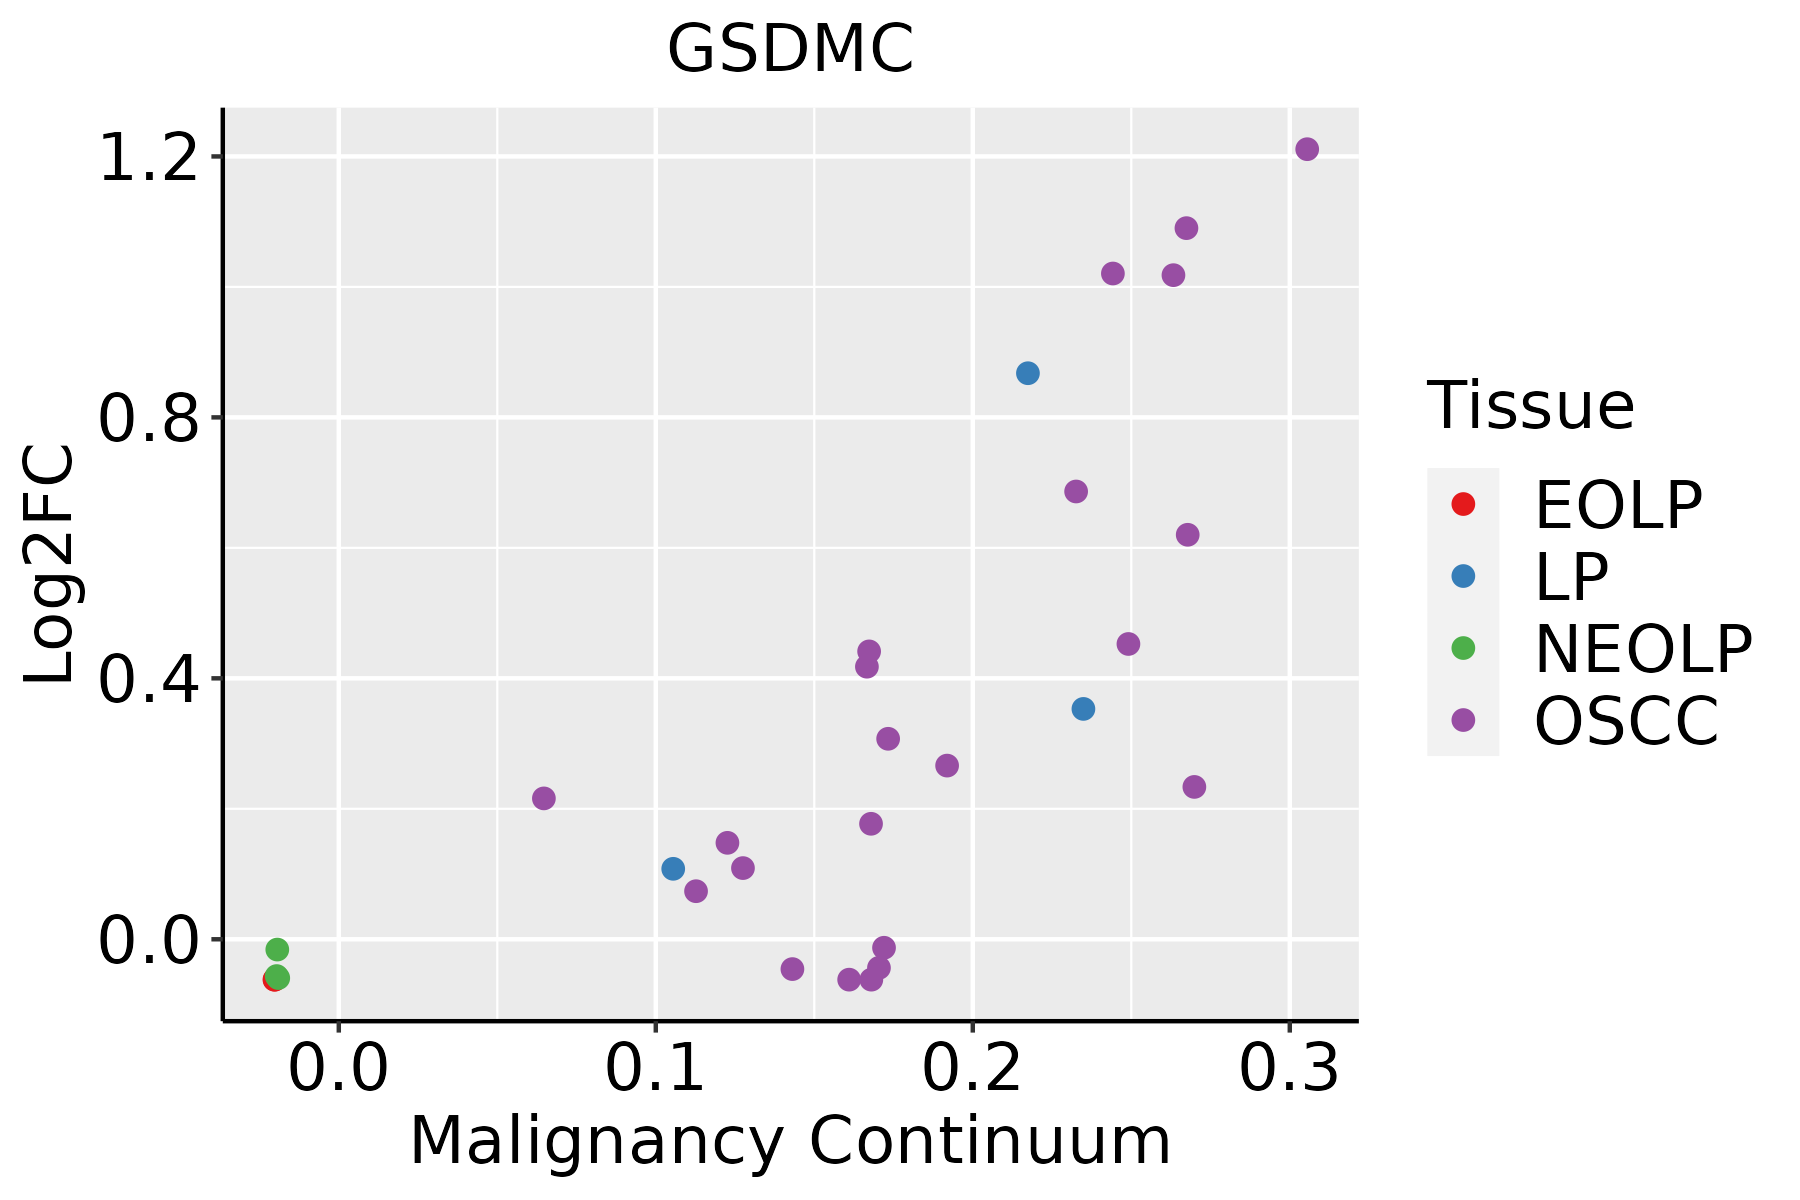 | EOLP: Erosive Oral lichen planus |
| LP: leukoplakia | ||
| NEOLP: Non-erosive oral lichen planus | ||
| OSCC: Oral squamous cell carcinoma | ||
| Skin | 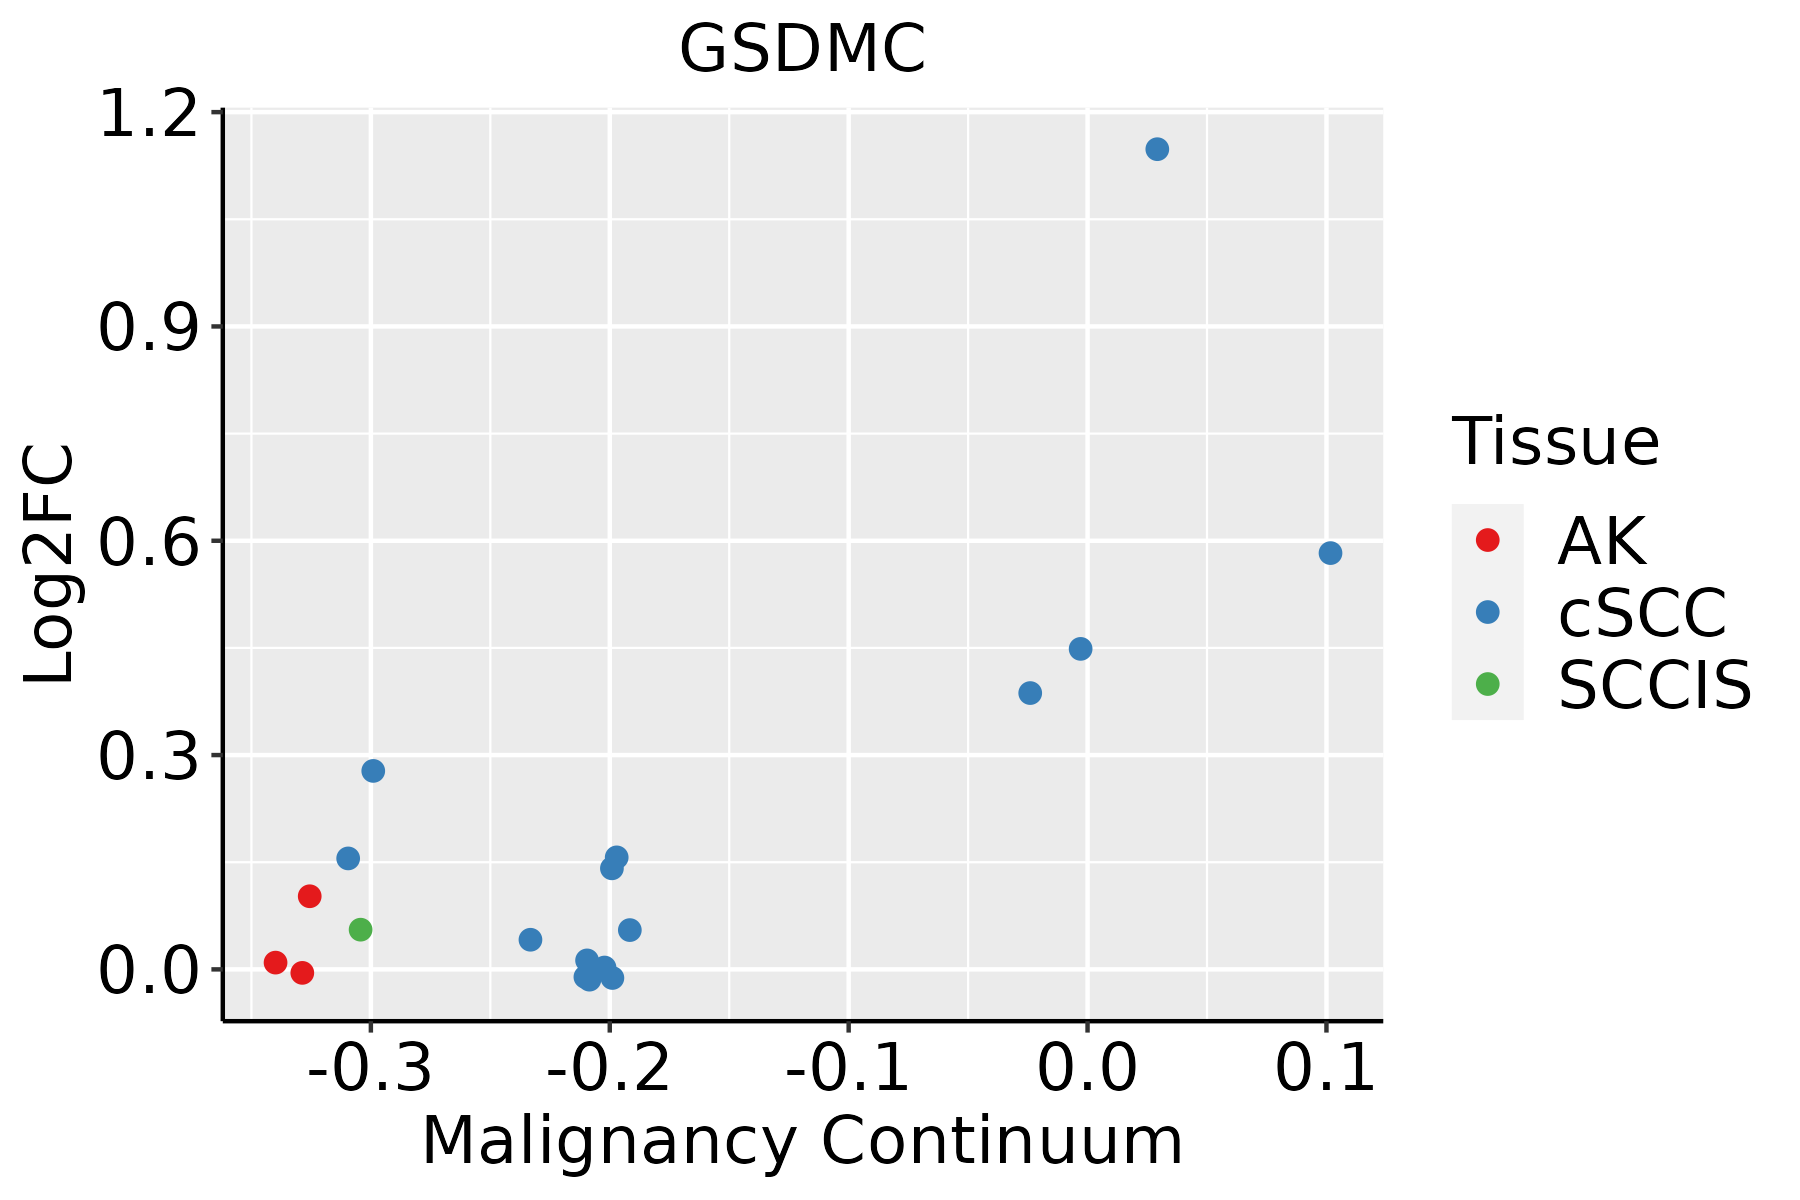 | AK: Actinic keratosis |
| cSCC: Cutaneous squamous cell carcinoma | ||
| SCCIS:squamous cell carcinoma in situ |
| ∗log2FC in expression of this searched gene in stem-like cells from each diseased tissue sample relative to stem-like cells in normal samples in each tissue plotted against the malignancy continuum. Samples are colored based on if they are from different disease stage. |
Top |
Malignant transformation related pathway analysis |
| Find out the enriched GO biological processes and KEGG pathways involved in transition from healthy to precancer to cancer |
| Tissue | Disease Stage | Enriched GO biological Processes |
| Colorectum | AD |  |
| Colorectum | SER |  |
| Colorectum | MSS |  |
| Colorectum | MSI-H |  |
| Colorectum | FAP |  |
| ∗Top 15 enriched GO BP terms are showed in the bar plot of each disease state in each tissue. Each row represents a significant GO biological process which is colored according to the -log10(p.adjust). |
| Page: 1 2 3 4 5 6 7 8 9 |
| GO ID | Tissue | Disease Stage | Description | Gene Ratio | Bg Ratio | pvalue | p.adjust | Count |
| Page: 1 |
| Pathway ID | Tissue | Disease Stage | Description | Gene Ratio | Bg Ratio | pvalue | p.adjust | qvalue | Count |
| Page: 1 |
Top |
Cell-cell communication analysis |
| Identification of potential cell-cell interactions between two cell types and their ligand-receptor pairs for different disease states |
| Ligand | Receptor | LRpair | Pathway | Tissue | Disease Stage |
| Page: 1 |
Top |
Single-cell gene regulatory network inference analysis |
| Find out the significant the regulons (TFs) and the target genes of each regulon across cell types for different disease states |
| TF | Cell Type | Tissue | Disease Stage | Target Gene | RSS | Regulon Activity |
| ∗The dot plots of a searched regulon are shown for all cell subpopulations in each disease state of each tissue based on the regulon specific score inferred using pySCENIC and by calculating the average expression. |
| Page: 1 |
Top |
Somatic mutation of malignant transformation related genes |
| Annotation of somatic variants for genes involved in malignant transformation |
| Hugo Symbol | Variant Class | Variant Classification | dbSNP RS | HGVSc | HGVSp | HGVSp Short | SWISSPROT | BIOTYPE | SIFT | PolyPhen | Tumor Sample Barcode | Tissue | Histology | Sex | Age | Stage | Therapy Types | Drugs | Outcome |
| GSDMC | SNV | Missense_Mutation | rs754298748 | c.119N>A | p.Arg40Gln | p.R40Q | Q9BYG8 | protein_coding | tolerated(0.71) | benign(0.041) | TCGA-A2-A0D4-01 | Breast | breast invasive carcinoma | Female | <65 | I/II | Chemotherapy | adriamycin | SD |
| GSDMC | SNV | Missense_Mutation | rs550446533 | c.100C>T | p.Arg34Cys | p.R34C | Q9BYG8 | protein_coding | tolerated(0.14) | benign(0.071) | TCGA-A7-A3RF-01 | Breast | breast invasive carcinoma | Female | >=65 | I/II | Hormone Therapy | anastrozole | PD |
| GSDMC | SNV | Missense_Mutation | rs765739292 | c.143N>T | p.Ser48Leu | p.S48L | Q9BYG8 | protein_coding | tolerated(0.42) | benign(0.003) | TCGA-BH-A0HF-01 | Breast | breast invasive carcinoma | Female | >=65 | I/II | Hormone Therapy | arimidex | SD |
| GSDMC | SNV | Missense_Mutation | c.1442N>T | p.Arg481Met | p.R481M | Q9BYG8 | protein_coding | deleterious(0) | probably_damaging(0.979) | TCGA-C8-A1HJ-01 | Breast | breast invasive carcinoma | Female | <65 | I/II | Unknown | Unknown | SD | |
| GSDMC | SNV | Missense_Mutation | novel | c.317N>T | p.Ser106Leu | p.S106L | Q9BYG8 | protein_coding | tolerated(0.1) | benign(0.062) | TCGA-C8-A8HP-01 | Breast | breast invasive carcinoma | Female | <65 | III/IV | Chemotherapy | 5-fluorouracil | CR |
| GSDMC | SNV | Missense_Mutation | c.972N>G | p.Phe324Leu | p.F324L | Q9BYG8 | protein_coding | tolerated(0.28) | possibly_damaging(0.446) | TCGA-E9-A22E-01 | Breast | breast invasive carcinoma | Female | <65 | III/IV | Chemotherapy | cyclophosphane | SD | |
| GSDMC | deletion | Frame_Shift_Del | c.1059_1060delNN | p.Ala354SerfsTer37 | p.A354Sfs*37 | Q9BYG8 | protein_coding | TCGA-AN-A0FX-01 | Breast | breast invasive carcinoma | Female | <65 | I/II | Unknown | Unknown | SD | |||
| GSDMC | insertion | Nonsense_Mutation | novel | c.1215_1216insAATGAGAGGGCCTAGGATTGCTATACACTATG | p.Leu406AsnfsTer5 | p.L406Nfs*5 | Q9BYG8 | protein_coding | TCGA-BH-A0DZ-01 | Breast | breast invasive carcinoma | Female | <65 | I/II | Chemotherapy | docetaxel | SD | ||
| GSDMC | SNV | Missense_Mutation | novel | c.206G>A | p.Ser69Asn | p.S69N | Q9BYG8 | protein_coding | tolerated(0.39) | benign(0.145) | TCGA-C5-A7X5-01 | Cervix | cervical & endocervical cancer | Female | >=65 | I/II | Chemotherapy | carboplatin | PD |
| GSDMC | SNV | Missense_Mutation | c.1001N>T | p.Ser334Leu | p.S334L | Q9BYG8 | protein_coding | deleterious(0.02) | probably_damaging(0.961) | TCGA-IR-A3LH-01 | Cervix | cervical & endocervical cancer | Female | <65 | I/II | Chemotherapy | cisplatin | CR |
| Page: 1 2 3 4 5 6 7 8 |
Top |
Related drugs of malignant transformation related genes |
| Identification of chemicals and drugs interact with genes involved in malignant transfromation |
| (DGIdb 4.0) |
| Entrez ID | Symbol | Category | Interaction Types | Drug Claim Name | Drug Name | PMIDs |
| Page: 1 |

Copyright 2023-Present -The University of Texas Health Science Center at Houston |