
|
|||||
|
 | |
| |
| |
| |
| |
| |
|
Gene: GSAP |
Gene summary for GSAP |
| Gene information | Species | Human | Gene symbol | GSAP | Gene ID | 54103 |
| Gene name | gamma-secretase activating protein | |
| Gene Alias | PION | |
| Cytomap | 7q11.23 | |
| Gene Type | protein-coding | GO ID | GO:0006508 | UniProtAcc | A4D1B5 |
Top |
Malignant transformation analysis |
| Identification of the aberrant gene expression in precancerous and cancerous lesions by comparing the gene expression of stem-like cells in diseased tissues with normal stem cells |
| Entrez ID | Symbol | Replicates | Species | Organ | Tissue | Adj P-value | Log2FC | Malignancy |
| 54103 | GSAP | RNA-P25T1-P25T1-1 | Human | Lung | AIS | 7.77e-12 | 5.64e-01 | -0.2116 |
| 54103 | GSAP | RNA-P25T1-P25T1-2 | Human | Lung | AIS | 1.06e-06 | 7.32e-01 | -0.1941 |
| 54103 | GSAP | RNA-P25T1-P25T1-3 | Human | Lung | AIS | 1.03e-04 | 6.38e-01 | -0.2107 |
| 54103 | GSAP | RNA-P25T1-P25T1-4 | Human | Lung | AIS | 2.79e-09 | 5.59e-01 | -0.2119 |
| 54103 | GSAP | RNA-P6T2-P6T2-1 | Human | Lung | IAC | 1.46e-22 | 7.12e-01 | -0.0166 |
| 54103 | GSAP | RNA-P6T2-P6T2-2 | Human | Lung | IAC | 1.68e-20 | 6.76e-01 | -0.0132 |
| 54103 | GSAP | RNA-P6T2-P6T2-3 | Human | Lung | IAC | 2.87e-28 | 7.25e-01 | -0.013 |
| 54103 | GSAP | RNA-P6T2-P6T2-4 | Human | Lung | IAC | 1.48e-16 | 6.08e-01 | -0.0121 |
| 54103 | GSAP | C21 | Human | Oral cavity | OSCC | 8.80e-20 | 5.09e-01 | 0.2678 |
| 54103 | GSAP | C38 | Human | Oral cavity | OSCC | 1.04e-04 | 4.69e-01 | 0.172 |
| 54103 | GSAP | C46 | Human | Oral cavity | OSCC | 1.26e-17 | 3.95e-01 | 0.1673 |
| 54103 | GSAP | C08 | Human | Oral cavity | OSCC | 1.42e-09 | 2.36e-01 | 0.1919 |
| 54103 | GSAP | LN46 | Human | Oral cavity | OSCC | 5.13e-12 | 5.14e-01 | 0.1666 |
| 54103 | GSAP | HTA12-23-1 | Human | Pancreas | PDAC | 1.57e-02 | 4.56e-01 | 0.3405 |
| 54103 | GSAP | HTA12-26-1 | Human | Pancreas | PDAC | 2.11e-14 | 6.70e-01 | 0.3728 |
| 54103 | GSAP | HTA12-29-1 | Human | Pancreas | PDAC | 2.35e-21 | 5.28e-01 | 0.3722 |
| Page: 1 |
| Tissue | Expression Dynamics | Abbreviation |
| Lung | 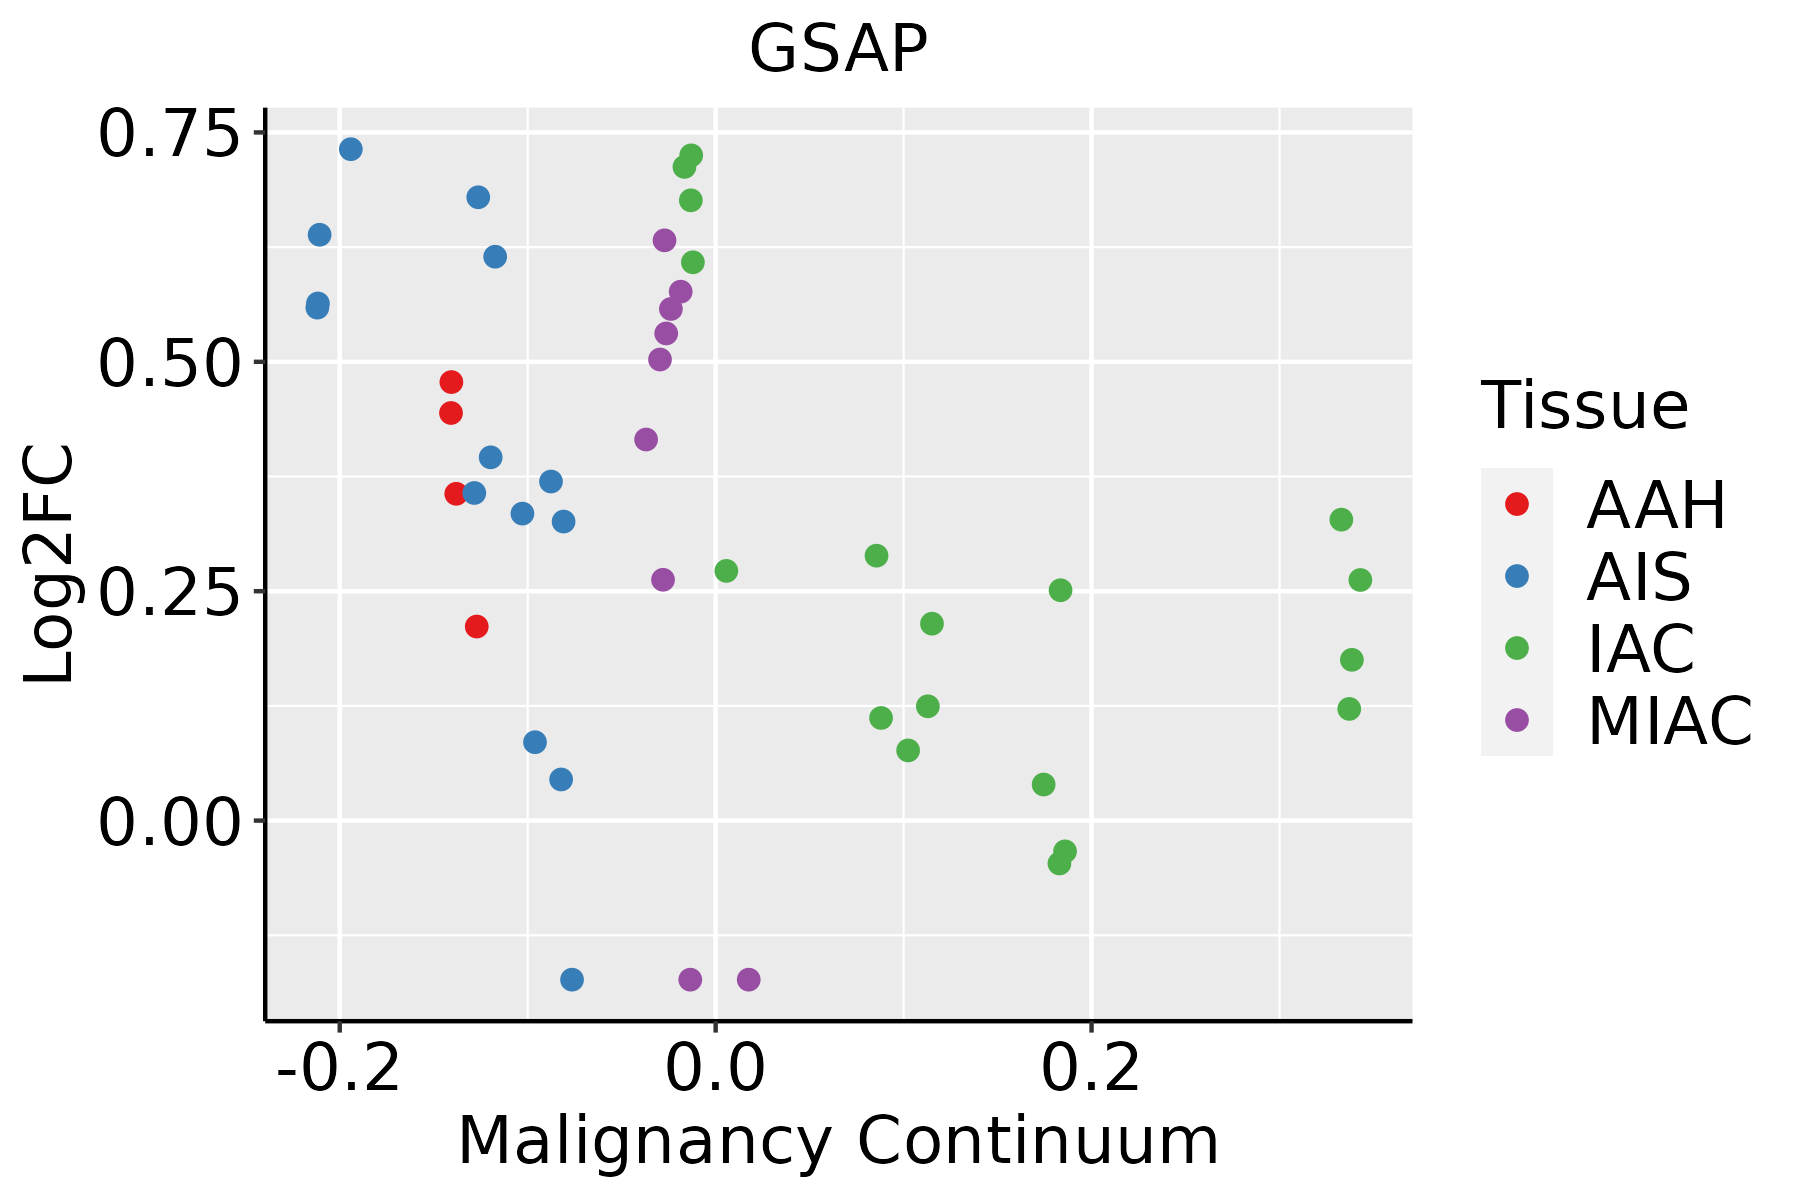 | AAH: Atypical adenomatous hyperplasia |
| AIS: Adenocarcinoma in situ | ||
| IAC: Invasive lung adenocarcinoma | ||
| MIA: Minimally invasive adenocarcinoma | ||
| Oral Cavity | 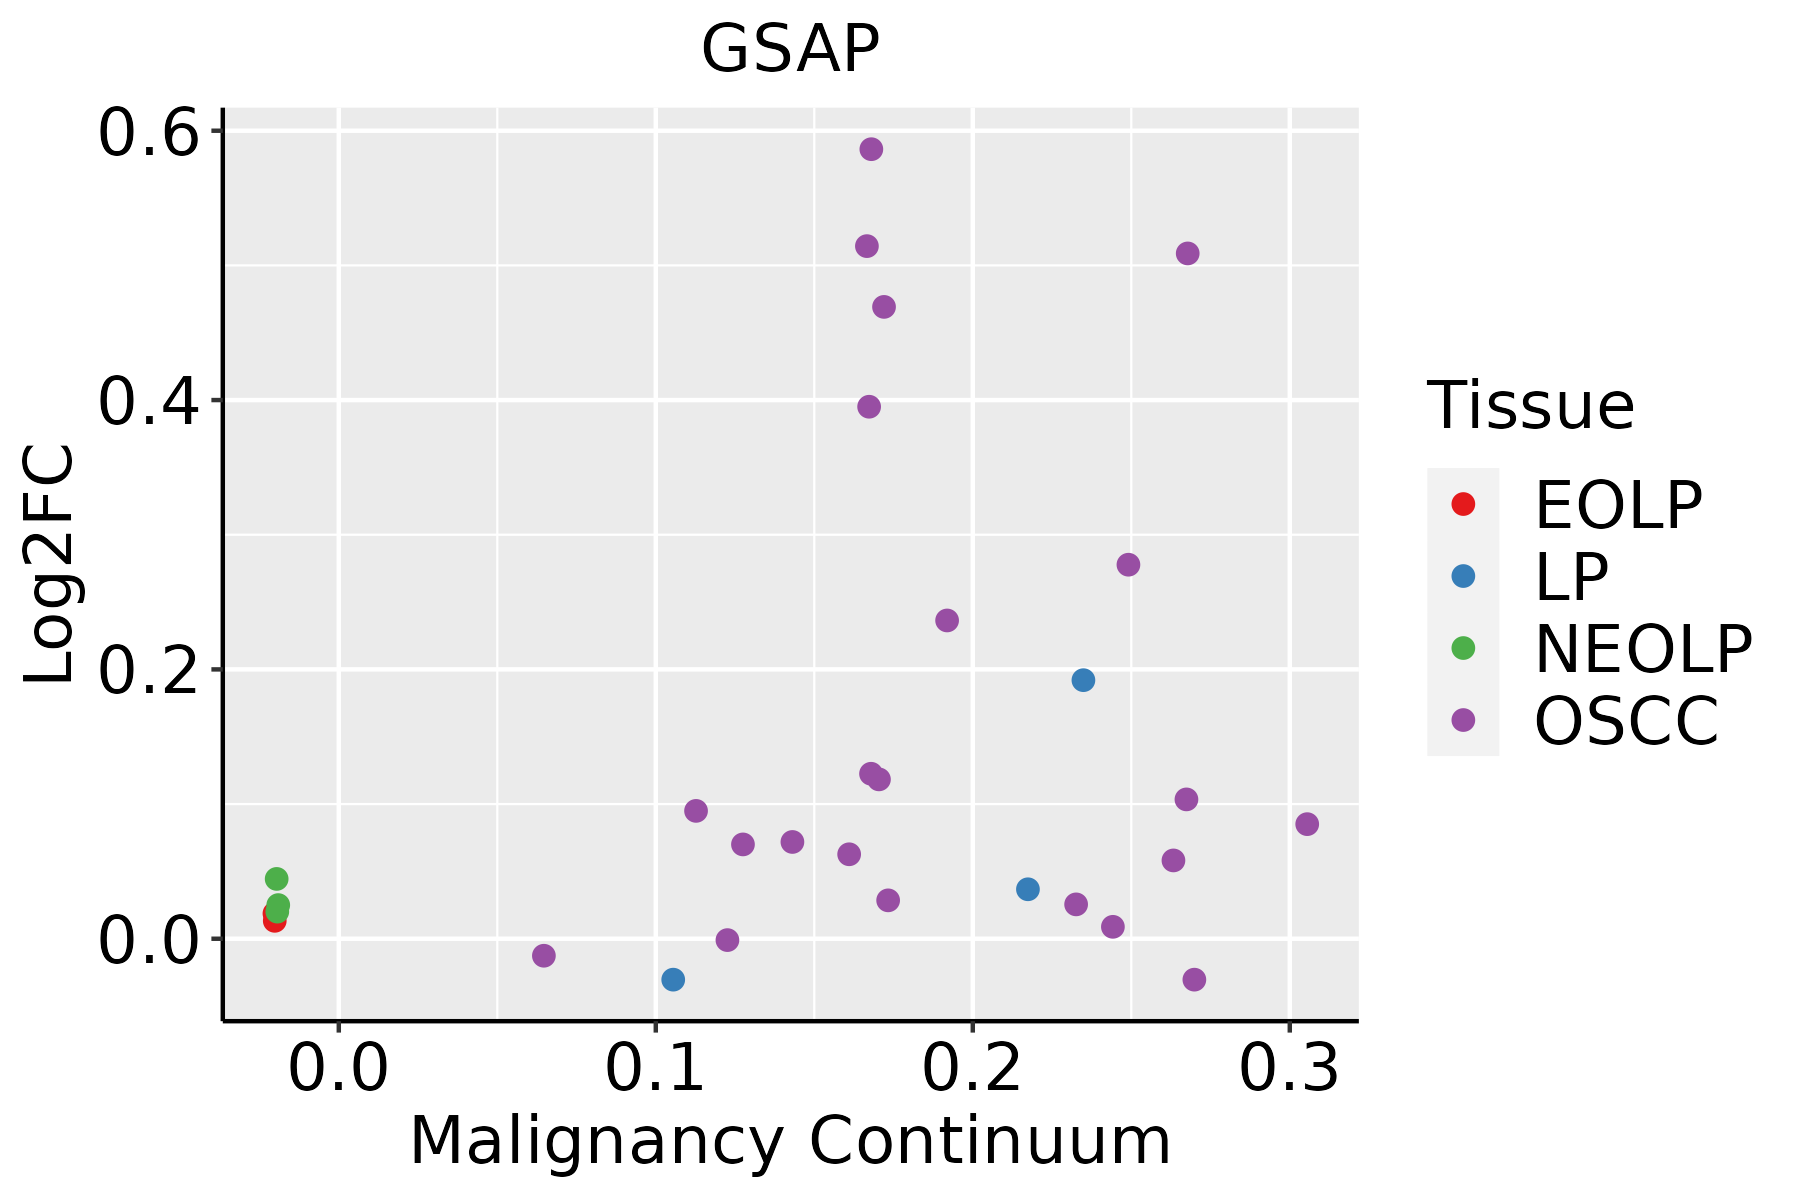 | EOLP: Erosive Oral lichen planus |
| LP: leukoplakia | ||
| NEOLP: Non-erosive oral lichen planus | ||
| OSCC: Oral squamous cell carcinoma |
| ∗log2FC in expression of this searched gene in stem-like cells from each diseased tissue sample relative to stem-like cells in normal samples in each tissue plotted against the malignancy continuum. Samples are colored based on if they are from different disease stage. |
Top |
Malignant transformation related pathway analysis |
| Find out the enriched GO biological processes and KEGG pathways involved in transition from healthy to precancer to cancer |
| Tissue | Disease Stage | Enriched GO biological Processes |
| Colorectum | AD |  |
| Colorectum | SER |  |
| Colorectum | MSS |  |
| Colorectum | MSI-H |  |
| Colorectum | FAP |  |
| ∗Top 15 enriched GO BP terms are showed in the bar plot of each disease state in each tissue. Each row represents a significant GO biological process which is colored according to the -log10(p.adjust). |
| Page: 1 2 3 4 5 6 7 8 9 |
| GO ID | Tissue | Disease Stage | Description | Gene Ratio | Bg Ratio | pvalue | p.adjust | Count |
| GO:00342508 | Lung | IAC | positive regulation of cellular amide metabolic process | 34/2061 | 162/18723 | 1.55e-04 | 2.82e-03 | 34 |
| GO:003425013 | Lung | AIS | positive regulation of cellular amide metabolic process | 31/1849 | 162/18723 | 2.41e-04 | 4.78e-03 | 31 |
| GO:003425019 | Oral cavity | OSCC | positive regulation of cellular amide metabolic process | 115/7305 | 162/18723 | 1.28e-16 | 1.05e-14 | 115 |
| GO:00429873 | Oral cavity | OSCC | amyloid precursor protein catabolic process | 40/7305 | 68/18723 | 7.28e-04 | 3.98e-03 | 40 |
| GO:00429823 | Oral cavity | OSCC | amyloid precursor protein metabolic process | 52/7305 | 95/18723 | 1.33e-03 | 6.62e-03 | 52 |
| GO:00504353 | Oral cavity | OSCC | amyloid-beta metabolic process | 36/7305 | 67/18723 | 1.01e-02 | 3.51e-02 | 36 |
| GO:00342052 | Oral cavity | OSCC | amyloid-beta formation | 31/7305 | 57/18723 | 1.32e-02 | 4.38e-02 | 31 |
| Page: 1 |
| Pathway ID | Tissue | Disease Stage | Description | Gene Ratio | Bg Ratio | pvalue | p.adjust | qvalue | Count |
| Page: 1 |
Top |
Cell-cell communication analysis |
| Identification of potential cell-cell interactions between two cell types and their ligand-receptor pairs for different disease states |
| Ligand | Receptor | LRpair | Pathway | Tissue | Disease Stage |
| Page: 1 |
Top |
Single-cell gene regulatory network inference analysis |
| Find out the significant the regulons (TFs) and the target genes of each regulon across cell types for different disease states |
| TF | Cell Type | Tissue | Disease Stage | Target Gene | RSS | Regulon Activity |
| ∗The dot plots of a searched regulon are shown for all cell subpopulations in each disease state of each tissue based on the regulon specific score inferred using pySCENIC and by calculating the average expression. |
| Page: 1 |
Top |
Somatic mutation of malignant transformation related genes |
| Annotation of somatic variants for genes involved in malignant transformation |
| Hugo Symbol | Variant Class | Variant Classification | dbSNP RS | HGVSc | HGVSp | HGVSp Short | SWISSPROT | BIOTYPE | SIFT | PolyPhen | Tumor Sample Barcode | Tissue | Histology | Sex | Age | Stage | Therapy Types | Drugs | Outcome |
| GSAP | SNV | Missense_Mutation | novel | c.757G>A | p.Asp253Asn | p.D253N | A4D1B5 | protein_coding | deleterious(0.01) | probably_damaging(0.992) | TCGA-AC-A6NO-01 | Breast | breast invasive carcinoma | Female | <65 | I/II | Unknown | Unknown | SD |
| GSAP | SNV | Missense_Mutation | c.487N>G | p.Leu163Val | p.L163V | A4D1B5 | protein_coding | tolerated(0.92) | benign(0.058) | TCGA-AR-A0TX-01 | Breast | breast invasive carcinoma | Female | <65 | I/II | Unknown | Unknown | SD | |
| GSAP | SNV | Missense_Mutation | rs372119431 | c.205G>A | p.Val69Ile | p.V69I | A4D1B5 | protein_coding | tolerated(0.39) | benign(0.039) | TCGA-C8-A1HI-01 | Breast | breast invasive carcinoma | Female | <65 | III/IV | Unknown | Unknown | SD |
| GSAP | SNV | Missense_Mutation | c.2351T>G | p.Leu784Arg | p.L784R | A4D1B5 | protein_coding | deleterious(0) | probably_damaging(0.999) | TCGA-D8-A1XK-01 | Breast | breast invasive carcinoma | Female | <65 | I/II | Chemotherapy | doxorubicine+cyclophosphamide | SD | |
| GSAP | SNV | Missense_Mutation | c.424N>G | p.Leu142Val | p.L142V | A4D1B5 | protein_coding | deleterious(0.03) | probably_damaging(0.987) | TCGA-E2-A14Y-01 | Breast | breast invasive carcinoma | Female | <65 | I/II | Chemotherapy | carboplatin | SD | |
| GSAP | SNV | Missense_Mutation | rs752244308 | c.2192N>C | p.Val731Ala | p.V731A | A4D1B5 | protein_coding | tolerated(0.09) | benign(0.301) | TCGA-E2-A155-01 | Breast | breast invasive carcinoma | Female | <65 | I/II | Chemotherapy | cytoxan | SD |
| GSAP | SNV | Missense_Mutation | novel | c.1134G>A | p.Met378Ile | p.M378I | A4D1B5 | protein_coding | tolerated(0.21) | benign(0) | TCGA-EW-A1IZ-01 | Breast | breast invasive carcinoma | Female | <65 | III/IV | Chemotherapy | taxotere | SD |
| GSAP | insertion | Frame_Shift_Ins | novel | c.1856_1857insT | p.Leu619PhefsTer13 | p.L619Ffs*13 | A4D1B5 | protein_coding | TCGA-A2-A0T1-01 | Breast | breast invasive carcinoma | Female | <65 | III/IV | Targeted Molecular therapy | herceptin | SD | ||
| GSAP | insertion | Nonsense_Mutation | novel | c.967_968insTTTAATCTGTGGTCTTTAGCGTGTGGAGAGG | p.Thr323IlefsTer2 | p.T323Ifs*2 | A4D1B5 | protein_coding | TCGA-B6-A0IB-01 | Breast | breast invasive carcinoma | Female | <65 | III/IV | Unknown | Unknown | PD | ||
| GSAP | deletion | Frame_Shift_Del | novel | c.2517delN | p.Phe839LeufsTer2 | p.F839Lfs*2 | A4D1B5 | protein_coding | TCGA-D8-A27V-01 | Breast | breast invasive carcinoma | Female | <65 | I/II | Hormone Therapy | tamoxiphen | SD |
| Page: 1 2 3 4 5 6 7 8 |
Top |
Related drugs of malignant transformation related genes |
| Identification of chemicals and drugs interact with genes involved in malignant transfromation |
| (DGIdb 4.0) |
| Entrez ID | Symbol | Category | Interaction Types | Drug Claim Name | Drug Name | PMIDs |
| Page: 1 |

Copyright 2023-Present -The University of Texas Health Science Center at Houston |