
|
|||||
|
 | |
| |
| |
| |
| |
| |
|
Gene: GRWD1 |
Gene summary for GRWD1 |
| Gene information | Species | Human | Gene symbol | GRWD1 | Gene ID | 83743 |
| Gene name | glutamate rich WD repeat containing 1 | |
| Gene Alias | CDW4 | |
| Cytomap | 19q13.33 | |
| Gene Type | protein-coding | GO ID | GO:0006260 | UniProtAcc | Q9BQ67 |
Top |
Malignant transformation analysis |
| Identification of the aberrant gene expression in precancerous and cancerous lesions by comparing the gene expression of stem-like cells in diseased tissues with normal stem cells |
| Entrez ID | Symbol | Replicates | Species | Organ | Tissue | Adj P-value | Log2FC | Malignancy |
| 83743 | GRWD1 | LZE4T | Human | Esophagus | ESCC | 1.83e-05 | 1.86e-02 | 0.0811 |
| 83743 | GRWD1 | LZE7T | Human | Esophagus | ESCC | 1.61e-05 | 2.92e-01 | 0.0667 |
| 83743 | GRWD1 | LZE8T | Human | Esophagus | ESCC | 8.56e-05 | 1.73e-01 | 0.067 |
| 83743 | GRWD1 | LZE24T | Human | Esophagus | ESCC | 5.69e-09 | 1.63e-01 | 0.0596 |
| 83743 | GRWD1 | P1T-E | Human | Esophagus | ESCC | 6.80e-05 | 2.45e-01 | 0.0875 |
| 83743 | GRWD1 | P2T-E | Human | Esophagus | ESCC | 8.08e-16 | 3.03e-01 | 0.1177 |
| 83743 | GRWD1 | P4T-E | Human | Esophagus | ESCC | 6.29e-17 | 3.80e-01 | 0.1323 |
| 83743 | GRWD1 | P5T-E | Human | Esophagus | ESCC | 4.13e-14 | 2.90e-01 | 0.1327 |
| 83743 | GRWD1 | P8T-E | Human | Esophagus | ESCC | 1.77e-23 | 4.18e-01 | 0.0889 |
| 83743 | GRWD1 | P9T-E | Human | Esophagus | ESCC | 1.83e-14 | 1.36e-01 | 0.1131 |
| 83743 | GRWD1 | P10T-E | Human | Esophagus | ESCC | 1.19e-25 | 3.43e-01 | 0.116 |
| 83743 | GRWD1 | P11T-E | Human | Esophagus | ESCC | 1.23e-09 | 5.20e-01 | 0.1426 |
| 83743 | GRWD1 | P12T-E | Human | Esophagus | ESCC | 5.78e-19 | 3.27e-01 | 0.1122 |
| 83743 | GRWD1 | P15T-E | Human | Esophagus | ESCC | 3.57e-23 | 4.50e-01 | 0.1149 |
| 83743 | GRWD1 | P16T-E | Human | Esophagus | ESCC | 1.20e-17 | 2.52e-01 | 0.1153 |
| 83743 | GRWD1 | P17T-E | Human | Esophagus | ESCC | 1.35e-11 | 3.55e-01 | 0.1278 |
| 83743 | GRWD1 | P19T-E | Human | Esophagus | ESCC | 8.12e-11 | 3.37e-01 | 0.1662 |
| 83743 | GRWD1 | P20T-E | Human | Esophagus | ESCC | 1.76e-14 | 1.25e-01 | 0.1124 |
| 83743 | GRWD1 | P21T-E | Human | Esophagus | ESCC | 2.55e-17 | 2.65e-01 | 0.1617 |
| 83743 | GRWD1 | P22T-E | Human | Esophagus | ESCC | 1.26e-16 | 3.95e-01 | 0.1236 |
| Page: 1 2 3 4 5 |
| Tissue | Expression Dynamics | Abbreviation |
| Esophagus |  | ESCC: Esophageal squamous cell carcinoma |
| HGIN: High-grade intraepithelial neoplasias | ||
| LGIN: Low-grade intraepithelial neoplasias | ||
| Liver |  | HCC: Hepatocellular carcinoma |
| NAFLD: Non-alcoholic fatty liver disease | ||
| Oral Cavity |  | EOLP: Erosive Oral lichen planus |
| LP: leukoplakia | ||
| NEOLP: Non-erosive oral lichen planus | ||
| OSCC: Oral squamous cell carcinoma | ||
| Skin | 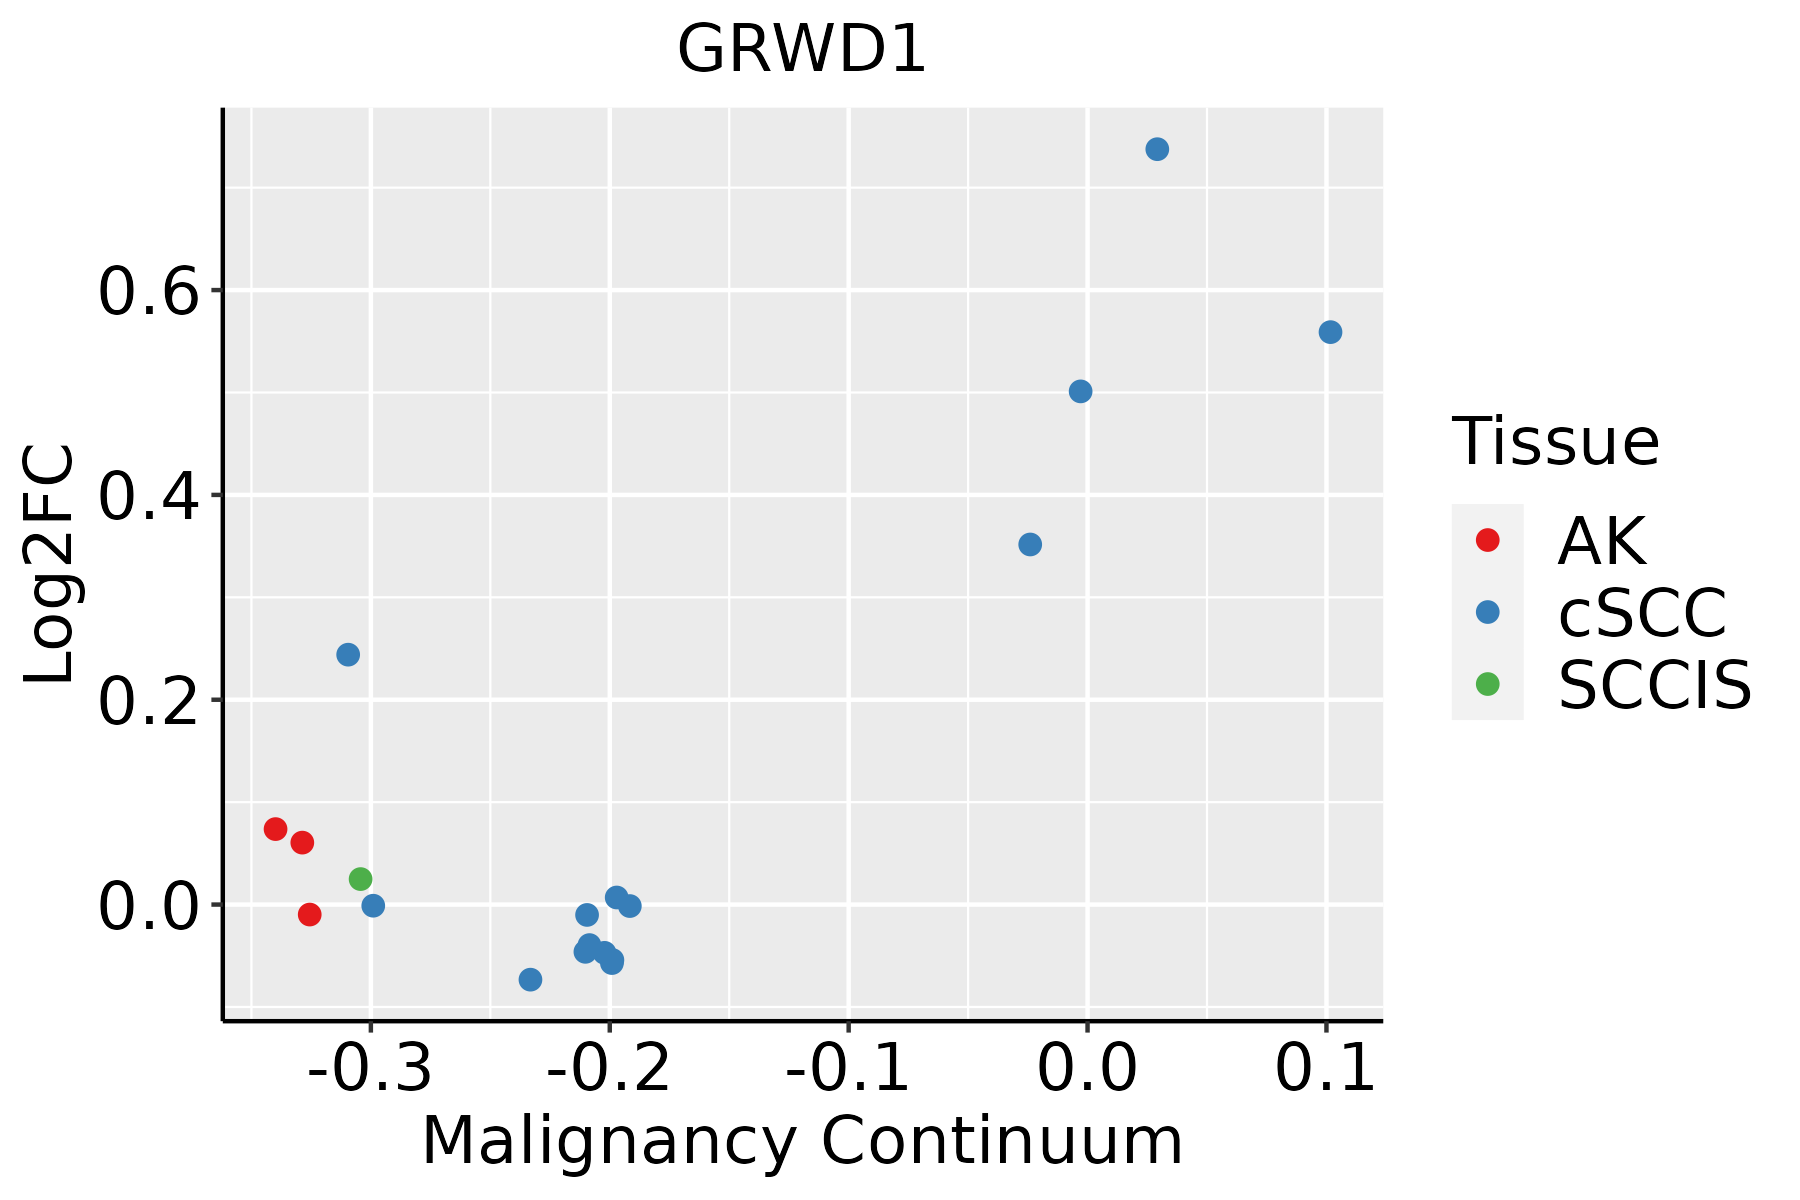 | AK: Actinic keratosis |
| cSCC: Cutaneous squamous cell carcinoma | ||
| SCCIS:squamous cell carcinoma in situ | ||
| Thyroid |  | ATC: Anaplastic thyroid cancer |
| HT: Hashimoto's thyroiditis | ||
| PTC: Papillary thyroid cancer |
| ∗log2FC in expression of this searched gene in stem-like cells from each diseased tissue sample relative to stem-like cells in normal samples in each tissue plotted against the malignancy continuum. Samples are colored based on if they are from different disease stage. |
Top |
Malignant transformation related pathway analysis |
| Find out the enriched GO biological processes and KEGG pathways involved in transition from healthy to precancer to cancer |
| Tissue | Disease Stage | Enriched GO biological Processes |
| Colorectum | AD |  |
| Colorectum | SER |  |
| Colorectum | MSS |  |
| Colorectum | MSI-H |  |
| Colorectum | FAP |  |
| ∗Top 15 enriched GO BP terms are showed in the bar plot of each disease state in each tissue. Each row represents a significant GO biological process which is colored according to the -log10(p.adjust). |
| Page: 1 2 3 4 5 6 7 8 9 |
| GO ID | Tissue | Disease Stage | Description | Gene Ratio | Bg Ratio | pvalue | p.adjust | Count |
| GO:0022411111 | Esophagus | ESCC | cellular component disassembly | 305/8552 | 443/18723 | 1.94e-23 | 4.57e-21 | 305 |
| GO:00062604 | Esophagus | ESCC | DNA replication | 181/8552 | 260/18723 | 3.55e-15 | 2.05e-13 | 181 |
| GO:003298416 | Esophagus | ESCC | protein-containing complex disassembly | 151/8552 | 224/18723 | 3.45e-11 | 1.15e-09 | 151 |
| GO:000632517 | Esophagus | ESCC | chromatin organization | 240/8552 | 409/18723 | 6.52e-08 | 1.14e-06 | 240 |
| GO:003149811 | Esophagus | ESCC | chromatin disassembly | 16/8552 | 20/18723 | 1.85e-03 | 8.40e-03 | 16 |
| GO:003298616 | Esophagus | ESCC | protein-DNA complex disassembly | 16/8552 | 20/18723 | 1.85e-03 | 8.40e-03 | 16 |
| GO:000633713 | Esophagus | ESCC | nucleosome disassembly | 14/8552 | 18/18723 | 5.77e-03 | 2.14e-02 | 14 |
| GO:002241112 | Liver | HCC | cellular component disassembly | 282/7958 | 443/18723 | 1.02e-19 | 1.38e-17 | 282 |
| GO:003298411 | Liver | HCC | protein-containing complex disassembly | 138/7958 | 224/18723 | 5.59e-09 | 1.46e-07 | 138 |
| GO:00062601 | Liver | HCC | DNA replication | 146/7958 | 260/18723 | 5.68e-06 | 7.02e-05 | 146 |
| GO:000632511 | Liver | HCC | chromatin organization | 206/7958 | 409/18723 | 7.23e-04 | 4.41e-03 | 206 |
| GO:003298611 | Liver | HCC | protein-DNA complex disassembly | 15/7958 | 20/18723 | 3.31e-03 | 1.51e-02 | 15 |
| GO:000633711 | Liver | HCC | nucleosome disassembly | 13/7958 | 18/18723 | 1.05e-02 | 3.89e-02 | 13 |
| GO:00314983 | Liver | HCC | chromatin disassembly | 14/7958 | 20/18723 | 1.21e-02 | 4.41e-02 | 14 |
| GO:002241119 | Oral cavity | OSCC | cellular component disassembly | 283/7305 | 443/18723 | 9.57e-27 | 3.37e-24 | 283 |
| GO:00062603 | Oral cavity | OSCC | DNA replication | 159/7305 | 260/18723 | 3.25e-13 | 1.59e-11 | 159 |
| GO:003298410 | Oral cavity | OSCC | protein-containing complex disassembly | 136/7305 | 224/18723 | 3.42e-11 | 1.13e-09 | 136 |
| GO:000632510 | Oral cavity | OSCC | chromatin organization | 190/7305 | 409/18723 | 1.17e-03 | 5.97e-03 | 190 |
| GO:00329868 | Oral cavity | OSCC | protein-DNA complex disassembly | 15/7305 | 20/18723 | 1.19e-03 | 5.99e-03 | 15 |
| GO:00063375 | Oral cavity | OSCC | nucleosome disassembly | 13/7305 | 18/18723 | 4.45e-03 | 1.79e-02 | 13 |
| Page: 1 2 3 |
| Pathway ID | Tissue | Disease Stage | Description | Gene Ratio | Bg Ratio | pvalue | p.adjust | qvalue | Count |
| Page: 1 |
Top |
Cell-cell communication analysis |
| Identification of potential cell-cell interactions between two cell types and their ligand-receptor pairs for different disease states |
| Ligand | Receptor | LRpair | Pathway | Tissue | Disease Stage |
| Page: 1 |
Top |
Single-cell gene regulatory network inference analysis |
| Find out the significant the regulons (TFs) and the target genes of each regulon across cell types for different disease states |
| TF | Cell Type | Tissue | Disease Stage | Target Gene | RSS | Regulon Activity |
| ∗The dot plots of a searched regulon are shown for all cell subpopulations in each disease state of each tissue based on the regulon specific score inferred using pySCENIC and by calculating the average expression. |
| Page: 1 |
Top |
Somatic mutation of malignant transformation related genes |
| Annotation of somatic variants for genes involved in malignant transformation |
| Hugo Symbol | Variant Class | Variant Classification | dbSNP RS | HGVSc | HGVSp | HGVSp Short | SWISSPROT | BIOTYPE | SIFT | PolyPhen | Tumor Sample Barcode | Tissue | Histology | Sex | Age | Stage | Therapy Types | Drugs | Outcome |
| GRWD1 | SNV | Missense_Mutation | novel | c.989G>A | p.Gly330Glu | p.G330E | Q9BQ67 | protein_coding | deleterious(0) | probably_damaging(0.999) | TCGA-OL-A66N-01 | Breast | breast invasive carcinoma | Female | <65 | III/IV | Unknown | Unknown | SD |
| GRWD1 | insertion | Frame_Shift_Ins | novel | c.245_246insTTTGCATATAT | p.Glu82AspfsTer26 | p.E82Dfs*26 | Q9BQ67 | protein_coding | TCGA-A2-A0CP-01 | Breast | breast invasive carcinoma | Female | <65 | I/II | Chemotherapy | cytoxan | SD | ||
| GRWD1 | SNV | Missense_Mutation | c.1047N>G | p.Phe349Leu | p.F349L | Q9BQ67 | protein_coding | deleterious(0.05) | probably_damaging(0.951) | TCGA-DG-A2KM-01 | Cervix | cervical & endocervical cancer | Female | <65 | I/II | Chemotherapy | cisplatin | SD | |
| GRWD1 | SNV | Missense_Mutation | novel | c.874C>T | p.Arg292Trp | p.R292W | Q9BQ67 | protein_coding | deleterious(0) | probably_damaging(0.999) | TCGA-5M-AAT6-01 | Colorectum | colon adenocarcinoma | Female | <65 | III/IV | Unknown | Unknown | PD |
| GRWD1 | SNV | Missense_Mutation | c.145N>G | p.Met49Val | p.M49V | Q9BQ67 | protein_coding | tolerated(0.57) | benign(0.101) | TCGA-AA-3713-01 | Colorectum | colon adenocarcinoma | Male | >=65 | III/IV | Chemotherapy | 5-fluorouracil | PR | |
| GRWD1 | SNV | Missense_Mutation | novel | c.1031C>T | p.Ser344Phe | p.S344F | Q9BQ67 | protein_coding | deleterious(0.01) | possibly_damaging(0.738) | TCGA-A5-A2K5-01 | Endometrium | uterine corpus endometrioid carcinoma | Female | >=65 | I/II | Unknown | Unknown | SD |
| GRWD1 | SNV | Missense_Mutation | c.997N>G | p.Lys333Glu | p.K333E | Q9BQ67 | protein_coding | tolerated(0.08) | possibly_damaging(0.877) | TCGA-AP-A0LG-01 | Endometrium | uterine corpus endometrioid carcinoma | Female | <65 | I/II | Unknown | Unknown | SD | |
| GRWD1 | SNV | Missense_Mutation | c.1013G>A | p.Arg338Gln | p.R338Q | Q9BQ67 | protein_coding | deleterious(0) | probably_damaging(0.992) | TCGA-AP-A0LM-01 | Endometrium | uterine corpus endometrioid carcinoma | Female | <65 | III/IV | Chemotherapy | cisplatin | SD | |
| GRWD1 | SNV | Missense_Mutation | rs755256324 | c.1115C>T | p.Ser372Leu | p.S372L | Q9BQ67 | protein_coding | deleterious(0.02) | possibly_damaging(0.903) | TCGA-AP-A0LM-01 | Endometrium | uterine corpus endometrioid carcinoma | Female | <65 | III/IV | Chemotherapy | cisplatin | SD |
| GRWD1 | SNV | Missense_Mutation | c.375A>C | p.Glu125Asp | p.E125D | Q9BQ67 | protein_coding | tolerated(1) | benign(0) | TCGA-B5-A11E-01 | Endometrium | uterine corpus endometrioid carcinoma | Female | <65 | I/II | Unknown | Unknown | SD |
| Page: 1 2 3 |
Top |
Related drugs of malignant transformation related genes |
| Identification of chemicals and drugs interact with genes involved in malignant transfromation |
| (DGIdb 4.0) |
| Entrez ID | Symbol | Category | Interaction Types | Drug Claim Name | Drug Name | PMIDs |
| Page: 1 |

Copyright 2023-Present -The University of Texas Health Science Center at Houston |