
|
|||||
|
 | |
| |
| |
| |
| |
| |
|
Gene: GRTP1 |
Gene summary for GRTP1 |
| Gene information | Species | Human | Gene symbol | GRTP1 | Gene ID | 79774 |
| Gene name | growth hormone regulated TBC protein 1 | |
| Gene Alias | TBC1D6 | |
| Cytomap | 13q34 | |
| Gene Type | protein-coding | GO ID | GO:0006810 | UniProtAcc | Q5TC63 |
Top |
Malignant transformation analysis |
| Identification of the aberrant gene expression in precancerous and cancerous lesions by comparing the gene expression of stem-like cells in diseased tissues with normal stem cells |
| Entrez ID | Symbol | Replicates | Species | Organ | Tissue | Adj P-value | Log2FC | Malignancy |
| 79774 | GRTP1 | CA_HPV_3 | Human | Cervix | CC | 2.78e-02 | 9.58e-02 | 0.0414 |
| 79774 | GRTP1 | CCI_2 | Human | Cervix | CC | 1.85e-09 | 6.76e-01 | 0.5249 |
| 79774 | GRTP1 | HTA11_347_2000001011 | Human | Colorectum | AD | 4.92e-09 | 5.62e-01 | -0.1954 |
| 79774 | GRTP1 | HTA11_696_2000001011 | Human | Colorectum | AD | 7.34e-05 | 4.42e-01 | -0.1464 |
| 79774 | GRTP1 | HTA11_99999965104_69814 | Human | Colorectum | MSS | 2.91e-03 | 5.16e-01 | 0.281 |
| 79774 | GRTP1 | F007 | Human | Colorectum | FAP | 1.45e-02 | -2.14e-01 | 0.1176 |
| 79774 | GRTP1 | A015-C-203 | Human | Colorectum | FAP | 3.06e-15 | -2.22e-01 | -0.1294 |
| 79774 | GRTP1 | A015-C-204 | Human | Colorectum | FAP | 1.91e-07 | -3.20e-01 | -0.0228 |
| 79774 | GRTP1 | A002-C-201 | Human | Colorectum | FAP | 1.29e-06 | -1.90e-01 | 0.0324 |
| 79774 | GRTP1 | A001-C-119 | Human | Colorectum | FAP | 8.83e-05 | -2.96e-01 | -0.1557 |
| 79774 | GRTP1 | A001-C-108 | Human | Colorectum | FAP | 6.94e-08 | -1.51e-01 | -0.0272 |
| 79774 | GRTP1 | A002-C-205 | Human | Colorectum | FAP | 5.65e-15 | -2.84e-01 | -0.1236 |
| 79774 | GRTP1 | A015-C-005 | Human | Colorectum | FAP | 5.00e-04 | -2.44e-01 | -0.0336 |
| 79774 | GRTP1 | A015-C-006 | Human | Colorectum | FAP | 2.41e-07 | -1.95e-01 | -0.0994 |
| 79774 | GRTP1 | A015-C-106 | Human | Colorectum | FAP | 4.05e-07 | -2.19e-01 | -0.0511 |
| 79774 | GRTP1 | A002-C-114 | Human | Colorectum | FAP | 7.86e-11 | -2.04e-01 | -0.1561 |
| 79774 | GRTP1 | A015-C-104 | Human | Colorectum | FAP | 2.89e-19 | -3.01e-01 | -0.1899 |
| 79774 | GRTP1 | A001-C-014 | Human | Colorectum | FAP | 1.90e-08 | -1.76e-01 | 0.0135 |
| 79774 | GRTP1 | A002-C-016 | Human | Colorectum | FAP | 1.15e-08 | -2.35e-01 | 0.0521 |
| 79774 | GRTP1 | A015-C-002 | Human | Colorectum | FAP | 4.98e-09 | -3.66e-01 | -0.0763 |
| Page: 1 2 3 4 5 6 |
| Tissue | Expression Dynamics | Abbreviation |
| Cervix | 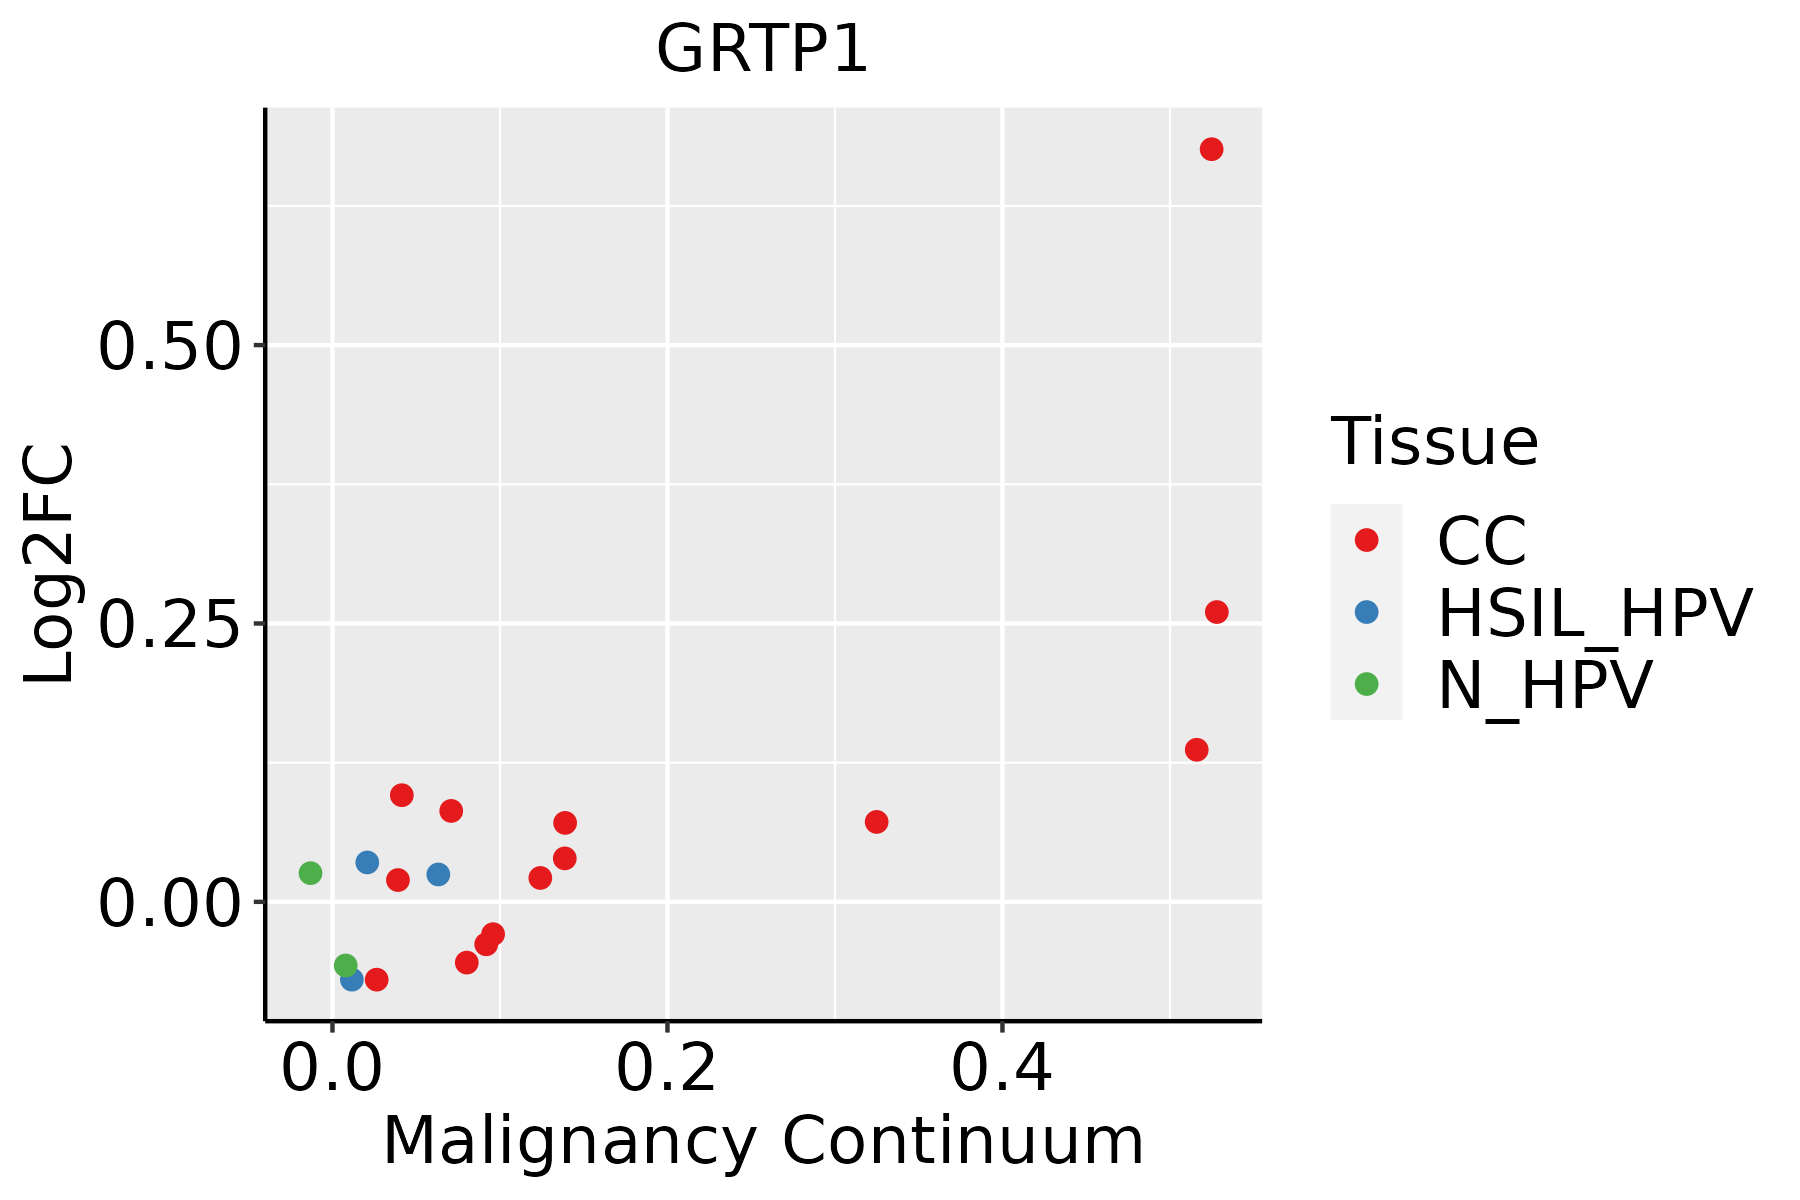 | CC: Cervix cancer |
| HSIL_HPV: HPV-infected high-grade squamous intraepithelial lesions | ||
| N_HPV: HPV-infected normal cervix | ||
| Colorectum (GSE201348) | 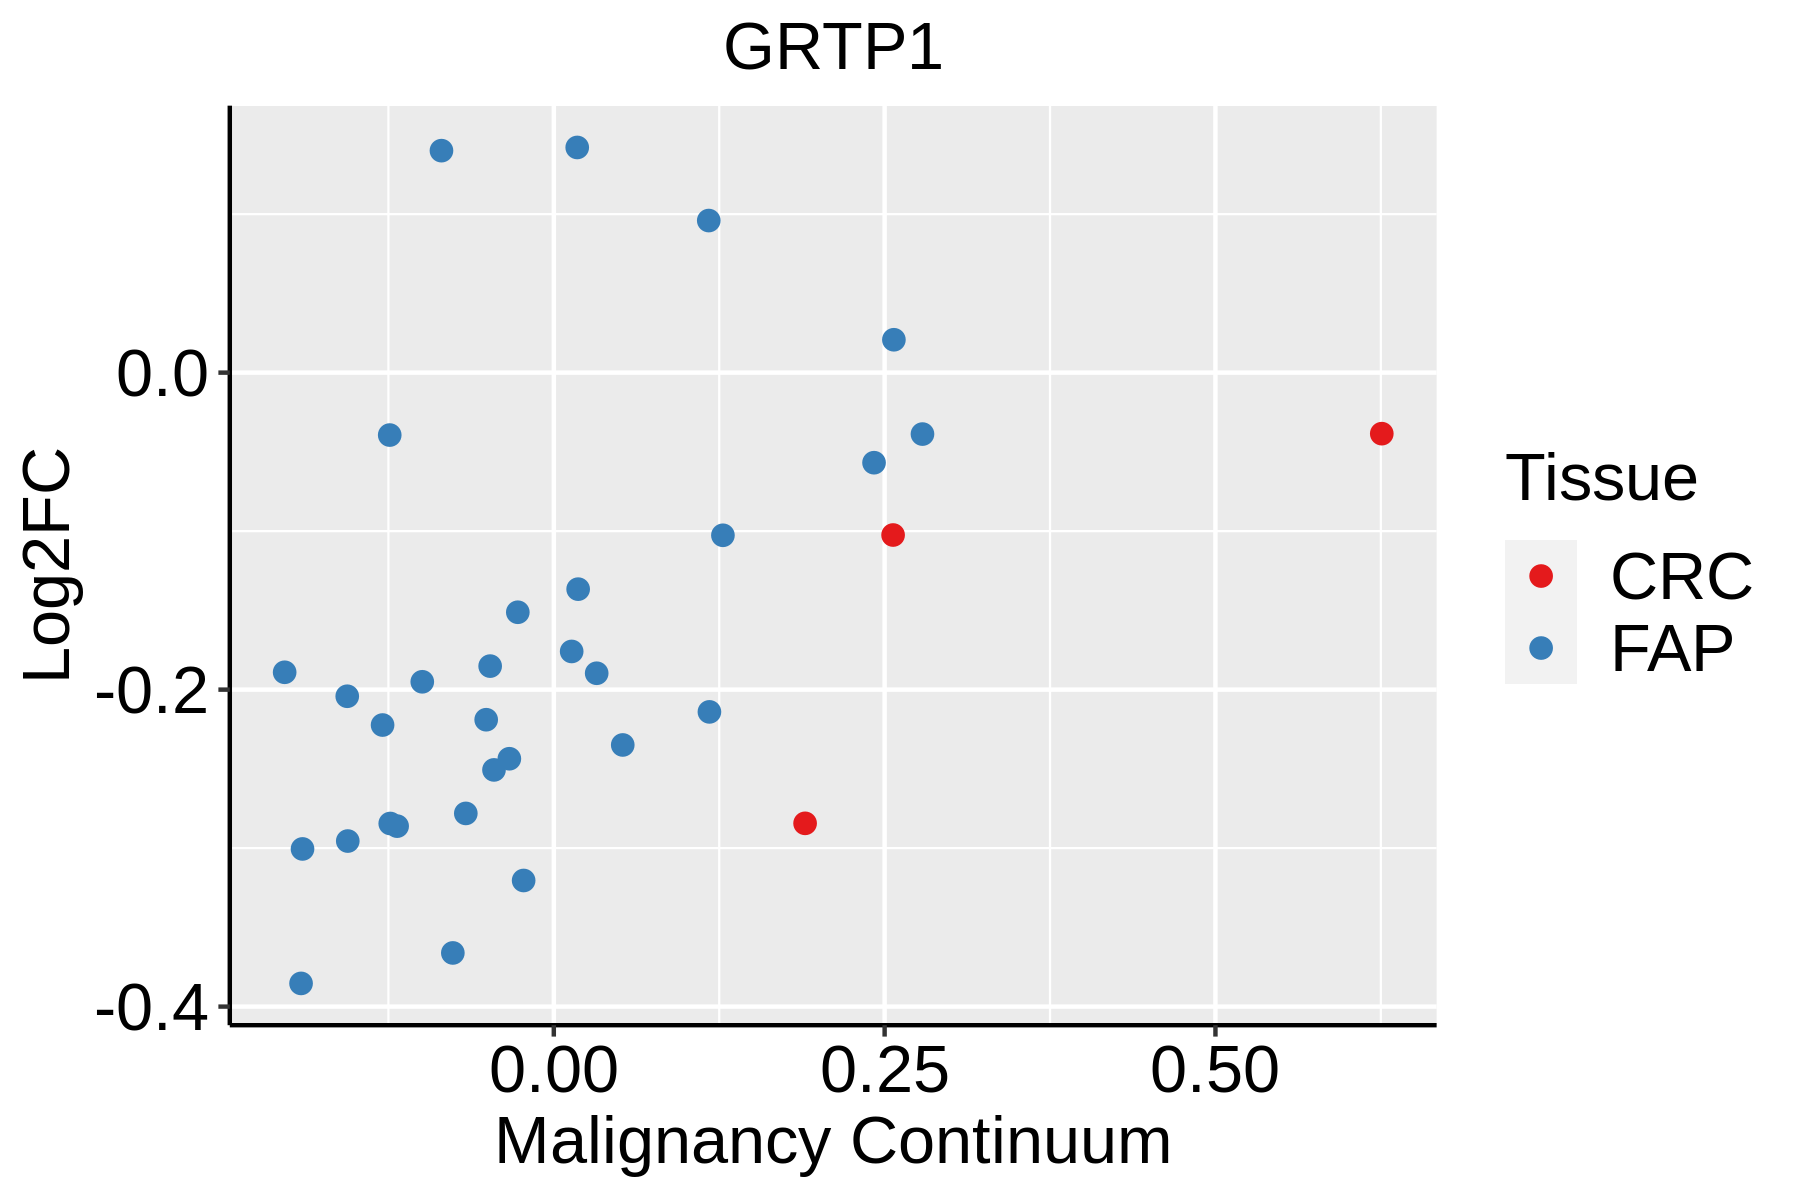 | FAP: Familial adenomatous polyposis |
| CRC: Colorectal cancer | ||
| Colorectum (HTA11) |  | AD: Adenomas |
| SER: Sessile serrated lesions | ||
| MSI-H: Microsatellite-high colorectal cancer | ||
| MSS: Microsatellite stable colorectal cancer | ||
| Esophagus |  | ESCC: Esophageal squamous cell carcinoma |
| HGIN: High-grade intraepithelial neoplasias | ||
| LGIN: Low-grade intraepithelial neoplasias | ||
| Liver | 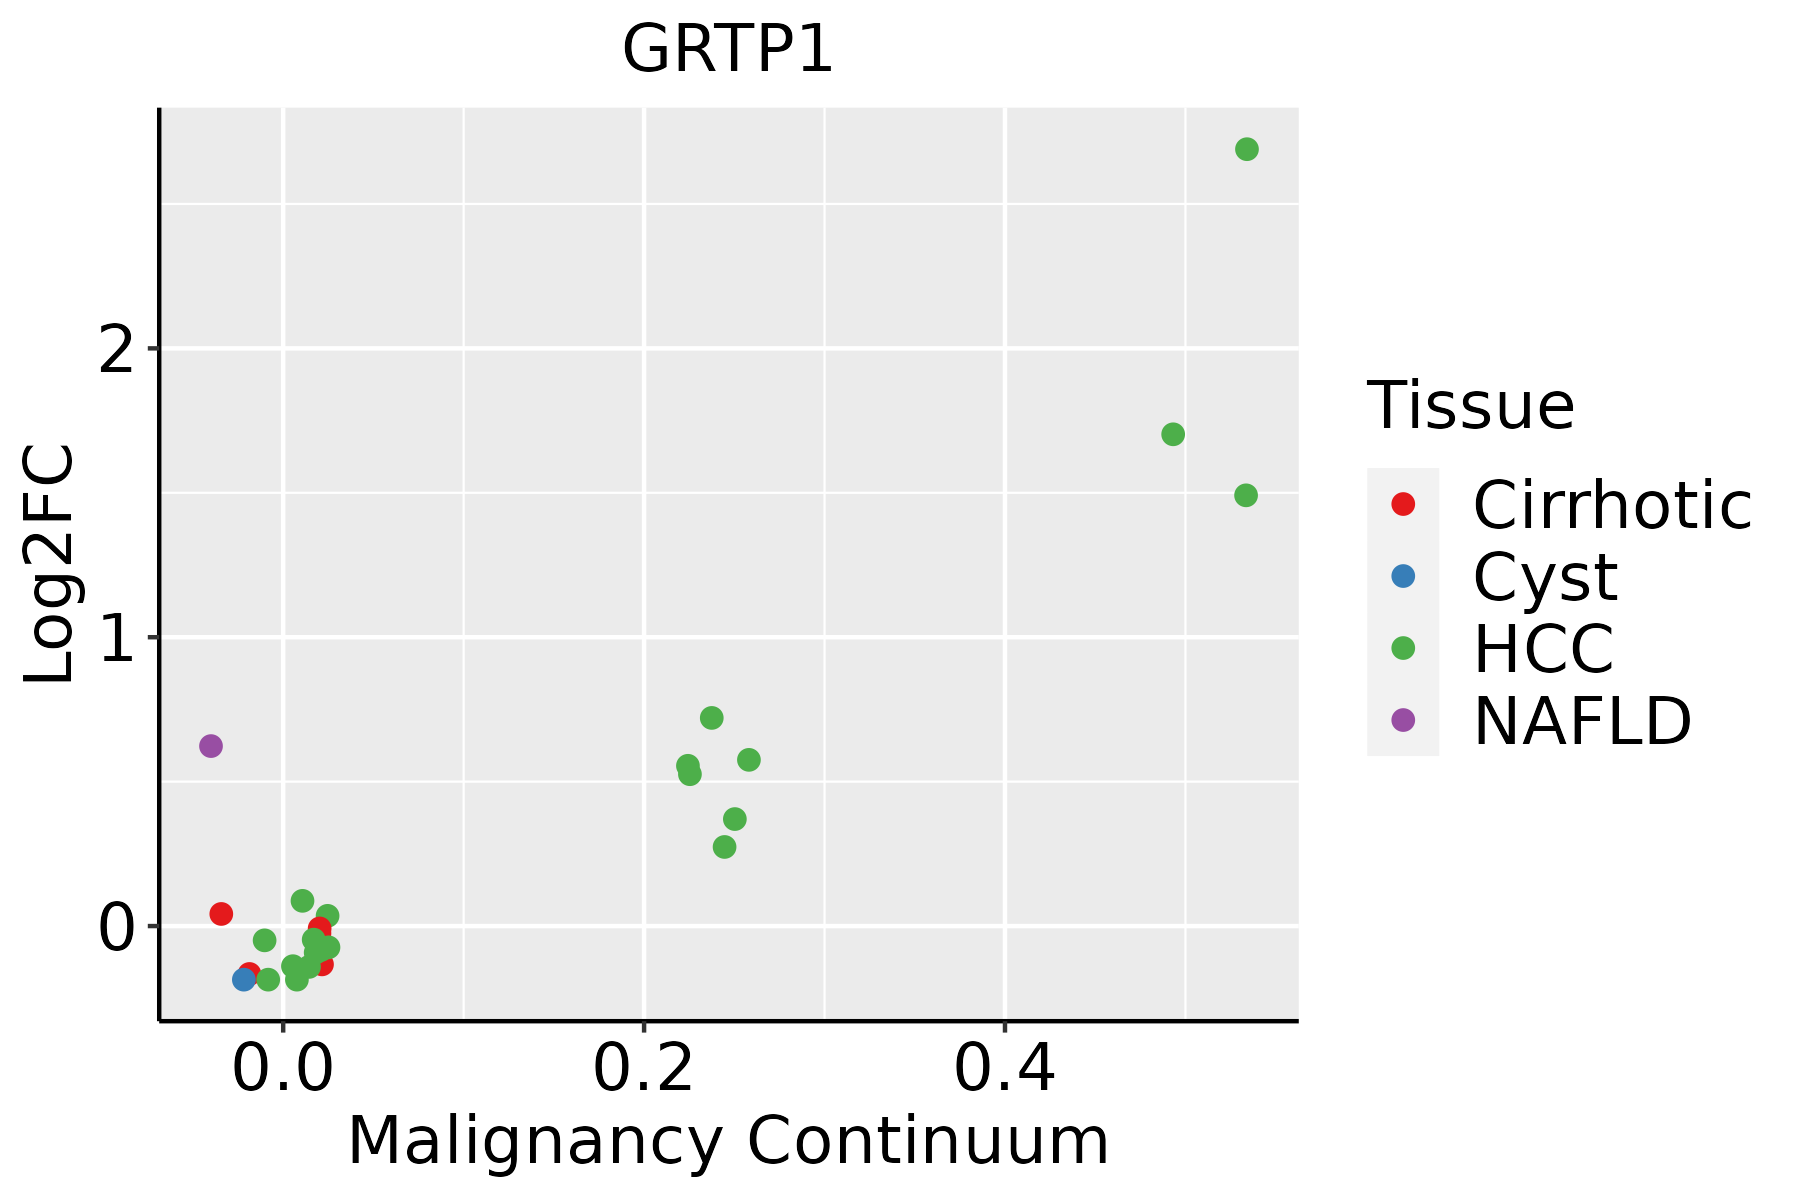 | HCC: Hepatocellular carcinoma |
| NAFLD: Non-alcoholic fatty liver disease | ||
| Oral Cavity | 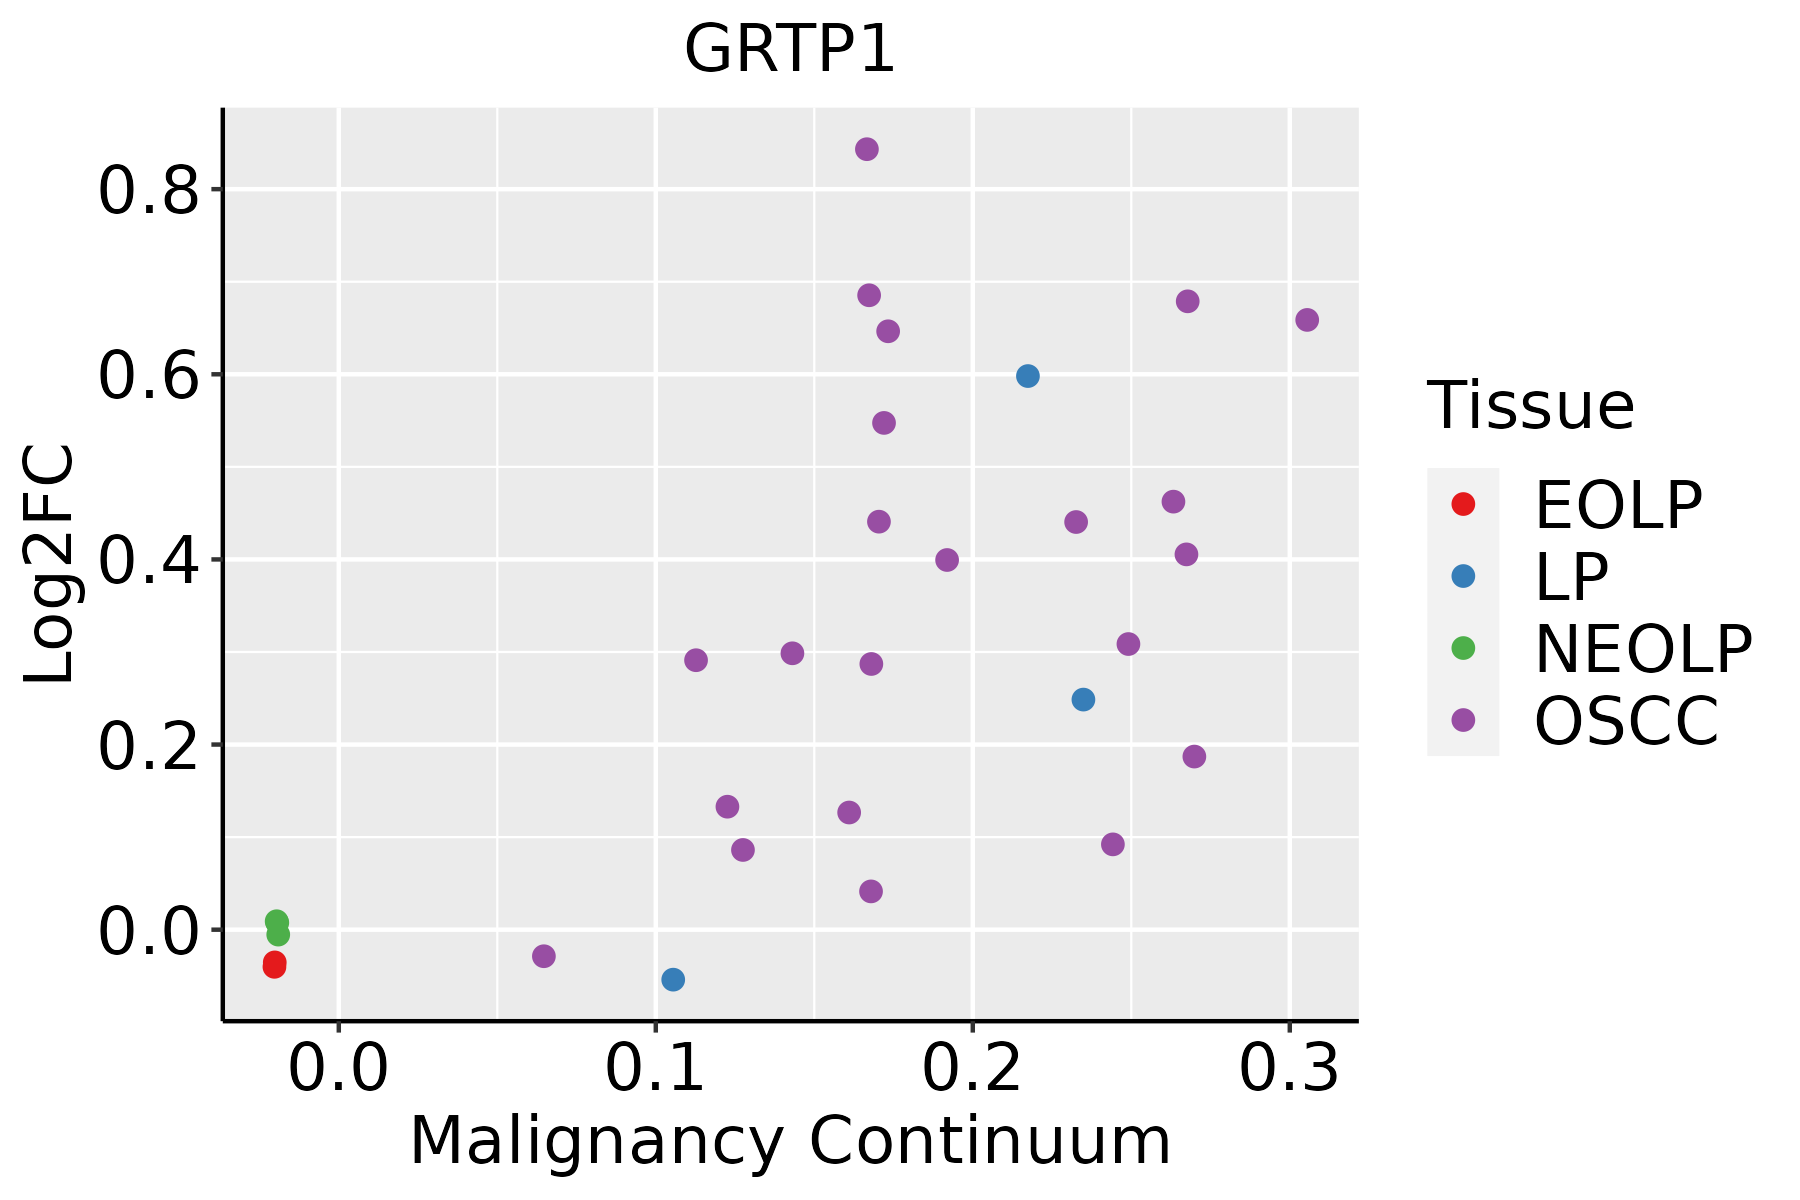 | EOLP: Erosive Oral lichen planus |
| LP: leukoplakia | ||
| NEOLP: Non-erosive oral lichen planus | ||
| OSCC: Oral squamous cell carcinoma |
| ∗log2FC in expression of this searched gene in stem-like cells from each diseased tissue sample relative to stem-like cells in normal samples in each tissue plotted against the malignancy continuum. Samples are colored based on if they are from different disease stage. |
Top |
Malignant transformation related pathway analysis |
| Find out the enriched GO biological processes and KEGG pathways involved in transition from healthy to precancer to cancer |
| Tissue | Disease Stage | Enriched GO biological Processes |
| Colorectum | AD |  |
| Colorectum | SER |  |
| Colorectum | MSS |  |
| Colorectum | MSI-H |  |
| Colorectum | FAP |  |
| ∗Top 15 enriched GO BP terms are showed in the bar plot of each disease state in each tissue. Each row represents a significant GO biological process which is colored according to the -log10(p.adjust). |
| Page: 1 2 3 4 5 6 7 8 9 |
| GO ID | Tissue | Disease Stage | Description | Gene Ratio | Bg Ratio | pvalue | p.adjust | Count |
| GO:00430877 | Cervix | CC | regulation of GTPase activity | 79/2311 | 348/18723 | 4.21e-08 | 2.60e-06 | 79 |
| GO:00435476 | Cervix | CC | positive regulation of GTPase activity | 53/2311 | 255/18723 | 8.72e-05 | 1.16e-03 | 53 |
| GO:0043087 | Colorectum | AD | regulation of GTPase activity | 110/3918 | 348/18723 | 1.64e-06 | 5.03e-05 | 110 |
| GO:0043547 | Colorectum | AD | positive regulation of GTPase activity | 75/3918 | 255/18723 | 7.95e-04 | 7.91e-03 | 75 |
| GO:00430872 | Colorectum | MSS | regulation of GTPase activity | 101/3467 | 348/18723 | 1.00e-06 | 3.46e-05 | 101 |
| GO:00435471 | Colorectum | MSS | positive regulation of GTPase activity | 68/3467 | 255/18723 | 7.97e-04 | 8.38e-03 | 68 |
| GO:00430873 | Colorectum | FAP | regulation of GTPase activity | 85/2622 | 348/18723 | 1.20e-07 | 7.68e-06 | 85 |
| GO:00435472 | Colorectum | FAP | positive regulation of GTPase activity | 61/2622 | 255/18723 | 1.39e-05 | 3.73e-04 | 61 |
| GO:0090630 | Colorectum | FAP | activation of GTPase activity | 27/2622 | 115/18723 | 4.23e-03 | 2.90e-02 | 27 |
| GO:00430874 | Colorectum | CRC | regulation of GTPase activity | 69/2078 | 348/18723 | 1.11e-06 | 6.69e-05 | 69 |
| GO:00435473 | Colorectum | CRC | positive regulation of GTPase activity | 49/2078 | 255/18723 | 8.67e-05 | 1.77e-03 | 49 |
| GO:004308715 | Esophagus | ESCC | regulation of GTPase activity | 183/8552 | 348/18723 | 5.34e-03 | 2.00e-02 | 183 |
| GO:00430875 | Liver | NAFLD | regulation of GTPase activity | 62/1882 | 348/18723 | 5.65e-06 | 2.03e-04 | 62 |
| GO:00435474 | Liver | NAFLD | positive regulation of GTPase activity | 45/1882 | 255/18723 | 1.30e-04 | 2.47e-03 | 45 |
| GO:00906301 | Liver | NAFLD | activation of GTPase activity | 22/1882 | 115/18723 | 2.28e-03 | 2.19e-02 | 22 |
| GO:004308710 | Oral cavity | OSCC | regulation of GTPase activity | 165/7305 | 348/18723 | 7.94e-04 | 4.27e-03 | 165 |
| Page: 1 |
| Pathway ID | Tissue | Disease Stage | Description | Gene Ratio | Bg Ratio | pvalue | p.adjust | qvalue | Count |
| Page: 1 |
Top |
Cell-cell communication analysis |
| Identification of potential cell-cell interactions between two cell types and their ligand-receptor pairs for different disease states |
| Ligand | Receptor | LRpair | Pathway | Tissue | Disease Stage |
| Page: 1 |
Top |
Single-cell gene regulatory network inference analysis |
| Find out the significant the regulons (TFs) and the target genes of each regulon across cell types for different disease states |
| TF | Cell Type | Tissue | Disease Stage | Target Gene | RSS | Regulon Activity |
| ∗The dot plots of a searched regulon are shown for all cell subpopulations in each disease state of each tissue based on the regulon specific score inferred using pySCENIC and by calculating the average expression. |
| Page: 1 |
Top |
Somatic mutation of malignant transformation related genes |
| Annotation of somatic variants for genes involved in malignant transformation |
| Hugo Symbol | Variant Class | Variant Classification | dbSNP RS | HGVSc | HGVSp | HGVSp Short | SWISSPROT | BIOTYPE | SIFT | PolyPhen | Tumor Sample Barcode | Tissue | Histology | Sex | Age | Stage | Therapy Types | Drugs | Outcome |
| GRTP1 | SNV | Missense_Mutation | c.251C>A | p.Ala84Asp | p.A84D | Q5TC63 | protein_coding | deleterious(0) | probably_damaging(0.996) | TCGA-A8-A06X-01 | Breast | breast invasive carcinoma | Female | >=65 | I/II | Unknown | Unknown | SD | |
| GRTP1 | SNV | Missense_Mutation | rs376648575 | c.196C>T | p.Arg66Trp | p.R66W | Q5TC63 | protein_coding | deleterious(0) | probably_damaging(1) | TCGA-BH-A0HA-01 | Breast | breast invasive carcinoma | Female | <65 | I/II | Unknown | Unknown | SD |
| GRTP1 | SNV | Missense_Mutation | novel | c.229G>A | p.Val77Ile | p.V77I | Q5TC63 | protein_coding | tolerated(0.24) | possibly_damaging(0.678) | TCGA-2W-A8YY-01 | Cervix | cervical & endocervical cancer | Female | <65 | I/II | Chemotherapy | cisplatin | CR |
| GRTP1 | SNV | Missense_Mutation | novel | c.46G>A | p.Gly16Arg | p.G16R | Q5TC63 | protein_coding | deleterious(0) | probably_damaging(0.992) | TCGA-2W-A8YY-01 | Cervix | cervical & endocervical cancer | Female | <65 | I/II | Chemotherapy | cisplatin | CR |
| GRTP1 | SNV | Missense_Mutation | c.931N>A | p.Ala311Thr | p.A311T | Q5TC63 | protein_coding | tolerated(0.55) | benign(0.003) | TCGA-CK-4951-01 | Colorectum | colon adenocarcinoma | Female | >=65 | I/II | Unknown | Unknown | PD | |
| GRTP1 | SNV | Missense_Mutation | c.163G>A | p.Val55Ile | p.V55I | Q5TC63 | protein_coding | tolerated(0.24) | benign(0.014) | TCGA-G4-6628-01 | Colorectum | colon adenocarcinoma | Male | >=65 | I/II | Unknown | Unknown | SD | |
| GRTP1 | deletion | Frame_Shift_Del | rs36033481 | c.961delN | p.Ala321ProfsTer102 | p.A321Pfs*102 | Q5TC63 | protein_coding | TCGA-D5-6930-01 | Colorectum | colon adenocarcinoma | Male | >=65 | I/II | Unknown | Unknown | SD | ||
| GRTP1 | SNV | Missense_Mutation | novel | c.269N>C | p.Gln90Pro | p.Q90P | Q5TC63 | protein_coding | deleterious(0.04) | possibly_damaging(0.53) | TCGA-AJ-A3EK-01 | Endometrium | uterine corpus endometrioid carcinoma | Female | <65 | I/II | Chemotherapy | carboplatin | CR |
| GRTP1 | SNV | Missense_Mutation | rs147117267 | c.661N>T | p.Arg221Cys | p.R221C | Q5TC63 | protein_coding | deleterious(0.05) | possibly_damaging(0.86) | TCGA-AX-A0J1-01 | Endometrium | uterine corpus endometrioid carcinoma | Female | >=65 | I/II | Unknown | Unknown | SD |
| GRTP1 | SNV | Missense_Mutation | novel | c.262N>G | p.Met88Val | p.M88V | Q5TC63 | protein_coding | deleterious(0.05) | possibly_damaging(0.506) | TCGA-AX-A2HJ-01 | Endometrium | uterine corpus endometrioid carcinoma | Female | <65 | I/II | Unknown | Unknown | SD |
| Page: 1 2 3 4 |
Top |
Related drugs of malignant transformation related genes |
| Identification of chemicals and drugs interact with genes involved in malignant transfromation |
| (DGIdb 4.0) |
| Entrez ID | Symbol | Category | Interaction Types | Drug Claim Name | Drug Name | PMIDs |
| Page: 1 |

Copyright 2023-Present -The University of Texas Health Science Center at Houston |