Schematic overview of the cellular and molecular mechanisms involved in the cancer progression, including the proposed cellular and molecular mechanisms in cancer cells trajectory. AT1: alveolar type 1 cells; AT2: alveolar type 2 cells; AAH: atypical adenomatous hyperplasia; AIS: adenocarcinoma in situ; MIA: minimally invasive adenocarcinoma; IA: invasive adenocarcinoma; EMT: epithelial-mesenchymal transition

Home

Download

Statistics

Help

Contact

Center for Computational Systems Medicine
leaf

Gene summary

leaf

Malignant transformation analysis

leaf

Malignant transformation related pathway analysis

leaf

Cell-cell communication analysis

leaf

Single-cell gene regulatory network inference analysis

leaf

Somatic mutation of malignant transformation related genes

leaf

Related drugs of malignant transformation related genes

Gene: GRPEL1

Gene summary for GRPEL1

check button Gene summary.

Gene informationSpeciesHuman
Gene symbol

GRPEL1

Gene ID

80273

Gene nameGrpE like 1, mitochondrial
Gene AliasGrpE
Cytomap4p16.1
Gene Typeprotein-coding
GO ID

GO:0006457

UniProtAcc

Q9HAV7


Top

Malignant transformation analysis

check button Identification of the aberrant gene expression in precancerous and cancerous lesions by comparing the gene expression of stem-like cells in diseased tissues with normal stem cells
check button Malignant transformation involving gene list.
Entrez IDSymbolReplicatesSpeciesOrganTissueAdj P-valueLog2FCMalignancy
80273GRPEL1LZE2THumanEsophagusESCC6.30e-034.78e-010.082
80273GRPEL1LZE4THumanEsophagusESCC8.40e-07-7.02e-020.0811
80273GRPEL1LZE5THumanEsophagusESCC1.86e-02-5.23e-020.0514
80273GRPEL1LZE24THumanEsophagusESCC5.97e-062.54e-010.0596
80273GRPEL1P2T-EHumanEsophagusESCC6.88e-194.99e-010.1177
80273GRPEL1P4T-EHumanEsophagusESCC1.06e-116.04e-010.1323
80273GRPEL1P5T-EHumanEsophagusESCC3.59e-216.10e-010.1327
80273GRPEL1P8T-EHumanEsophagusESCC1.42e-162.59e-010.0889
80273GRPEL1P9T-EHumanEsophagusESCC3.27e-062.97e-010.1131
80273GRPEL1P10T-EHumanEsophagusESCC2.06e-236.91e-020.116
80273GRPEL1P11T-EHumanEsophagusESCC3.77e-078.58e-010.1426
80273GRPEL1P12T-EHumanEsophagusESCC2.12e-203.86e-010.1122
80273GRPEL1P15T-EHumanEsophagusESCC5.14e-051.72e-010.1149
80273GRPEL1P16T-EHumanEsophagusESCC2.15e-144.23e-010.1153
80273GRPEL1P17T-EHumanEsophagusESCC1.07e-086.66e-010.1278
80273GRPEL1P20T-EHumanEsophagusESCC1.83e-112.74e-010.1124
80273GRPEL1P21T-EHumanEsophagusESCC2.84e-164.48e-010.1617
80273GRPEL1P22T-EHumanEsophagusESCC4.10e-111.90e-010.1236
80273GRPEL1P23T-EHumanEsophagusESCC1.34e-197.49e-010.108
80273GRPEL1P24T-EHumanEsophagusESCC3.21e-123.21e-010.1287
Page: 1 2 3 4 5 6 

check button Transcriptomic changes along malignancy continuum.
TissueExpression DynamicsAbbreviation
EsophagusThe image shows the transcriptomic changes along malignancy continuum.log2FC in expression of this searched gene in stem-like cells from each diseased tissue sample relative to stem-like cells in normal samples in each tissue plotted against the malignancy continuum. Samples are colored based on if they are from different disease stage.
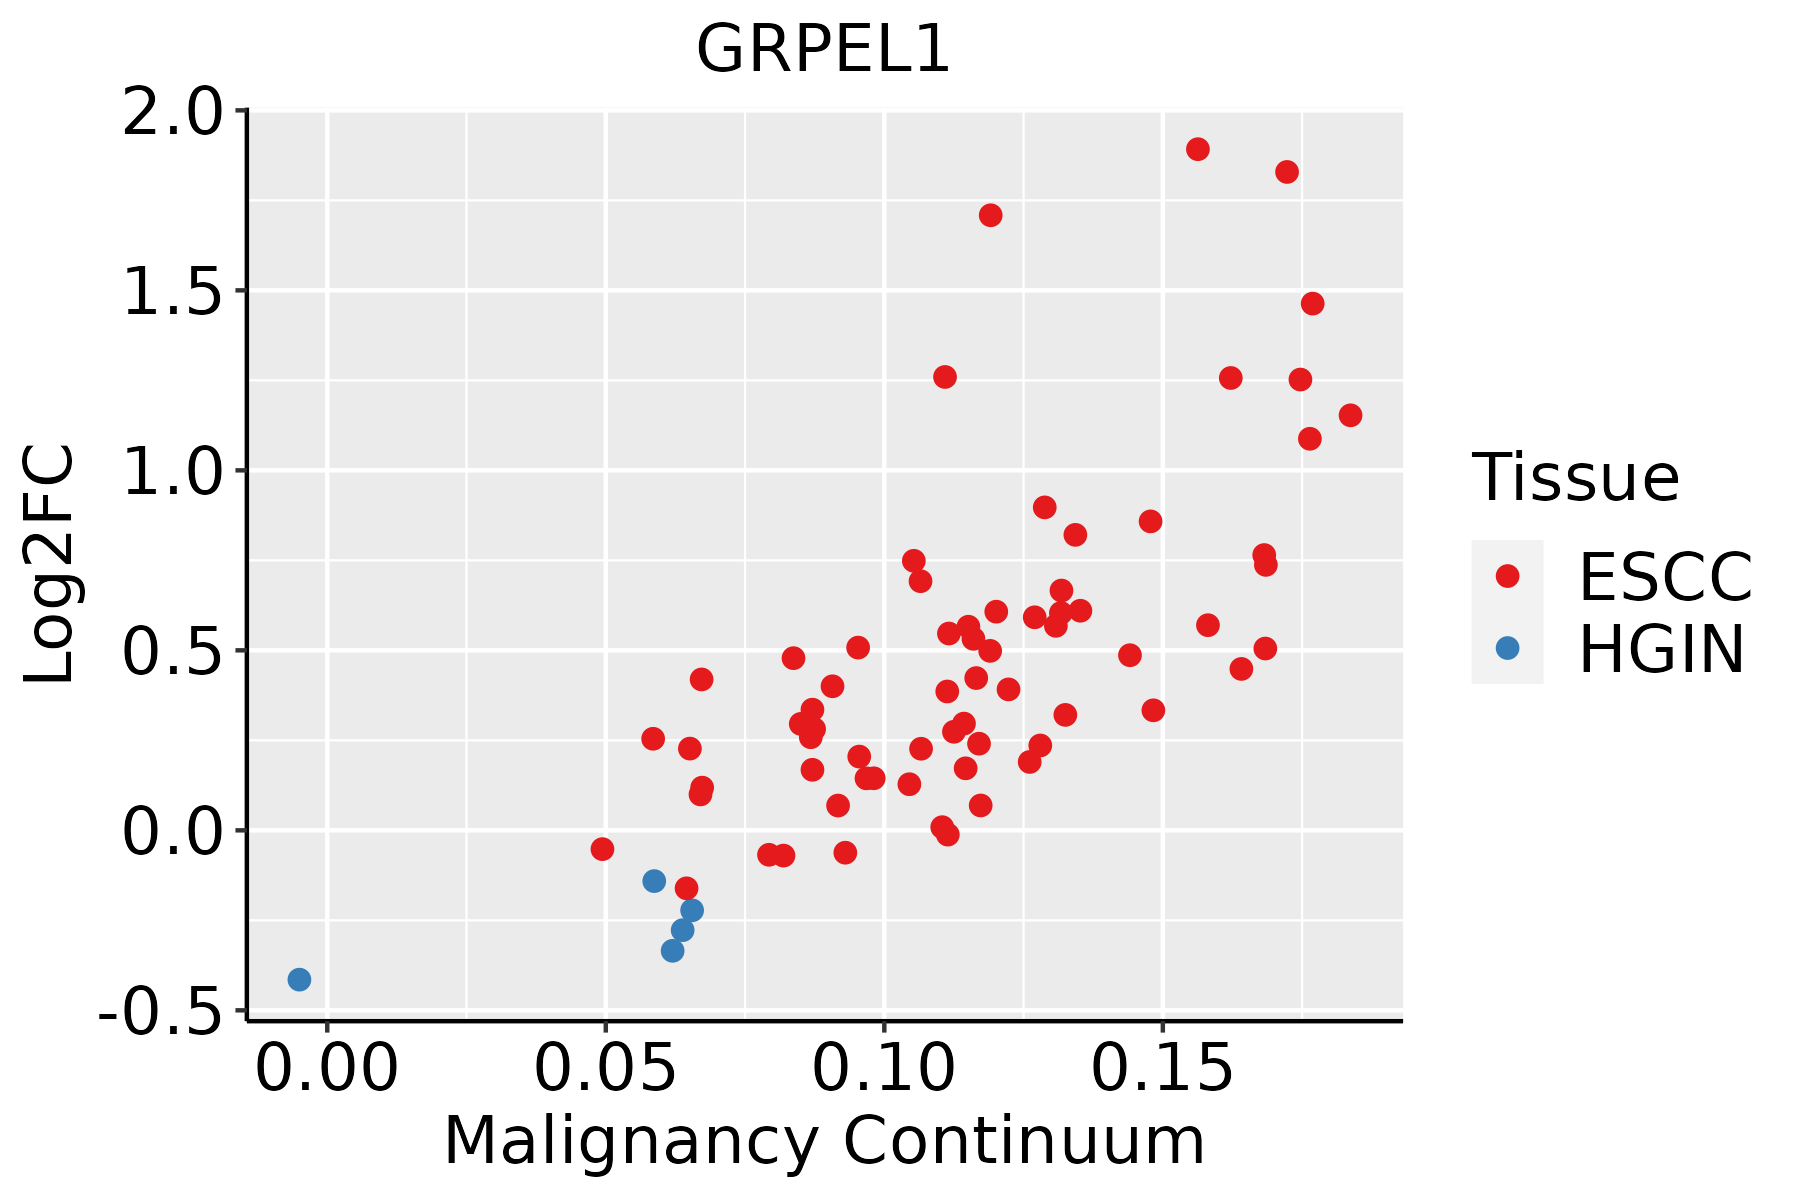
ESCC: Esophageal squamous cell carcinoma
HGIN: High-grade intraepithelial neoplasias
LGIN: Low-grade intraepithelial neoplasias
LiverThe image shows the transcriptomic changes along malignancy continuum.log2FC in expression of this searched gene in stem-like cells from each diseased tissue sample relative to stem-like cells in normal samples in each tissue plotted against the malignancy continuum. Samples are colored based on if they are from different disease stage.
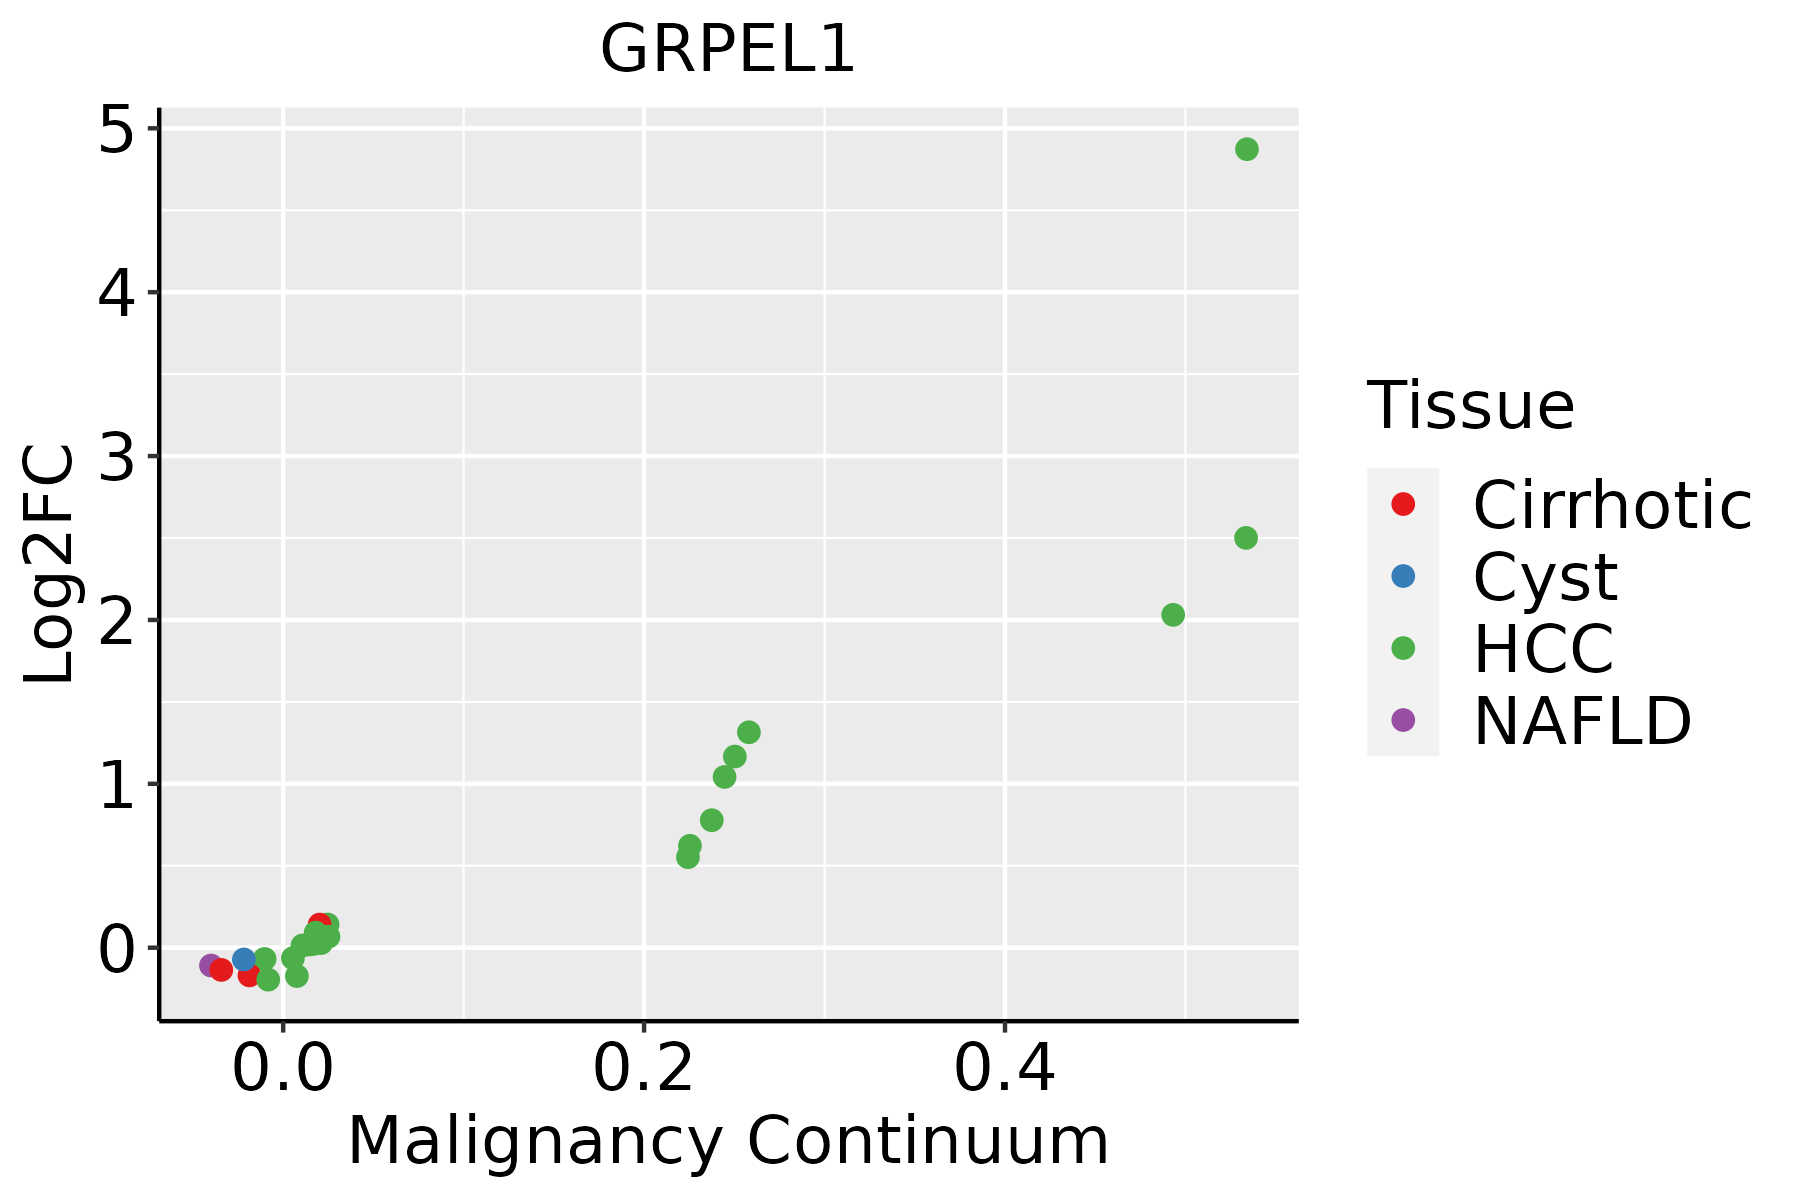
HCC: Hepatocellular carcinoma
NAFLD: Non-alcoholic fatty liver disease
Oral CavityThe image shows the transcriptomic changes along malignancy continuum.log2FC in expression of this searched gene in stem-like cells from each diseased tissue sample relative to stem-like cells in normal samples in each tissue plotted against the malignancy continuum. Samples are colored based on if they are from different disease stage.
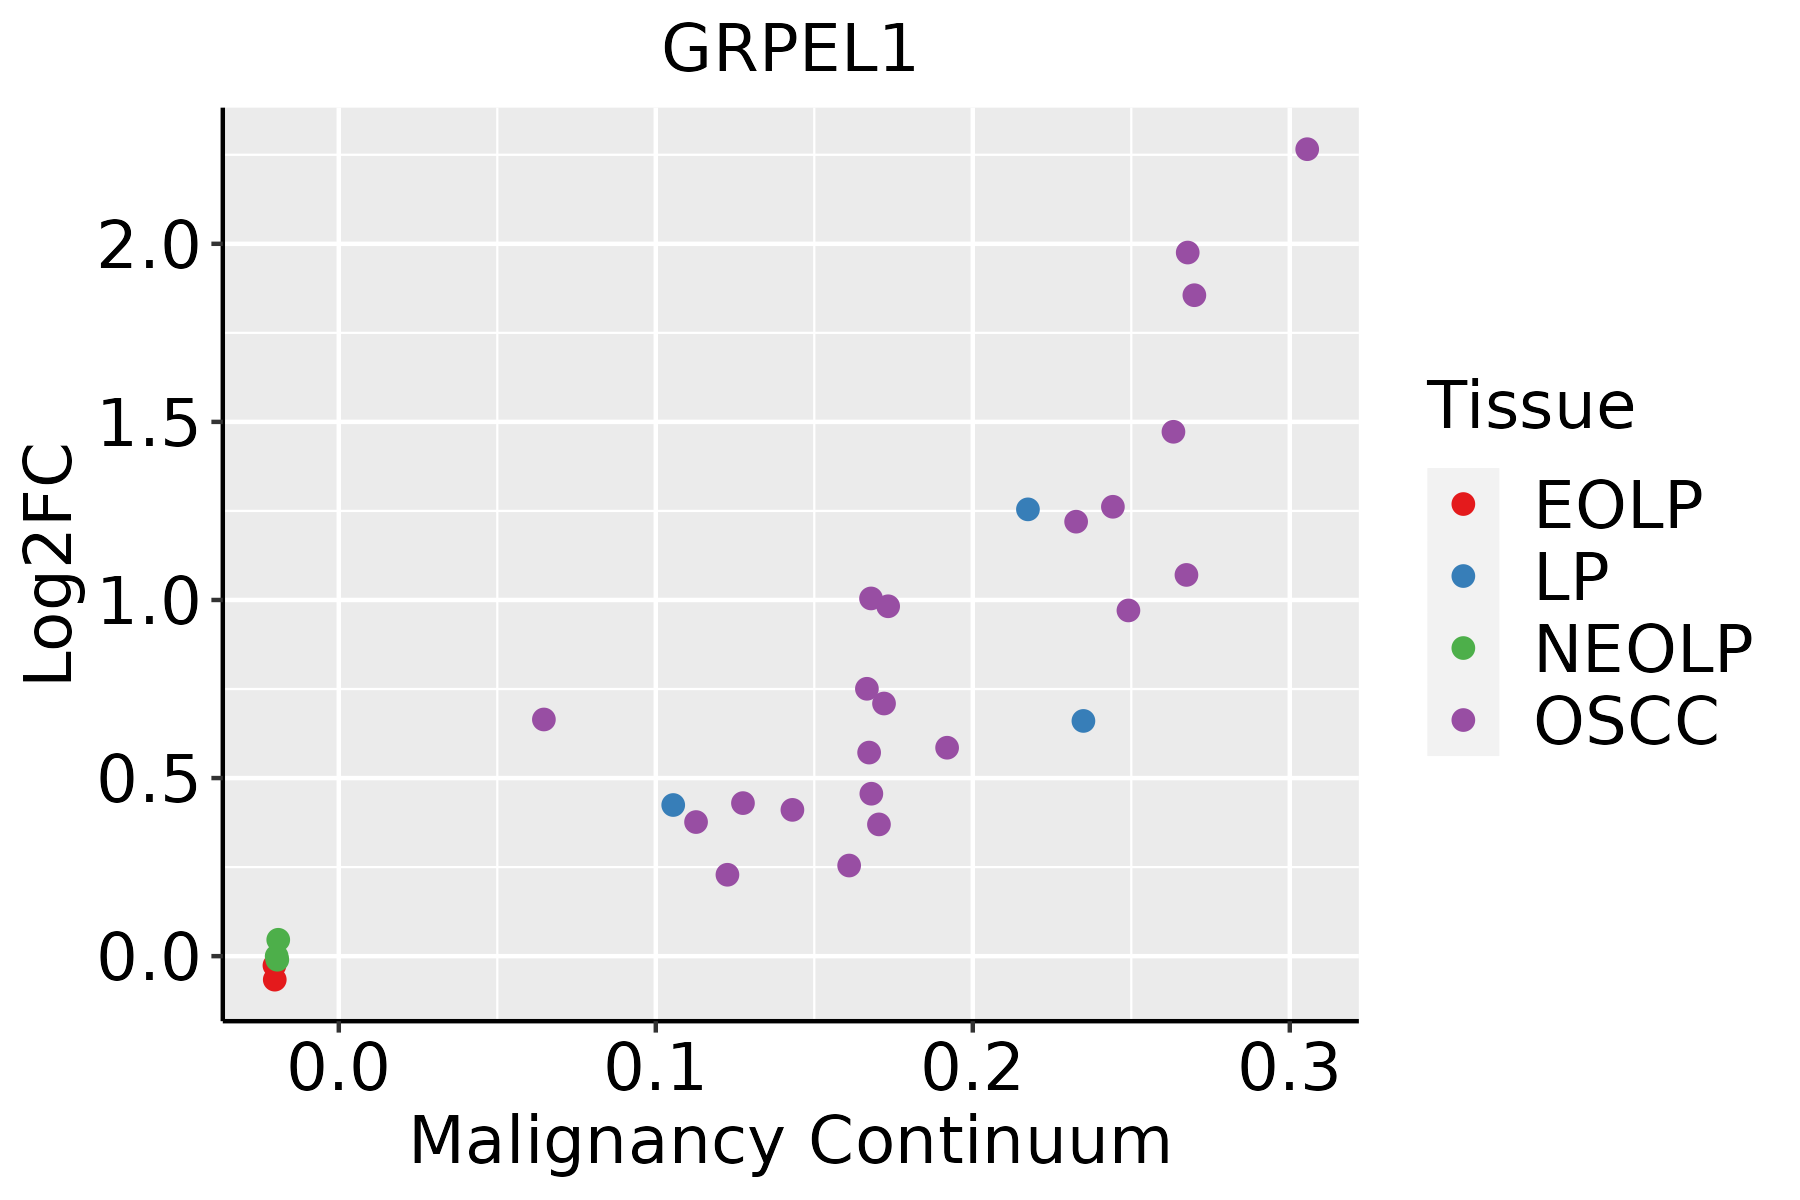
EOLP: Erosive Oral lichen planus
LP: leukoplakia
NEOLP: Non-erosive oral lichen planus
OSCC: Oral squamous cell carcinoma
ProstateThe image shows the transcriptomic changes along malignancy continuum.log2FC in expression of this searched gene in stem-like cells from each diseased tissue sample relative to stem-like cells in normal samples in each tissue plotted against the malignancy continuum. Samples are colored based on if they are from different disease stage.BPH: Benign Prostatic Hyperplasia
SkinThe image shows the transcriptomic changes along malignancy continuum.log2FC in expression of this searched gene in stem-like cells from each diseased tissue sample relative to stem-like cells in normal samples in each tissue plotted against the malignancy continuum. Samples are colored based on if they are from different disease stage.AK: Actinic keratosis
cSCC: Cutaneous squamous cell carcinoma
SCCIS:squamous cell carcinoma in situ
∗log2FC in expression of this searched gene in stem-like cells from each diseased tissue sample relative to stem-like cells in normal samples in each tissue plotted against the malignancy continuum. Samples are colored based on if they are from different disease stage.

Top

Malignant transformation related pathway analysis

check buttonFind out the enriched GO biological processes and KEGG pathways involved in transition from healthy to precancer to cancer
check button Figure of enriched GO biological processes.
TissueDisease StageEnriched GO biological Processes
ColorectumADGO analysis - Figure of enriched GO biological processes: Top 15 enriched GO BP terms are showed in the bar plot of each disease state in each tissue. Each row represents a significant GO biological process which is colored according to the -log10(p.adjust).
ColorectumSERGO analysis - Figure of enriched GO biological processes: Top 15 enriched GO BP terms are showed in the bar plot of each disease state in each tissue. Each row represents a significant GO biological process which is colored according to the -log10(p.adjust).
ColorectumMSSGO analysis - Figure of enriched GO biological processes: Top 15 enriched GO BP terms are showed in the bar plot of each disease state in each tissue. Each row represents a significant GO biological process which is colored according to the -log10(p.adjust).
ColorectumMSI-HGO analysis - Figure of enriched GO biological processes: Top 15 enriched GO BP terms are showed in the bar plot of each disease state in each tissue. Each row represents a significant GO biological process which is colored according to the -log10(p.adjust).
ColorectumFAPGO analysis - Figure of enriched GO biological processes: Top 15 enriched GO BP terms are showed in the bar plot of each disease state in each tissue. Each row represents a significant GO biological process which is colored according to the -log10(p.adjust).
∗Top 15 enriched GO BP terms are showed in the bar plot of each disease state in each tissue. Each row represents a significant GO biological process which is colored according to the -log10(p.adjust).
Page: 1 2 3 4 5 6 7 8 9 

check button Enriched GO biological processes.
GO IDTissueDisease StageDescriptionGene RatioBg Ratiopvaluep.adjustCount
GO:0072594110EsophagusESCCestablishment of protein localization to organelle311/8552422/187233.02e-322.13e-29311
GO:0006605111EsophagusESCCprotein targeting229/8552314/187234.93e-231.01e-20229
GO:0006457110EsophagusESCCprotein folding163/8552212/187231.13e-201.74e-18163
GO:0006839110EsophagusESCCmitochondrial transport187/8552254/187238.35e-209.81e-18187
GO:0072655110EsophagusESCCestablishment of protein localization to mitochondrion97/8552120/187232.17e-151.33e-1397
GO:0070585110EsophagusESCCprotein localization to mitochondrion100/8552125/187232.96e-151.77e-13100
GO:001703818EsophagusESCCprotein import149/8552206/187235.90e-153.31e-13149
GO:0006626110EsophagusESCCprotein targeting to mitochondrion81/8552100/187233.60e-131.67e-1181
GO:00718069EsophagusESCCprotein transmembrane transport47/855259/187239.02e-081.51e-0647
GO:1990542110EsophagusESCCmitochondrial transmembrane transport72/8552102/187232.94e-074.23e-0672
GO:00650026EsophagusESCCintracellular protein transmembrane transport40/855251/187231.76e-062.08e-0540
GO:00447433EsophagusESCCprotein transmembrane import into intracellular organelle29/855236/187231.91e-051.67e-0429
GO:00301503EsophagusESCCprotein import into mitochondrial matrix16/855220/187231.85e-038.40e-0316
GO:00064577LiverCirrhoticprotein folding114/4634212/187239.23e-202.31e-17114
GO:007259412LiverCirrhoticestablishment of protein localization to organelle189/4634422/187231.01e-192.45e-17189
GO:00066057LiverCirrhoticprotein targeting148/4634314/187233.86e-186.20e-16148
GO:00068397LiverCirrhoticmitochondrial transport112/4634254/187231.03e-116.66e-10112
GO:00705857LiverCirrhoticprotein localization to mitochondrion65/4634125/187234.91e-112.77e-0965
GO:00726557LiverCirrhoticestablishment of protein localization to mitochondrion63/4634120/187235.70e-113.19e-0963
GO:00066267LiverCirrhoticprotein targeting to mitochondrion53/4634100/187231.19e-095.27e-0853
Page: 1 2 3 4 5 

check button Enriched KEGG pathways.
Pathway IDTissueDisease StageDescriptionGene RatioBg Ratiopvaluep.adjustqvalueCount
Page: 1 

Top

Cell-cell communication analysis

check buttonIdentification of potential cell-cell interactions between two cell types and their ligand-receptor pairs for different disease states
LigandReceptorLRpairPathwayTissueDisease Stage
Page: 1 

Top

Single-cell gene regulatory network inference analysis

check buttonFind out the significant the regulons (TFs) and the target genes of each regulon across cell types for different disease states
TFCell TypeTissueDisease StageTarget GeneRSSRegulon Activity
∗The dot plots of a searched regulon are shown for all cell subpopulations in each disease state of each tissue based on the regulon specific score inferred using pySCENIC and by calculating the average expression.
Page: 1 

Top

Somatic mutation of malignant transformation related genes

check buttonAnnotation of somatic variants for genes involved in malignant transformation
Hugo SymbolVariant ClassVariant ClassificationdbSNP RSHGVScHGVSpHGVSp ShortSWISSPROTBIOTYPESIFTPolyPhenTumor Sample BarcodeTissueHistologySexAgeStageTherapy TypesDrugsOutcome
GRPEL1SNVMissense_Mutationrs370293338c.511N>Ap.Asp171Asnp.D171NQ9HAV7protein_codingtolerated(0.16)benign(0.123)TCGA-C8-A8HR-01Breastbreast invasive carcinomaFemale<65III/IVChemotherapy5-fluorouracilCR
GRPEL1insertionIn_Frame_Insnovelc.374_375insCCTCTCATGGAGATCCTTGCCGCTGAGGCAAGCATGp.Val125_Pro126insLeuSerTrpArgSerLeuProLeuArgGlnAlaCysp.V125_P126insLSWRSLPLRQACQ9HAV7protein_codingTCGA-A2-A0D1-01Breastbreast invasive carcinomaFemale>=65I/IIChemotherapytaxotereSD
GRPEL1insertionNonsense_Mutationnovelc.226_227insTGCATATTTACAGTAGGAATTAAAGATTTGTTTAGCTACCp.Glu76ValfsTer8p.E76Vfs*8Q9HAV7protein_codingTCGA-A2-A0D1-01Breastbreast invasive carcinomaFemale>=65I/IIChemotherapytaxotereSD
GRPEL1SNVMissense_Mutationrs766058514c.610C>Tp.Arg204Cysp.R204CQ9HAV7protein_codingdeleterious(0.01)probably_damaging(0.996)TCGA-AA-3821-01Colorectumcolon adenocarcinomaFemale>=65I/IIUnknownUnknownSD
GRPEL1SNVMissense_Mutationc.92C>Tp.Thr31Metp.T31MQ9HAV7protein_codingdeleterious(0.02)possibly_damaging(0.569)TCGA-F4-6856-01Colorectumcolon adenocarcinomaMale<65I/IIAncillaryleucovorinCR
GRPEL1SNVMissense_Mutationc.580N>Tp.Val194Phep.V194FQ9HAV7protein_codingdeleterious(0)probably_damaging(0.998)TCGA-G4-6588-01Colorectumcolon adenocarcinomaFemale<65I/IIUnknownUnknownSD
GRPEL1SNVMissense_Mutationnovelc.608G>Ap.Gly203Glup.G203EQ9HAV7protein_codingtolerated(0.26)benign(0.163)TCGA-A5-A0G2-01Endometriumuterine corpus endometrioid carcinomaFemale<65III/IVUnknownUnknownSD
GRPEL1SNVMissense_Mutationnovelc.328G>Ap.Asp110Asnp.D110NQ9HAV7protein_codingdeleterious(0)probably_damaging(0.999)TCGA-A5-A0G2-01Endometriumuterine corpus endometrioid carcinomaFemale<65III/IVUnknownUnknownSD
GRPEL1SNVMissense_Mutationnovelc.608G>Tp.Gly203Valp.G203VQ9HAV7protein_codingdeleterious(0)probably_damaging(0.972)TCGA-AP-A051-01Endometriumuterine corpus endometrioid carcinomaFemale>=65I/IIUnknownUnknownSD
GRPEL1SNVMissense_Mutationc.132N>Tp.Met44Ilep.M44IQ9HAV7protein_codingtolerated(0.19)benign(0)TCGA-AP-A0LD-01Endometriumuterine corpus endometrioid carcinomaFemale<65I/IIUnknownUnknownSD
Page: 1 2 

Top

Related drugs of malignant transformation related genes

check buttonIdentification of chemicals and drugs interact with genes involved in malignant transfromation
(DGIdb 4.0)
Entrez IDSymbolCategoryInteraction TypesDrug Claim NameDrug NamePMIDs
Page: 1