
|
|||||
|
 | |
| |
| |
| |
| |
| |
|
Gene: GRK6 |
Gene summary for GRK6 |
| Gene information | Species | Human | Gene symbol | GRK6 | Gene ID | 2870 |
| Gene name | G protein-coupled receptor kinase 6 | |
| Gene Alias | GPRK6 | |
| Cytomap | 5q35.3 | |
| Gene Type | protein-coding | GO ID | GO:0006464 | UniProtAcc | P43250 |
Top |
Malignant transformation analysis |
| Identification of the aberrant gene expression in precancerous and cancerous lesions by comparing the gene expression of stem-like cells in diseased tissues with normal stem cells |
| Entrez ID | Symbol | Replicates | Species | Organ | Tissue | Adj P-value | Log2FC | Malignancy |
| 2870 | GRK6 | LZE24T | Human | Esophagus | ESCC | 1.86e-09 | 1.57e-01 | 0.0596 |
| 2870 | GRK6 | P1T-E | Human | Esophagus | ESCC | 3.38e-09 | 4.12e-01 | 0.0875 |
| 2870 | GRK6 | P2T-E | Human | Esophagus | ESCC | 3.06e-17 | 3.06e-01 | 0.1177 |
| 2870 | GRK6 | P4T-E | Human | Esophagus | ESCC | 3.44e-10 | 2.38e-01 | 0.1323 |
| 2870 | GRK6 | P5T-E | Human | Esophagus | ESCC | 6.79e-16 | 3.93e-01 | 0.1327 |
| 2870 | GRK6 | P8T-E | Human | Esophagus | ESCC | 7.81e-12 | 5.97e-02 | 0.0889 |
| 2870 | GRK6 | P10T-E | Human | Esophagus | ESCC | 1.69e-03 | 3.52e-02 | 0.116 |
| 2870 | GRK6 | P11T-E | Human | Esophagus | ESCC | 6.56e-04 | 1.73e-01 | 0.1426 |
| 2870 | GRK6 | P12T-E | Human | Esophagus | ESCC | 3.12e-07 | 1.74e-01 | 0.1122 |
| 2870 | GRK6 | P15T-E | Human | Esophagus | ESCC | 1.52e-02 | 9.38e-02 | 0.1149 |
| 2870 | GRK6 | P16T-E | Human | Esophagus | ESCC | 2.04e-09 | 1.05e-01 | 0.1153 |
| 2870 | GRK6 | P17T-E | Human | Esophagus | ESCC | 6.10e-05 | 2.03e-01 | 0.1278 |
| 2870 | GRK6 | P20T-E | Human | Esophagus | ESCC | 1.11e-04 | 6.64e-02 | 0.1124 |
| 2870 | GRK6 | P21T-E | Human | Esophagus | ESCC | 2.02e-09 | 1.93e-01 | 0.1617 |
| 2870 | GRK6 | P22T-E | Human | Esophagus | ESCC | 5.52e-12 | 2.90e-01 | 0.1236 |
| 2870 | GRK6 | P23T-E | Human | Esophagus | ESCC | 2.22e-15 | 3.47e-01 | 0.108 |
| 2870 | GRK6 | P24T-E | Human | Esophagus | ESCC | 4.90e-10 | 3.00e-01 | 0.1287 |
| 2870 | GRK6 | P26T-E | Human | Esophagus | ESCC | 6.46e-09 | 1.44e-01 | 0.1276 |
| 2870 | GRK6 | P27T-E | Human | Esophagus | ESCC | 2.79e-07 | 1.59e-01 | 0.1055 |
| 2870 | GRK6 | P28T-E | Human | Esophagus | ESCC | 4.70e-16 | 3.23e-01 | 0.1149 |
| Page: 1 2 3 4 |
| Tissue | Expression Dynamics | Abbreviation |
| Esophagus |  | ESCC: Esophageal squamous cell carcinoma |
| HGIN: High-grade intraepithelial neoplasias | ||
| LGIN: Low-grade intraepithelial neoplasias | ||
| Liver | 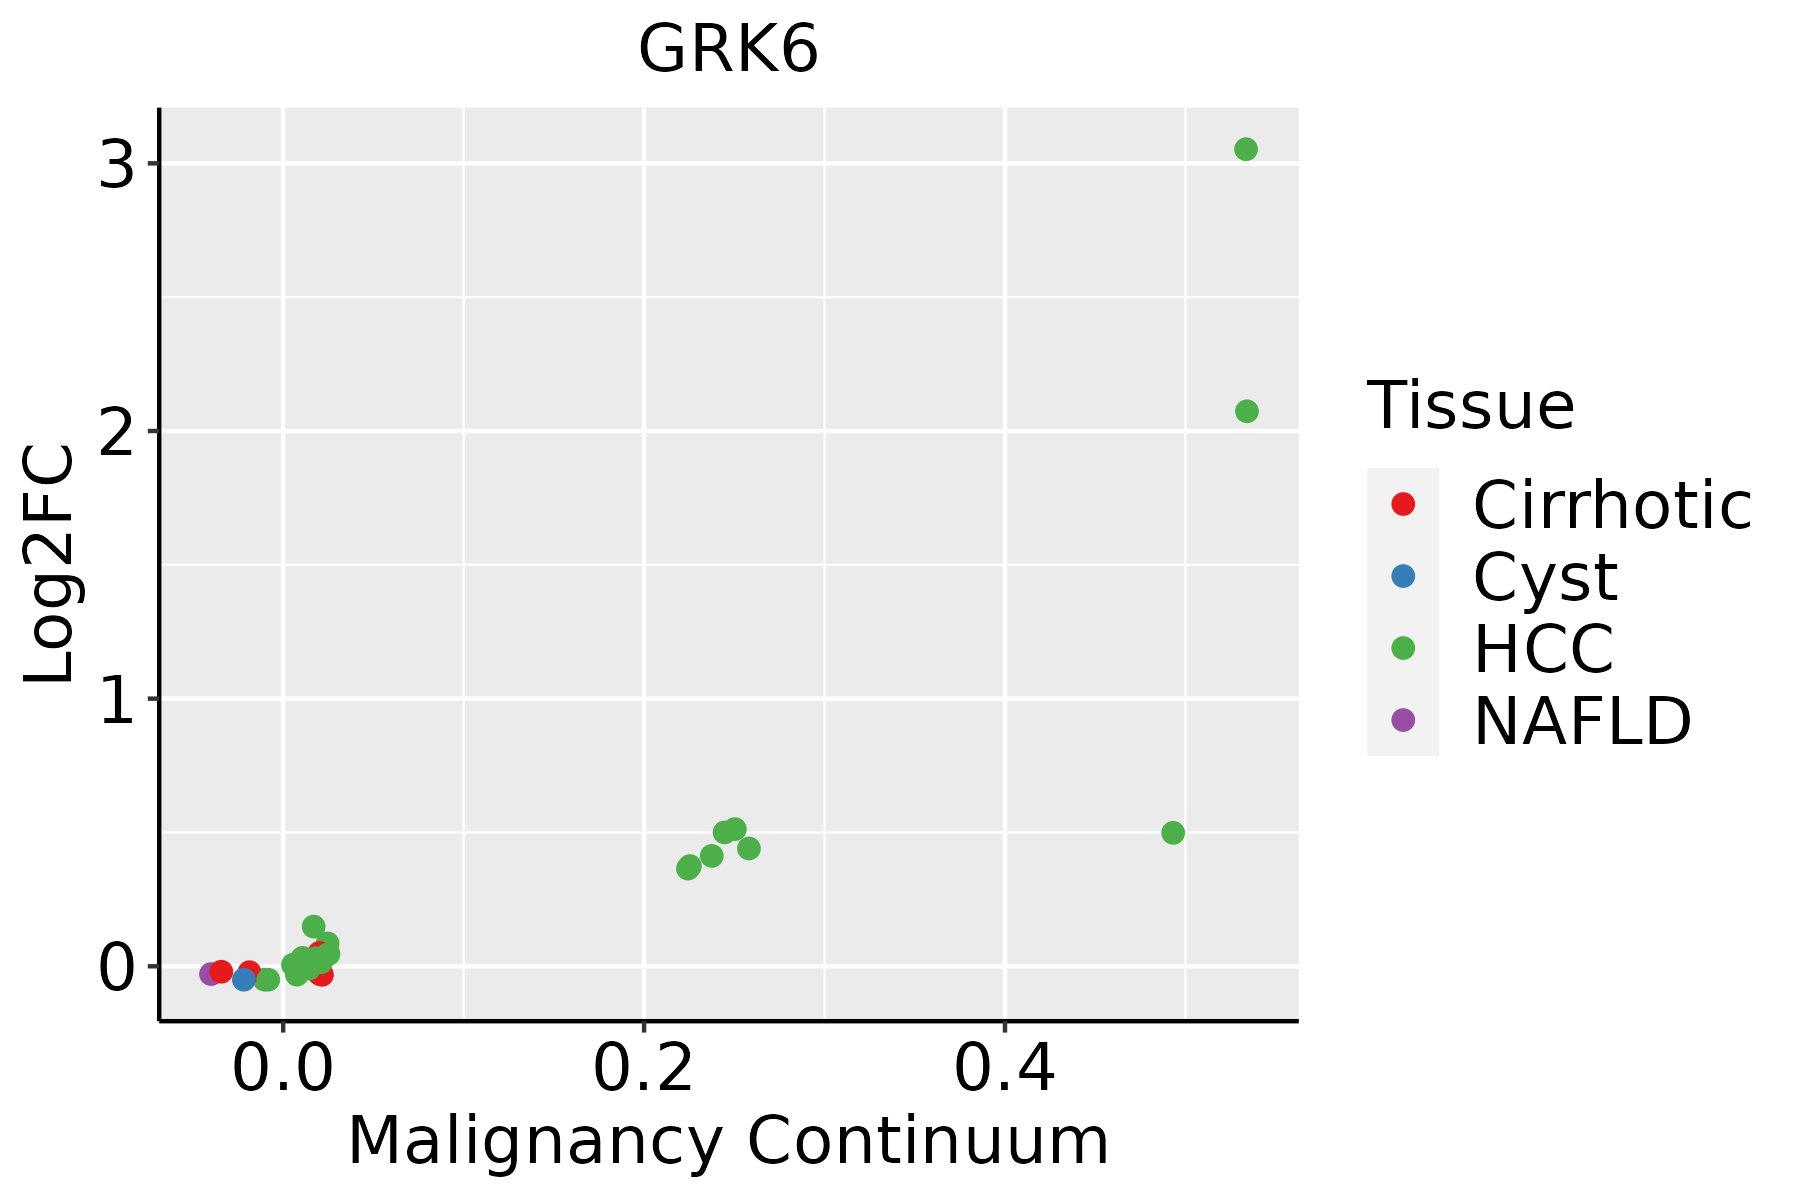 | HCC: Hepatocellular carcinoma |
| NAFLD: Non-alcoholic fatty liver disease | ||
| Oral Cavity | 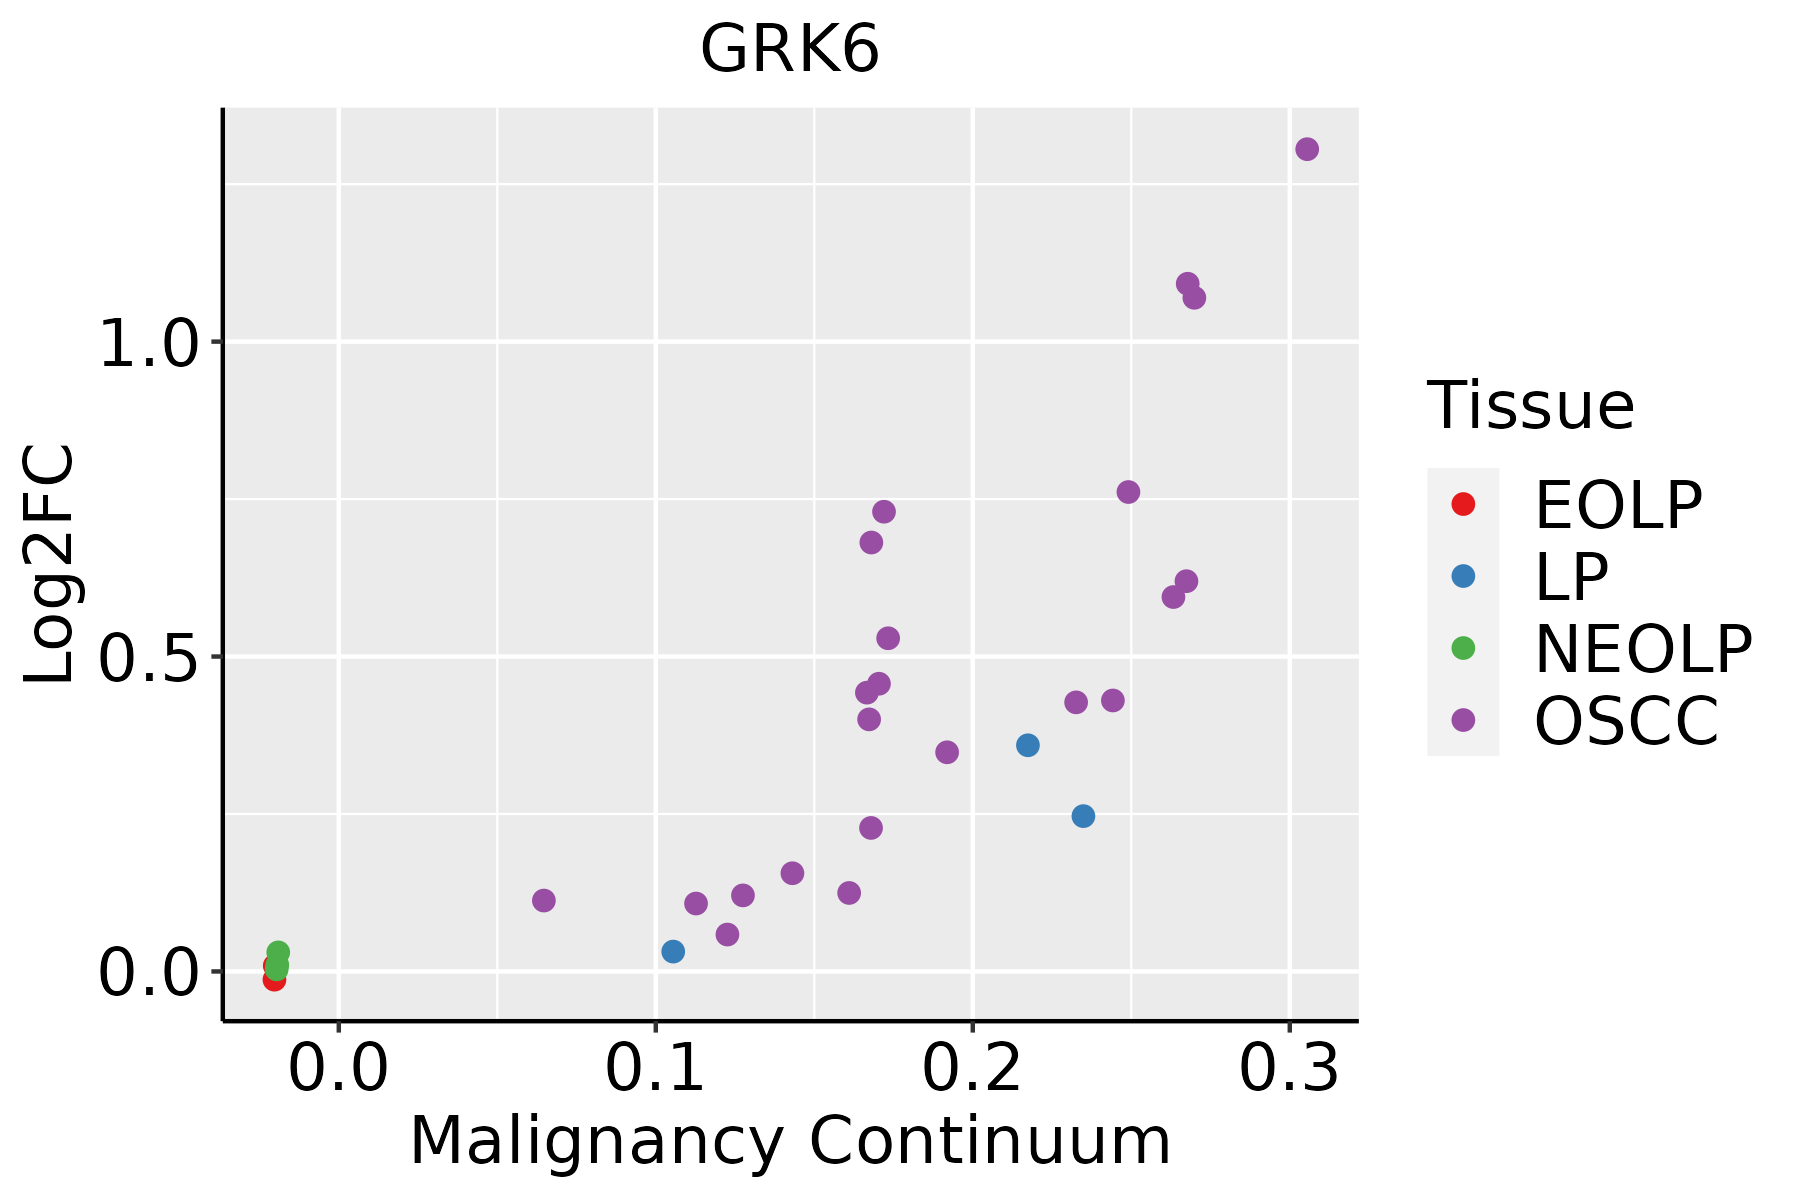 | EOLP: Erosive Oral lichen planus |
| LP: leukoplakia | ||
| NEOLP: Non-erosive oral lichen planus | ||
| OSCC: Oral squamous cell carcinoma | ||
| Skin |  | AK: Actinic keratosis |
| cSCC: Cutaneous squamous cell carcinoma | ||
| SCCIS:squamous cell carcinoma in situ |
| ∗log2FC in expression of this searched gene in stem-like cells from each diseased tissue sample relative to stem-like cells in normal samples in each tissue plotted against the malignancy continuum. Samples are colored based on if they are from different disease stage. |
Top |
Malignant transformation related pathway analysis |
| Find out the enriched GO biological processes and KEGG pathways involved in transition from healthy to precancer to cancer |
| Tissue | Disease Stage | Enriched GO biological Processes |
| Colorectum | AD |  |
| Colorectum | SER |  |
| Colorectum | MSS |  |
| Colorectum | MSI-H |  |
| Colorectum | FAP |  |
| ∗Top 15 enriched GO BP terms are showed in the bar plot of each disease state in each tissue. Each row represents a significant GO biological process which is colored according to the -log10(p.adjust). |
| Page: 1 2 3 4 5 6 7 8 9 |
| GO ID | Tissue | Disease Stage | Description | Gene Ratio | Bg Ratio | pvalue | p.adjust | Count |
| GO:001605517 | Esophagus | ESCC | Wnt signaling pathway | 268/8552 | 444/18723 | 2.32e-10 | 6.58e-09 | 268 |
| GO:019873817 | Esophagus | ESCC | cell-cell signaling by wnt | 269/8552 | 446/18723 | 2.41e-10 | 6.79e-09 | 269 |
| GO:019873821 | Liver | HCC | cell-cell signaling by wnt | 247/7958 | 446/18723 | 2.11e-08 | 4.96e-07 | 247 |
| GO:001605521 | Liver | HCC | Wnt signaling pathway | 245/7958 | 444/18723 | 3.68e-08 | 8.09e-07 | 245 |
| GO:001605510 | Oral cavity | OSCC | Wnt signaling pathway | 227/7305 | 444/18723 | 1.10e-07 | 1.87e-06 | 227 |
| GO:019873810 | Oral cavity | OSCC | cell-cell signaling by wnt | 227/7305 | 446/18723 | 1.75e-07 | 2.86e-06 | 227 |
| GO:001605524 | Skin | cSCC | Wnt signaling pathway | 158/4864 | 444/18723 | 3.80e-06 | 5.70e-05 | 158 |
| GO:019873824 | Skin | cSCC | cell-cell signaling by wnt | 158/4864 | 446/18723 | 5.08e-06 | 7.38e-05 | 158 |
| Page: 1 |
| Pathway ID | Tissue | Disease Stage | Description | Gene Ratio | Bg Ratio | pvalue | p.adjust | qvalue | Count |
| hsa04144210 | Esophagus | ESCC | Endocytosis | 186/4205 | 251/8465 | 9.74e-16 | 4.66e-14 | 2.39e-14 | 186 |
| hsa0414437 | Esophagus | ESCC | Endocytosis | 186/4205 | 251/8465 | 9.74e-16 | 4.66e-14 | 2.39e-14 | 186 |
| hsa0414422 | Liver | HCC | Endocytosis | 178/4020 | 251/8465 | 2.03e-14 | 5.22e-13 | 2.91e-13 | 178 |
| hsa0414432 | Liver | HCC | Endocytosis | 178/4020 | 251/8465 | 2.03e-14 | 5.22e-13 | 2.91e-13 | 178 |
| hsa0414427 | Oral cavity | OSCC | Endocytosis | 174/3704 | 251/8465 | 9.42e-17 | 4.51e-15 | 2.29e-15 | 174 |
| hsa04144112 | Oral cavity | OSCC | Endocytosis | 174/3704 | 251/8465 | 9.42e-17 | 4.51e-15 | 2.29e-15 | 174 |
| Page: 1 |
Top |
Cell-cell communication analysis |
| Identification of potential cell-cell interactions between two cell types and their ligand-receptor pairs for different disease states |
| Ligand | Receptor | LRpair | Pathway | Tissue | Disease Stage |
| Page: 1 |
Top |
Single-cell gene regulatory network inference analysis |
| Find out the significant the regulons (TFs) and the target genes of each regulon across cell types for different disease states |
| TF | Cell Type | Tissue | Disease Stage | Target Gene | RSS | Regulon Activity |
| ∗The dot plots of a searched regulon are shown for all cell subpopulations in each disease state of each tissue based on the regulon specific score inferred using pySCENIC and by calculating the average expression. |
| Page: 1 |
Top |
Somatic mutation of malignant transformation related genes |
| Annotation of somatic variants for genes involved in malignant transformation |
| Hugo Symbol | Variant Class | Variant Classification | dbSNP RS | HGVSc | HGVSp | HGVSp Short | SWISSPROT | BIOTYPE | SIFT | PolyPhen | Tumor Sample Barcode | Tissue | Histology | Sex | Age | Stage | Therapy Types | Drugs | Outcome |
| GRK6 | SNV | Missense_Mutation | rs770999265 | c.1292G>A | p.Arg431His | p.R431H | P43250 | protein_coding | deleterious(0.01) | possibly_damaging(0.766) | TCGA-BH-A18G-01 | Breast | breast invasive carcinoma | Female | >=65 | I/II | Unknown | Unknown | SD |
| GRK6 | SNV | Missense_Mutation | rs763068007 | c.692N>T | p.Ala231Val | p.A231V | P43250 | protein_coding | tolerated(0.11) | possibly_damaging(0.465) | TCGA-BH-A18I-01 | Breast | breast invasive carcinoma | Female | <65 | I/II | Chemotherapy | taxotere | CR |
| GRK6 | insertion | Frame_Shift_Ins | novel | c.1252_1253insTGATGGGGCCTGTGCTCTCCTACTGGCCAAGGTCCCCCCAGGC | p.Ser418LeufsTer46 | p.S418Lfs*46 | P43250 | protein_coding | TCGA-A2-A0CM-01 | Breast | breast invasive carcinoma | Female | <65 | I/II | Chemotherapy | adriamycin | PD | ||
| GRK6 | SNV | Missense_Mutation | rs777455959 | c.176G>A | p.Arg59Gln | p.R59Q | P43250 | protein_coding | tolerated(0.37) | benign(0.001) | TCGA-2W-A8YY-01 | Cervix | cervical & endocervical cancer | Female | <65 | I/II | Chemotherapy | cisplatin | CR |
| GRK6 | SNV | Missense_Mutation | rs867783337 | c.1522N>T | p.Pro508Ser | p.P508S | P43250 | protein_coding | tolerated(1) | benign(0.012) | TCGA-VS-A9UQ-01 | Cervix | cervical & endocervical cancer | Female | <65 | I/II | Unknown | Unknown | PD |
| GRK6 | SNV | Missense_Mutation | c.1282N>A | p.Pro428Thr | p.P428T | P43250 | protein_coding | deleterious(0.01) | possibly_damaging(0.452) | TCGA-AA-3811-01 | Colorectum | colon adenocarcinoma | Female | >=65 | III/IV | Unknown | Unknown | PD | |
| GRK6 | SNV | Missense_Mutation | novel | c.1362G>T | p.Lys454Asn | p.K454N | P43250 | protein_coding | deleterious(0.01) | benign(0.357) | TCGA-AA-3864-01 | Colorectum | colon adenocarcinoma | Male | >=65 | I/II | Unknown | Unknown | SD |
| GRK6 | SNV | Missense_Mutation | novel | c.931N>A | p.Asp311Asn | p.D311N | P43250 | protein_coding | deleterious(0) | probably_damaging(0.997) | TCGA-AA-3984-01 | Colorectum | colon adenocarcinoma | Female | <65 | I/II | Unknown | Unknown | SD |
| GRK6 | SNV | Missense_Mutation | c.1622N>A | p.Gly541Asp | p.G541D | P43250 | protein_coding | tolerated(0.57) | benign(0.015) | TCGA-AM-5821-01 | Colorectum | colon adenocarcinoma | Female | >=65 | I/II | Unknown | Unknown | SD | |
| GRK6 | SNV | Missense_Mutation | novel | c.1237T>C | p.Ser413Pro | p.S413P | P43250 | protein_coding | deleterious(0.02) | benign(0.35) | TCGA-AZ-6598-01 | Colorectum | colon adenocarcinoma | Female | >=65 | I/II | Unknown | Unknown | SD |
| Page: 1 2 3 4 5 6 |
Top |
Related drugs of malignant transformation related genes |
| Identification of chemicals and drugs interact with genes involved in malignant transfromation |
| (DGIdb 4.0) |
| Entrez ID | Symbol | Category | Interaction Types | Drug Claim Name | Drug Name | PMIDs |
| 2870 | GRK6 | ENZYME, DRUGGABLE GENOME, KINASE, SERINE THREONINE KINASE | inhibitor | 249565822 | BALANOL |
| Page: 1 |

Copyright 2023-Present -The University of Texas Health Science Center at Houston |