
|
|||||
|
 | |
| |
| |
| |
| |
| |
|
Gene: GRK3 |
Gene summary for GRK3 |
| Gene information | Species | Human | Gene symbol | GRK3 | Gene ID | 157 |
| Gene name | G protein-coupled receptor kinase 3 | |
| Gene Alias | ADRBK2 | |
| Cytomap | 22q12.1 | |
| Gene Type | protein-coding | GO ID | GO:0002029 | UniProtAcc | A0A024R1D8 |
Top |
Malignant transformation analysis |
| Identification of the aberrant gene expression in precancerous and cancerous lesions by comparing the gene expression of stem-like cells in diseased tissues with normal stem cells |
| Entrez ID | Symbol | Replicates | Species | Organ | Tissue | Adj P-value | Log2FC | Malignancy |
| 157 | GRK3 | HTA11_3410_2000001011 | Human | Colorectum | AD | 3.27e-03 | 1.54e-01 | 0.0155 |
| 157 | GRK3 | HTA11_1938_2000001011 | Human | Colorectum | AD | 4.65e-02 | 2.58e-01 | -0.0811 |
| 157 | GRK3 | HTA11_1391_2000001011 | Human | Colorectum | AD | 5.18e-06 | 4.13e-01 | -0.059 |
| 157 | GRK3 | HTA11_866_3004761011 | Human | Colorectum | AD | 1.88e-04 | 1.42e-01 | 0.096 |
| 157 | GRK3 | HTA11_10711_2000001011 | Human | Colorectum | AD | 3.25e-03 | 1.73e-01 | 0.0338 |
| 157 | GRK3 | HTA11_7696_3000711011 | Human | Colorectum | AD | 1.05e-06 | 1.84e-01 | 0.0674 |
| 157 | GRK3 | HTA11_99999970781_79442 | Human | Colorectum | MSS | 5.35e-15 | 3.19e-01 | 0.294 |
| 157 | GRK3 | HTA11_99999965104_69814 | Human | Colorectum | MSS | 2.26e-12 | 6.18e-01 | 0.281 |
| 157 | GRK3 | HTA11_99999971662_82457 | Human | Colorectum | MSS | 3.02e-11 | 3.00e-01 | 0.3859 |
| 157 | GRK3 | HTA11_99999973899_84307 | Human | Colorectum | MSS | 1.37e-05 | 2.26e-01 | 0.2585 |
| 157 | GRK3 | A002-C-010 | Human | Colorectum | FAP | 5.01e-07 | 3.98e-01 | 0.242 |
| 157 | GRK3 | A001-C-207 | Human | Colorectum | FAP | 9.22e-07 | 4.81e-01 | 0.1278 |
| 157 | GRK3 | A002-C-203 | Human | Colorectum | FAP | 5.09e-06 | 3.13e-01 | 0.2786 |
| 157 | GRK3 | A001-C-119 | Human | Colorectum | FAP | 4.11e-04 | 4.42e-01 | -0.1557 |
| 157 | GRK3 | A001-C-108 | Human | Colorectum | FAP | 6.10e-05 | 3.55e-01 | -0.0272 |
| 157 | GRK3 | A002-C-021 | Human | Colorectum | FAP | 1.62e-28 | 6.37e-01 | 0.1171 |
| 157 | GRK3 | A001-C-104 | Human | Colorectum | FAP | 1.75e-13 | 4.77e-01 | 0.0184 |
| 157 | GRK3 | A015-C-005 | Human | Colorectum | FAP | 4.65e-04 | 3.76e-01 | -0.0336 |
| 157 | GRK3 | A015-C-106 | Human | Colorectum | FAP | 9.58e-05 | 3.60e-01 | -0.0511 |
| 157 | GRK3 | A001-C-014 | Human | Colorectum | FAP | 2.36e-11 | 4.77e-01 | 0.0135 |
| Page: 1 2 3 |
| Tissue | Expression Dynamics | Abbreviation |
| Colorectum (GSE201348) |  | FAP: Familial adenomatous polyposis |
| CRC: Colorectal cancer | ||
| Colorectum (HTA11) |  | AD: Adenomas |
| SER: Sessile serrated lesions | ||
| MSI-H: Microsatellite-high colorectal cancer | ||
| MSS: Microsatellite stable colorectal cancer | ||
| Liver | 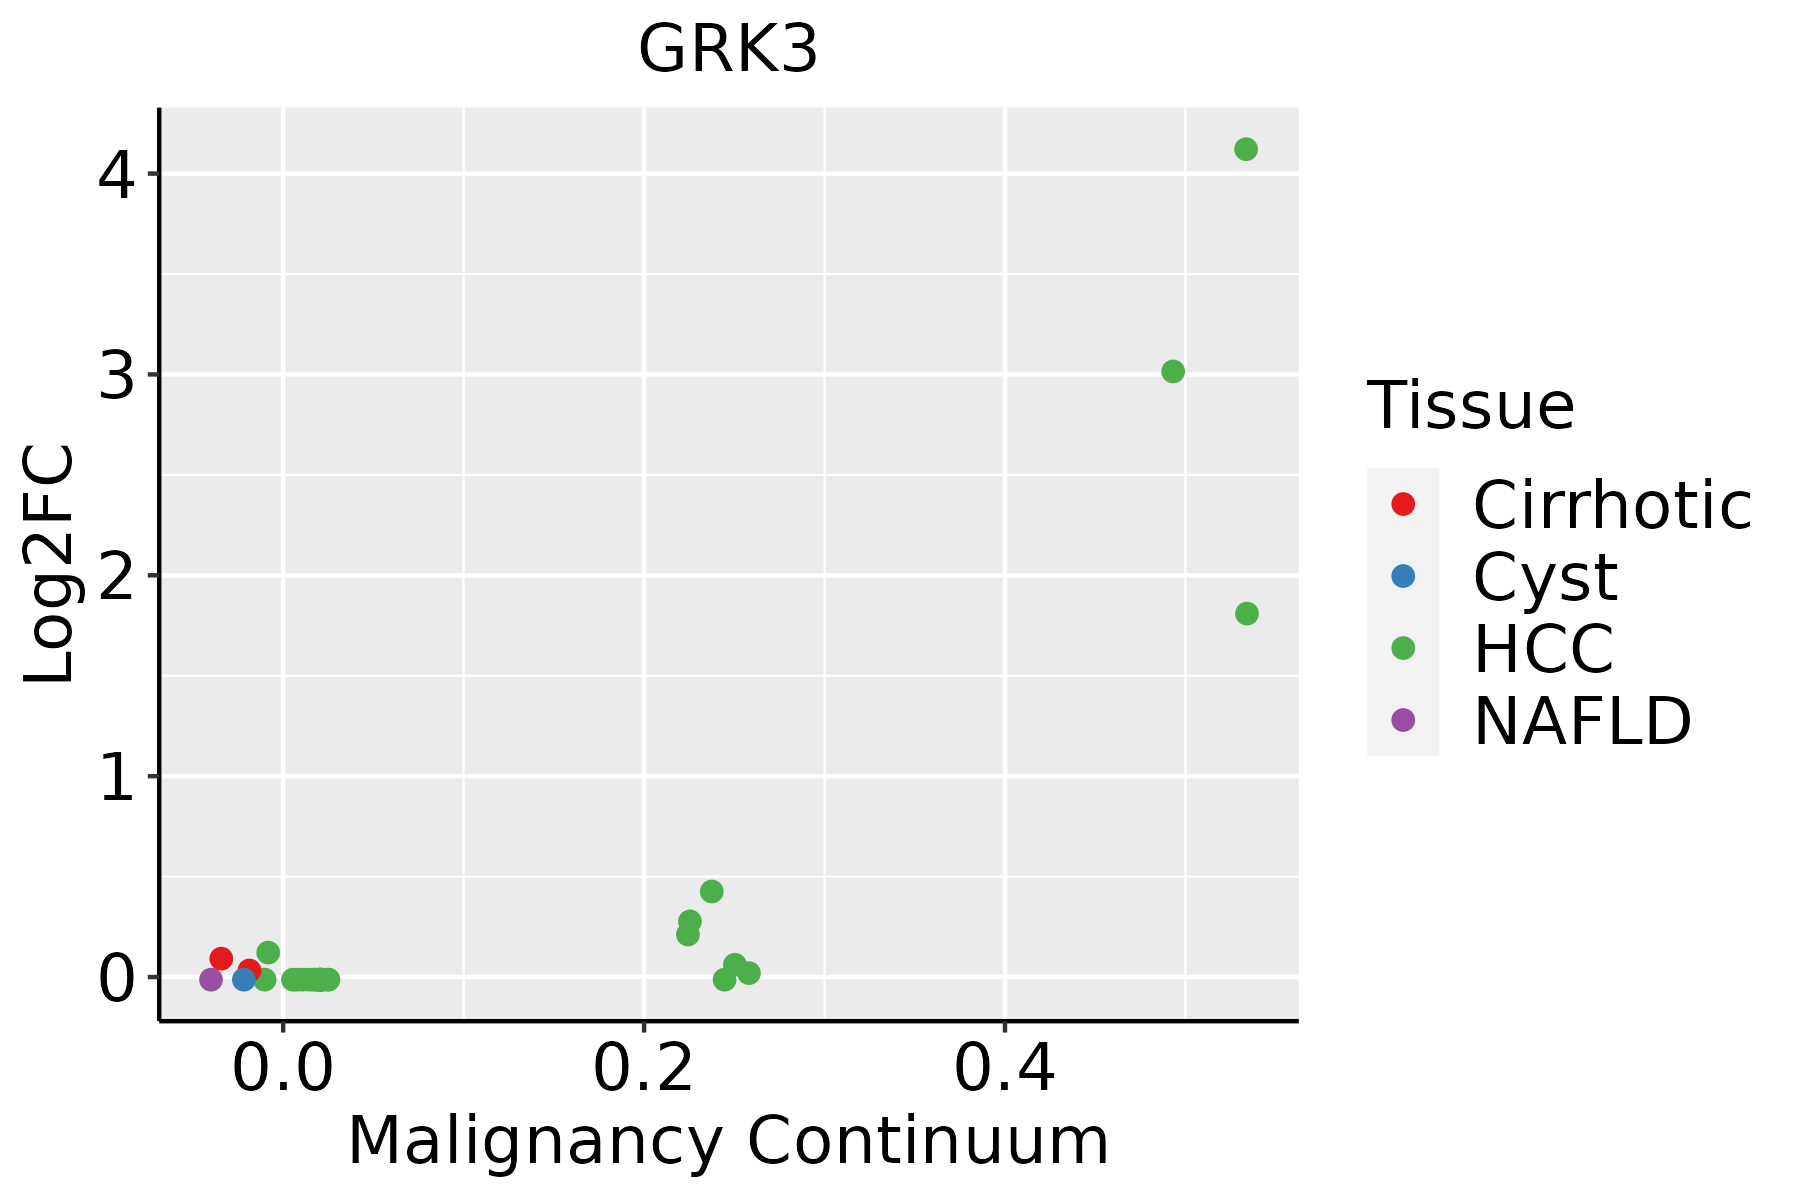 | HCC: Hepatocellular carcinoma |
| NAFLD: Non-alcoholic fatty liver disease | ||
| Lung | 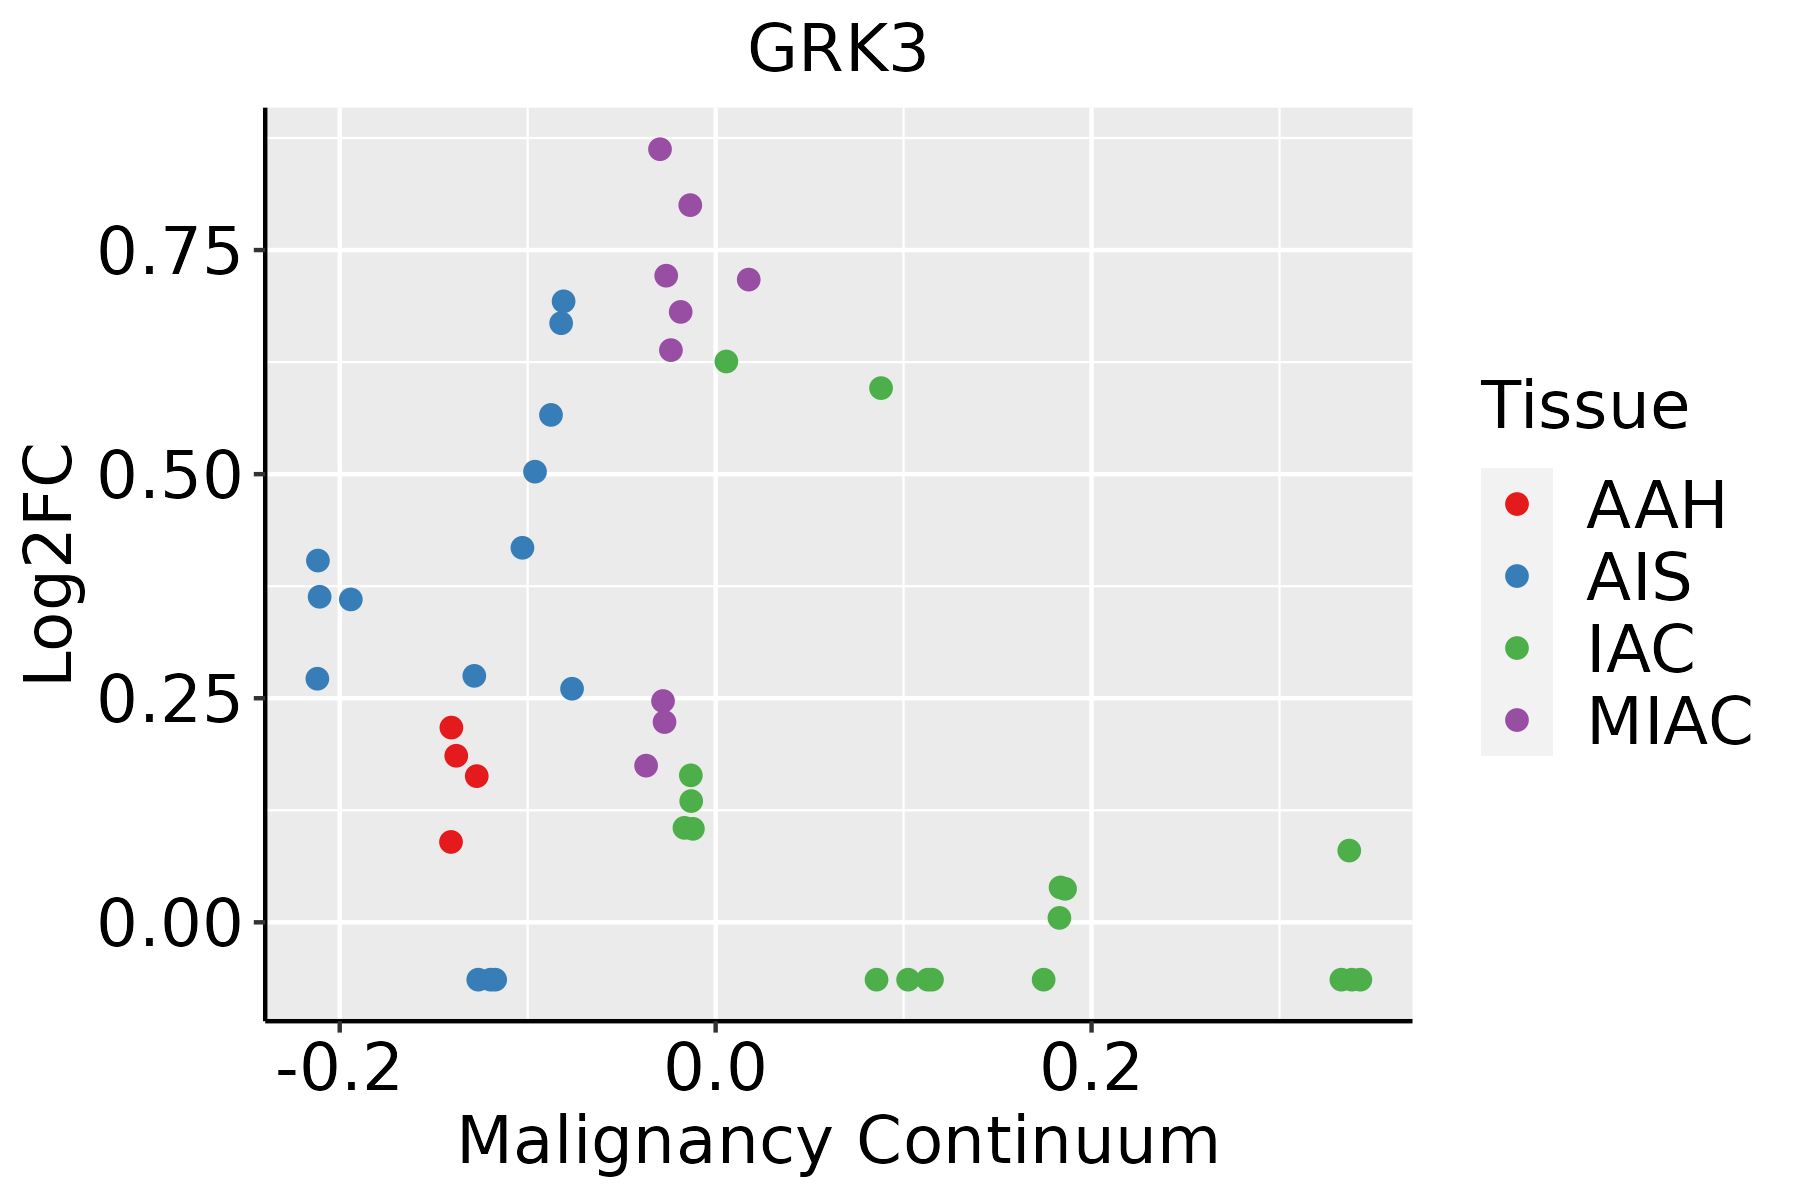 | AAH: Atypical adenomatous hyperplasia |
| AIS: Adenocarcinoma in situ | ||
| IAC: Invasive lung adenocarcinoma | ||
| MIA: Minimally invasive adenocarcinoma |
| ∗log2FC in expression of this searched gene in stem-like cells from each diseased tissue sample relative to stem-like cells in normal samples in each tissue plotted against the malignancy continuum. Samples are colored based on if they are from different disease stage. |
Top |
Malignant transformation related pathway analysis |
| Find out the enriched GO biological processes and KEGG pathways involved in transition from healthy to precancer to cancer |
| Tissue | Disease Stage | Enriched GO biological Processes |
| Colorectum | AD |  |
| Colorectum | SER |  |
| Colorectum | MSS |  |
| Colorectum | MSI-H |  |
| Colorectum | FAP |  |
| ∗Top 15 enriched GO BP terms are showed in the bar plot of each disease state in each tissue. Each row represents a significant GO biological process which is colored according to the -log10(p.adjust). |
| Page: 1 2 3 4 5 6 7 8 9 |
| GO ID | Tissue | Disease Stage | Description | Gene Ratio | Bg Ratio | pvalue | p.adjust | Count |
| GO:0043112 | Colorectum | AD | receptor metabolic process | 62/3918 | 166/18723 | 8.18e-07 | 2.85e-05 | 62 |
| GO:0006898 | Colorectum | AD | receptor-mediated endocytosis | 76/3918 | 244/18723 | 1.07e-04 | 1.59e-03 | 76 |
| GO:0031623 | Colorectum | AD | receptor internalization | 35/3918 | 113/18723 | 7.72e-03 | 4.66e-02 | 35 |
| GO:00431121 | Colorectum | MSS | receptor metabolic process | 57/3467 | 166/18723 | 8.47e-07 | 2.97e-05 | 57 |
| GO:00068981 | Colorectum | MSS | receptor-mediated endocytosis | 69/3467 | 244/18723 | 1.18e-04 | 1.82e-03 | 69 |
| GO:00316231 | Colorectum | MSS | receptor internalization | 32/3467 | 113/18723 | 7.02e-03 | 4.50e-02 | 32 |
| GO:00068982 | Colorectum | FAP | receptor-mediated endocytosis | 62/2622 | 244/18723 | 1.47e-06 | 6.39e-05 | 62 |
| GO:00431122 | Colorectum | FAP | receptor metabolic process | 46/2622 | 166/18723 | 2.70e-06 | 1.02e-04 | 46 |
| GO:00316232 | Colorectum | FAP | receptor internalization | 28/2622 | 113/18723 | 1.56e-03 | 1.39e-02 | 28 |
| GO:00068983 | Colorectum | CRC | receptor-mediated endocytosis | 50/2078 | 244/18723 | 1.27e-05 | 4.08e-04 | 50 |
| GO:00431123 | Colorectum | CRC | receptor metabolic process | 36/2078 | 166/18723 | 5.86e-05 | 1.31e-03 | 36 |
| GO:00316233 | Colorectum | CRC | receptor internalization | 23/2078 | 113/18723 | 2.85e-03 | 2.58e-02 | 23 |
| GO:004311221 | Liver | HCC | receptor metabolic process | 96/7958 | 166/18723 | 4.69e-05 | 4.50e-04 | 96 |
| GO:000689821 | Liver | HCC | receptor-mediated endocytosis | 134/7958 | 244/18723 | 5.73e-05 | 5.31e-04 | 134 |
| GO:00068985 | Lung | IAC | receptor-mediated endocytosis | 50/2061 | 244/18723 | 1.01e-05 | 3.23e-04 | 50 |
| GO:00431125 | Lung | IAC | receptor metabolic process | 36/2061 | 166/18723 | 4.93e-05 | 1.13e-03 | 36 |
| GO:00316234 | Lung | IAC | receptor internalization | 22/2061 | 113/18723 | 5.49e-03 | 4.11e-02 | 22 |
| GO:000689812 | Lung | AIS | receptor-mediated endocytosis | 50/1849 | 244/18723 | 4.47e-07 | 3.52e-05 | 50 |
| GO:004311212 | Lung | AIS | receptor metabolic process | 32/1849 | 166/18723 | 1.68e-04 | 3.53e-03 | 32 |
| Page: 1 |
| Pathway ID | Tissue | Disease Stage | Description | Gene Ratio | Bg Ratio | pvalue | p.adjust | qvalue | Count |
| hsa04144 | Colorectum | AD | Endocytosis | 111/2092 | 251/8465 | 5.95e-12 | 1.42e-10 | 9.08e-11 | 111 |
| hsa041441 | Colorectum | AD | Endocytosis | 111/2092 | 251/8465 | 5.95e-12 | 1.42e-10 | 9.08e-11 | 111 |
| hsa041444 | Colorectum | MSS | Endocytosis | 102/1875 | 251/8465 | 1.85e-11 | 4.43e-10 | 2.71e-10 | 102 |
| hsa041445 | Colorectum | MSS | Endocytosis | 102/1875 | 251/8465 | 1.85e-11 | 4.43e-10 | 2.71e-10 | 102 |
| hsa041446 | Colorectum | FAP | Endocytosis | 78/1404 | 251/8465 | 6.20e-09 | 2.96e-07 | 1.80e-07 | 78 |
| hsa041447 | Colorectum | FAP | Endocytosis | 78/1404 | 251/8465 | 6.20e-09 | 2.96e-07 | 1.80e-07 | 78 |
| hsa041448 | Colorectum | CRC | Endocytosis | 65/1091 | 251/8465 | 1.27e-08 | 1.06e-06 | 7.19e-07 | 65 |
| hsa04724 | Colorectum | CRC | Glutamatergic synapse | 24/1091 | 115/8465 | 1.07e-02 | 4.74e-02 | 3.21e-02 | 24 |
| hsa041449 | Colorectum | CRC | Endocytosis | 65/1091 | 251/8465 | 1.27e-08 | 1.06e-06 | 7.19e-07 | 65 |
| hsa047241 | Colorectum | CRC | Glutamatergic synapse | 24/1091 | 115/8465 | 1.07e-02 | 4.74e-02 | 3.21e-02 | 24 |
| hsa0414422 | Liver | HCC | Endocytosis | 178/4020 | 251/8465 | 2.03e-14 | 5.22e-13 | 2.91e-13 | 178 |
| hsa0414432 | Liver | HCC | Endocytosis | 178/4020 | 251/8465 | 2.03e-14 | 5.22e-13 | 2.91e-13 | 178 |
| hsa0414414 | Lung | IAC | Endocytosis | 51/1053 | 251/8465 | 2.25e-04 | 2.54e-03 | 1.68e-03 | 51 |
| hsa0414415 | Lung | IAC | Endocytosis | 51/1053 | 251/8465 | 2.25e-04 | 2.54e-03 | 1.68e-03 | 51 |
| hsa0414423 | Lung | AIS | Endocytosis | 52/961 | 251/8465 | 9.74e-06 | 3.04e-04 | 1.95e-04 | 52 |
| hsa04340 | Lung | AIS | Hedgehog signaling pathway | 14/961 | 56/8465 | 3.21e-03 | 1.82e-02 | 1.17e-02 | 14 |
| hsa0414433 | Lung | AIS | Endocytosis | 52/961 | 251/8465 | 9.74e-06 | 3.04e-04 | 1.95e-04 | 52 |
| hsa043401 | Lung | AIS | Hedgehog signaling pathway | 14/961 | 56/8465 | 3.21e-03 | 1.82e-02 | 1.17e-02 | 14 |
| Page: 1 |
Top |
Cell-cell communication analysis |
| Identification of potential cell-cell interactions between two cell types and their ligand-receptor pairs for different disease states |
| Ligand | Receptor | LRpair | Pathway | Tissue | Disease Stage |
| Page: 1 |
Top |
Single-cell gene regulatory network inference analysis |
| Find out the significant the regulons (TFs) and the target genes of each regulon across cell types for different disease states |
| TF | Cell Type | Tissue | Disease Stage | Target Gene | RSS | Regulon Activity |
| ∗The dot plots of a searched regulon are shown for all cell subpopulations in each disease state of each tissue based on the regulon specific score inferred using pySCENIC and by calculating the average expression. |
| Page: 1 |
Top |
Somatic mutation of malignant transformation related genes |
| Annotation of somatic variants for genes involved in malignant transformation |
| Hugo Symbol | Variant Class | Variant Classification | dbSNP RS | HGVSc | HGVSp | HGVSp Short | SWISSPROT | BIOTYPE | SIFT | PolyPhen | Tumor Sample Barcode | Tissue | Histology | Sex | Age | Stage | Therapy Types | Drugs | Outcome |
| GRK3 | SNV | Missense_Mutation | c.292N>C | p.Glu98Gln | p.E98Q | P35626 | protein_coding | tolerated(0.09) | benign(0.043) | TCGA-A2-A04Y-01 | Breast | breast invasive carcinoma | Female | <65 | I/II | Chemotherapy | cytoxan | SD | |
| GRK3 | SNV | Missense_Mutation | c.1231N>A | p.Val411Met | p.V411M | P35626 | protein_coding | deleterious(0.02) | possibly_damaging(0.828) | TCGA-AN-A0XN-01 | Breast | breast invasive carcinoma | Female | >=65 | III/IV | Unknown | Unknown | SD | |
| GRK3 | insertion | Nonsense_Mutation | novel | c.2018_2019insCAAGGTTTTCAGCAAATTCATCGTGATTTTTTAAAAAGGCAAATATTA | p.Val673_Glu674insLysValPheSerLysPheIleValIlePheTerLysGlyLysTyrTer | p.V673_E674insKVFSKFIVIF*KGKY* | P35626 | protein_coding | TCGA-AO-A0JF-01 | Breast | breast invasive carcinoma | Female | >=65 | I/II | Chemotherapy | doxorubicin | SD | ||
| GRK3 | SNV | Missense_Mutation | novel | c.1258N>A | p.Glu420Lys | p.E420K | P35626 | protein_coding | deleterious(0.01) | possibly_damaging(0.581) | TCGA-C5-A902-01 | Cervix | cervical & endocervical cancer | Female | <65 | I/II | Chemotherapy | cisplatin | SD |
| GRK3 | SNV | Missense_Mutation | rs774455287 | c.1292N>A | p.Arg431Gln | p.R431Q | P35626 | protein_coding | deleterious(0) | possibly_damaging(0.886) | TCGA-EA-A3HS-01 | Cervix | cervical & endocervical cancer | Female | <65 | I/II | Unknown | Unknown | SD |
| GRK3 | SNV | Missense_Mutation | novel | c.204N>G | p.Phe68Leu | p.F68L | P35626 | protein_coding | tolerated(0.16) | benign(0.199) | TCGA-EA-A3HU-01 | Cervix | cervical & endocervical cancer | Female | <65 | I/II | Unknown | Unknown | SD |
| GRK3 | SNV | Missense_Mutation | rs144810352 | c.1979N>A | p.Arg660His | p.R660H | P35626 | protein_coding | deleterious_low_confidence(0.02) | possibly_damaging(0.704) | TCGA-VS-A9UT-01 | Cervix | cervical & endocervical cancer | Female | >=65 | I/II | Unknown | Unknown | SD |
| GRK3 | SNV | Missense_Mutation | novel | c.232N>A | p.Glu78Lys | p.E78K | P35626 | protein_coding | tolerated(0.09) | benign(0.415) | TCGA-5M-AATE-01 | Colorectum | colon adenocarcinoma | Male | >=65 | I/II | Unknown | Unknown | PD |
| GRK3 | SNV | Missense_Mutation | c.771G>A | p.Met257Ile | p.M257I | P35626 | protein_coding | deleterious(0.03) | probably_damaging(0.916) | TCGA-AA-3715-01 | Colorectum | colon adenocarcinoma | Male | >=65 | I/II | Unknown | Unknown | PD | |
| GRK3 | SNV | Missense_Mutation | novel | c.1945N>A | p.Glu649Lys | p.E649K | P35626 | protein_coding | tolerated_low_confidence(0.39) | benign(0.013) | TCGA-AZ-4315-01 | Colorectum | colon adenocarcinoma | Male | <65 | I/II | Unknown | Unknown | SD |
| Page: 1 2 3 4 5 6 7 8 |
Top |
Related drugs of malignant transformation related genes |
| Identification of chemicals and drugs interact with genes involved in malignant transfromation |
| (DGIdb 4.0) |
| Entrez ID | Symbol | Category | Interaction Types | Drug Claim Name | Drug Name | PMIDs |
| 157 | GRK3 | KINASE, DRUGGABLE GENOME, SERINE THREONINE KINASE, ENZYME | inhibitor | 252166647 | ||
| 157 | GRK3 | KINASE, DRUGGABLE GENOME, SERINE THREONINE KINASE, ENZYME | inhibitor | 249565822 | BALANOL |
| Page: 1 |

Copyright 2023-Present -The University of Texas Health Science Center at Houston |