
|
|||||
|
 | |
| |
| |
| |
| |
| |
|
Gene: GRK2 |
Gene summary for GRK2 |
| Gene information | Species | Human | Gene symbol | GRK2 | Gene ID | 156 |
| Gene name | G protein-coupled receptor kinase 2 | |
| Gene Alias | ADRBK1 | |
| Cytomap | 11q13.2 | |
| Gene Type | protein-coding | GO ID | GO:0002026 | UniProtAcc | A0A0S2Z392 |
Top |
Malignant transformation analysis |
| Identification of the aberrant gene expression in precancerous and cancerous lesions by comparing the gene expression of stem-like cells in diseased tissues with normal stem cells |
| Entrez ID | Symbol | Replicates | Species | Organ | Tissue | Adj P-value | Log2FC | Malignancy |
| 156 | GRK2 | HTA11_3410_2000001011 | Human | Colorectum | AD | 1.33e-05 | 1.91e-01 | 0.0155 |
| 156 | GRK2 | HTA11_2487_2000001011 | Human | Colorectum | SER | 2.49e-05 | 3.73e-01 | -0.1808 |
| 156 | GRK2 | HTA11_1938_2000001011 | Human | Colorectum | AD | 5.80e-03 | 3.17e-01 | -0.0811 |
| 156 | GRK2 | HTA11_347_2000001011 | Human | Colorectum | AD | 4.50e-02 | 1.05e-01 | -0.1954 |
| 156 | GRK2 | HTA11_3361_2000001011 | Human | Colorectum | AD | 2.54e-02 | 2.37e-01 | -0.1207 |
| 156 | GRK2 | HTA11_83_2000001011 | Human | Colorectum | SER | 8.24e-03 | 2.49e-01 | -0.1526 |
| 156 | GRK2 | HTA11_696_2000001011 | Human | Colorectum | AD | 4.94e-11 | 2.98e-01 | -0.1464 |
| 156 | GRK2 | HTA11_866_2000001011 | Human | Colorectum | AD | 3.57e-03 | 1.56e-01 | -0.1001 |
| 156 | GRK2 | HTA11_1391_2000001011 | Human | Colorectum | AD | 1.10e-04 | 2.60e-01 | -0.059 |
| 156 | GRK2 | HTA11_10711_2000001011 | Human | Colorectum | AD | 7.13e-04 | 2.87e-01 | 0.0338 |
| 156 | GRK2 | HTA11_7696_3000711011 | Human | Colorectum | AD | 2.42e-10 | 3.28e-01 | 0.0674 |
| 156 | GRK2 | HTA11_6818_2000001021 | Human | Colorectum | AD | 1.99e-04 | 2.58e-01 | 0.0588 |
| 156 | GRK2 | HTA11_99999971662_82457 | Human | Colorectum | MSS | 1.96e-20 | 5.99e-01 | 0.3859 |
| 156 | GRK2 | HTA11_99999974143_84620 | Human | Colorectum | MSS | 1.74e-08 | 2.35e-01 | 0.3005 |
| 156 | GRK2 | HCC1 | Human | Liver | HCC | 5.40e-03 | 1.92e+00 | 0.5336 |
| 156 | GRK2 | HCC2 | Human | Liver | HCC | 5.24e-16 | 1.94e+00 | 0.5341 |
| 156 | GRK2 | HCC5 | Human | Liver | HCC | 1.52e-04 | 1.66e+00 | 0.4932 |
| 156 | GRK2 | S014 | Human | Liver | HCC | 1.31e-22 | 6.51e-01 | 0.2254 |
| 156 | GRK2 | S015 | Human | Liver | HCC | 3.32e-18 | 5.70e-01 | 0.2375 |
| 156 | GRK2 | S016 | Human | Liver | HCC | 6.76e-21 | 6.25e-01 | 0.2243 |
| Page: 1 2 |
| Tissue | Expression Dynamics | Abbreviation |
| Colorectum (GSE201348) |  | FAP: Familial adenomatous polyposis |
| CRC: Colorectal cancer | ||
| Colorectum (HTA11) |  | AD: Adenomas |
| SER: Sessile serrated lesions | ||
| MSI-H: Microsatellite-high colorectal cancer | ||
| MSS: Microsatellite stable colorectal cancer | ||
| Liver | 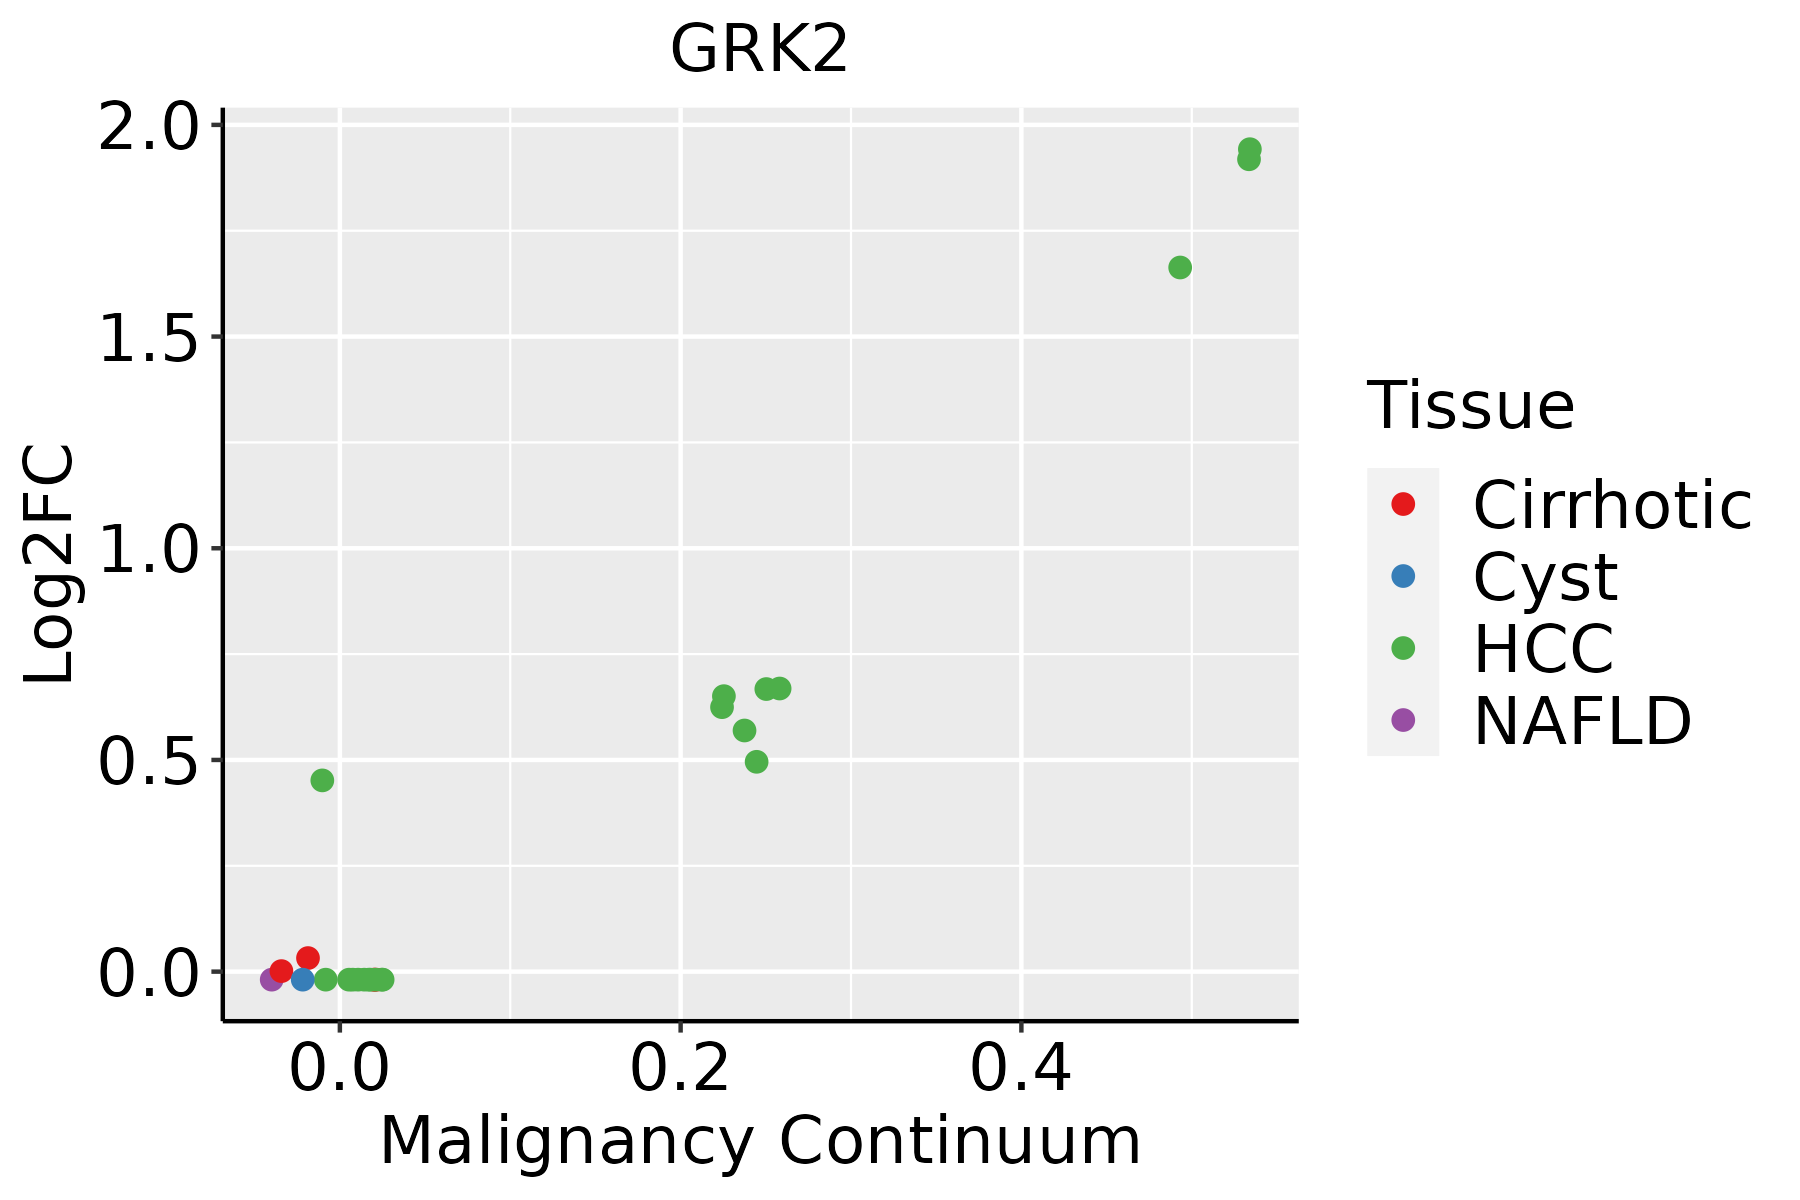 | HCC: Hepatocellular carcinoma |
| NAFLD: Non-alcoholic fatty liver disease |
| ∗log2FC in expression of this searched gene in stem-like cells from each diseased tissue sample relative to stem-like cells in normal samples in each tissue plotted against the malignancy continuum. Samples are colored based on if they are from different disease stage. |
Top |
Malignant transformation related pathway analysis |
| Find out the enriched GO biological processes and KEGG pathways involved in transition from healthy to precancer to cancer |
| Tissue | Disease Stage | Enriched GO biological Processes |
| Colorectum | AD |  |
| Colorectum | SER |  |
| Colorectum | MSS |  |
| Colorectum | MSI-H |  |
| Colorectum | FAP |  |
| ∗Top 15 enriched GO BP terms are showed in the bar plot of each disease state in each tissue. Each row represents a significant GO biological process which is colored according to the -log10(p.adjust). |
| Page: 1 2 3 4 5 6 7 8 9 |
| GO ID | Tissue | Disease Stage | Description | Gene Ratio | Bg Ratio | pvalue | p.adjust | Count |
| GO:0016032 | Colorectum | AD | viral process | 168/3918 | 415/18723 | 4.67e-20 | 3.66e-17 | 168 |
| GO:0019058 | Colorectum | AD | viral life cycle | 119/3918 | 317/18723 | 6.18e-12 | 8.23e-10 | 119 |
| GO:0044403 | Colorectum | AD | biological process involved in symbiotic interaction | 99/3918 | 290/18723 | 1.02e-07 | 4.93e-06 | 99 |
| GO:0051701 | Colorectum | AD | biological process involved in interaction with host | 73/3918 | 203/18723 | 5.08e-07 | 1.88e-05 | 73 |
| GO:0043112 | Colorectum | AD | receptor metabolic process | 62/3918 | 166/18723 | 8.18e-07 | 2.85e-05 | 62 |
| GO:0019079 | Colorectum | AD | viral genome replication | 51/3918 | 131/18723 | 1.83e-06 | 5.51e-05 | 51 |
| GO:0052126 | Colorectum | AD | movement in host environment | 63/3918 | 175/18723 | 2.85e-06 | 8.11e-05 | 63 |
| GO:0046718 | Colorectum | AD | viral entry into host cell | 51/3918 | 144/18723 | 3.99e-05 | 7.16e-04 | 51 |
| GO:0006898 | Colorectum | AD | receptor-mediated endocytosis | 76/3918 | 244/18723 | 1.07e-04 | 1.59e-03 | 76 |
| GO:0044409 | Colorectum | AD | entry into host | 51/3918 | 151/18723 | 1.60e-04 | 2.21e-03 | 51 |
| GO:0051047 | Colorectum | AD | positive regulation of secretion | 90/3918 | 310/18723 | 4.11e-04 | 4.66e-03 | 90 |
| GO:1903532 | Colorectum | AD | positive regulation of secretion by cell | 82/3918 | 282/18723 | 6.85e-04 | 7.00e-03 | 82 |
| GO:0090257 | Colorectum | AD | regulation of muscle system process | 73/3918 | 252/18723 | 1.46e-03 | 1.24e-02 | 73 |
| GO:0018105 | Colorectum | AD | peptidyl-serine phosphorylation | 88/3918 | 315/18723 | 1.73e-03 | 1.43e-02 | 88 |
| GO:0018210 | Colorectum | AD | peptidyl-threonine modification | 40/3918 | 125/18723 | 2.44e-03 | 1.88e-02 | 40 |
| GO:0018209 | Colorectum | AD | peptidyl-serine modification | 92/3918 | 338/18723 | 3.19e-03 | 2.36e-02 | 92 |
| GO:0018107 | Colorectum | AD | peptidyl-threonine phosphorylation | 37/3918 | 116/18723 | 3.68e-03 | 2.61e-02 | 37 |
| GO:0031623 | Colorectum | AD | receptor internalization | 35/3918 | 113/18723 | 7.72e-03 | 4.66e-02 | 35 |
| GO:00160321 | Colorectum | SER | viral process | 118/2897 | 415/18723 | 8.36e-12 | 1.65e-09 | 118 |
| GO:00190581 | Colorectum | SER | viral life cycle | 87/2897 | 317/18723 | 2.82e-08 | 1.94e-06 | 87 |
| Page: 1 2 3 4 |
| Pathway ID | Tissue | Disease Stage | Description | Gene Ratio | Bg Ratio | pvalue | p.adjust | qvalue | Count |
| hsa04144 | Colorectum | AD | Endocytosis | 111/2092 | 251/8465 | 5.95e-12 | 1.42e-10 | 9.08e-11 | 111 |
| hsa041441 | Colorectum | AD | Endocytosis | 111/2092 | 251/8465 | 5.95e-12 | 1.42e-10 | 9.08e-11 | 111 |
| hsa041442 | Colorectum | SER | Endocytosis | 81/1580 | 251/8465 | 1.14e-07 | 2.36e-06 | 1.71e-06 | 81 |
| hsa041443 | Colorectum | SER | Endocytosis | 81/1580 | 251/8465 | 1.14e-07 | 2.36e-06 | 1.71e-06 | 81 |
| hsa041444 | Colorectum | MSS | Endocytosis | 102/1875 | 251/8465 | 1.85e-11 | 4.43e-10 | 2.71e-10 | 102 |
| hsa041445 | Colorectum | MSS | Endocytosis | 102/1875 | 251/8465 | 1.85e-11 | 4.43e-10 | 2.71e-10 | 102 |
| hsa0414422 | Liver | HCC | Endocytosis | 178/4020 | 251/8465 | 2.03e-14 | 5.22e-13 | 2.91e-13 | 178 |
| hsa0414432 | Liver | HCC | Endocytosis | 178/4020 | 251/8465 | 2.03e-14 | 5.22e-13 | 2.91e-13 | 178 |
| Page: 1 |
Top |
Cell-cell communication analysis |
| Identification of potential cell-cell interactions between two cell types and their ligand-receptor pairs for different disease states |
| Ligand | Receptor | LRpair | Pathway | Tissue | Disease Stage |
| Page: 1 |
Top |
Single-cell gene regulatory network inference analysis |
| Find out the significant the regulons (TFs) and the target genes of each regulon across cell types for different disease states |
| TF | Cell Type | Tissue | Disease Stage | Target Gene | RSS | Regulon Activity |
| ∗The dot plots of a searched regulon are shown for all cell subpopulations in each disease state of each tissue based on the regulon specific score inferred using pySCENIC and by calculating the average expression. |
| Page: 1 |
Top |
Somatic mutation of malignant transformation related genes |
| Annotation of somatic variants for genes involved in malignant transformation |
| Hugo Symbol | Variant Class | Variant Classification | dbSNP RS | HGVSc | HGVSp | HGVSp Short | SWISSPROT | BIOTYPE | SIFT | PolyPhen | Tumor Sample Barcode | Tissue | Histology | Sex | Age | Stage | Therapy Types | Drugs | Outcome |
| GRK2 | SNV | Missense_Mutation | novel | c.2029A>G | p.Lys677Glu | p.K677E | P25098 | protein_coding | deleterious_low_confidence(0.03) | benign(0.15) | TCGA-A8-A08Z-01 | Breast | breast invasive carcinoma | Female | >=65 | III/IV | Unknown | Unknown | SD |
| GRK2 | SNV | Missense_Mutation | novel | c.1055G>A | p.Gly352Asp | p.G352D | P25098 | protein_coding | deleterious(0) | probably_damaging(1) | TCGA-A8-A0A2-01 | Breast | breast invasive carcinoma | Female | >=65 | I/II | Hormone Therapy | tamoxiphen | SD |
| GRK2 | SNV | Missense_Mutation | c.517N>T | p.Arg173Trp | p.R173W | P25098 | protein_coding | deleterious(0) | probably_damaging(1) | TCGA-AO-A128-01 | Breast | breast invasive carcinoma | Female | <65 | I/II | Chemotherapy | doxorubicin | SD | |
| GRK2 | SNV | Missense_Mutation | c.1354T>C | p.Phe452Leu | p.F452L | P25098 | protein_coding | deleterious(0.02) | probably_damaging(0.997) | TCGA-BH-A8FZ-01 | Breast | breast invasive carcinoma | Female | <65 | I/II | Unknown | Unknown | SD | |
| GRK2 | SNV | Missense_Mutation | c.1247C>G | p.Ser416Cys | p.S416C | P25098 | protein_coding | tolerated(0.05) | benign(0.014) | TCGA-C8-A12Q-01 | Breast | breast invasive carcinoma | Female | >=65 | III/IV | Unknown | Unknown | PD | |
| GRK2 | SNV | Missense_Mutation | rs761003605 | c.1217N>T | p.Thr406Met | p.T406M | P25098 | protein_coding | deleterious(0) | probably_damaging(0.999) | TCGA-E9-A1RB-01 | Breast | breast invasive carcinoma | Female | <65 | I/II | Chemotherapy | methotrexate | SD |
| GRK2 | SNV | Missense_Mutation | novel | c.1117N>A | p.Asp373Asn | p.D373N | P25098 | protein_coding | deleterious(0) | probably_damaging(1) | TCGA-2W-A8YY-01 | Cervix | cervical & endocervical cancer | Female | <65 | I/II | Chemotherapy | cisplatin | CR |
| GRK2 | SNV | Missense_Mutation | novel | c.1444N>A | p.Ala482Thr | p.A482T | P25098 | protein_coding | deleterious(0.01) | probably_damaging(0.957) | TCGA-2W-A8YY-01 | Cervix | cervical & endocervical cancer | Female | <65 | I/II | Chemotherapy | cisplatin | CR |
| GRK2 | SNV | Missense_Mutation | rs764931970 | c.1978N>T | p.Arg660Trp | p.R660W | P25098 | protein_coding | deleterious(0) | possibly_damaging(0.722) | TCGA-2W-A8YY-01 | Cervix | cervical & endocervical cancer | Female | <65 | I/II | Chemotherapy | cisplatin | CR |
| GRK2 | SNV | Missense_Mutation | rs762912207 | c.473N>A | p.Arg158Gln | p.R158Q | P25098 | protein_coding | tolerated(0.07) | benign(0.225) | TCGA-C5-A1BK-01 | Cervix | cervical & endocervical cancer | Female | <65 | I/II | Unknown | Unknown | SD |
| Page: 1 2 3 4 5 6 |
Top |
Related drugs of malignant transformation related genes |
| Identification of chemicals and drugs interact with genes involved in malignant transfromation |
| (DGIdb 4.0) |
| Entrez ID | Symbol | Category | Interaction Types | Drug Claim Name | Drug Name | PMIDs |
| 156 | GRK2 | SERINE THREONINE KINASE, KINASE, DRUGGABLE GENOME, TRANSCRIPTION FACTOR, G PROTEIN COUPLED RECEPTOR, ENZYME | US9493490, L | |||
| 156 | GRK2 | SERINE THREONINE KINASE, KINASE, DRUGGABLE GENOME, TRANSCRIPTION FACTOR, G PROTEIN COUPLED RECEPTOR, ENZYME | inhibitor | 405560387 | ||
| 156 | GRK2 | SERINE THREONINE KINASE, KINASE, DRUGGABLE GENOME, TRANSCRIPTION FACTOR, G PROTEIN COUPLED RECEPTOR, ENZYME | inhibitor | 249565822 | BALANOL | |
| 156 | GRK2 | SERINE THREONINE KINASE, KINASE, DRUGGABLE GENOME, TRANSCRIPTION FACTOR, G PROTEIN COUPLED RECEPTOR, ENZYME | US9493490, E | |||
| 156 | GRK2 | SERINE THREONINE KINASE, KINASE, DRUGGABLE GENOME, TRANSCRIPTION FACTOR, G PROTEIN COUPLED RECEPTOR, ENZYME | US9493490, C | |||
| 156 | GRK2 | SERINE THREONINE KINASE, KINASE, DRUGGABLE GENOME, TRANSCRIPTION FACTOR, G PROTEIN COUPLED RECEPTOR, ENZYME | inhibitor | 249565823 | ||
| 156 | GRK2 | SERINE THREONINE KINASE, KINASE, DRUGGABLE GENOME, TRANSCRIPTION FACTOR, G PROTEIN COUPLED RECEPTOR, ENZYME | BDBM50173306 | |||
| 156 | GRK2 | SERINE THREONINE KINASE, KINASE, DRUGGABLE GENOME, TRANSCRIPTION FACTOR, G PROTEIN COUPLED RECEPTOR, ENZYME | inhibitor | 252166647 | ||
| 156 | GRK2 | SERINE THREONINE KINASE, KINASE, DRUGGABLE GENOME, TRANSCRIPTION FACTOR, G PROTEIN COUPLED RECEPTOR, ENZYME | US9493490, D |
| Page: 1 |

Copyright 2023-Present -The University of Texas Health Science Center at Houston |