Schematic overview of the cellular and molecular mechanisms involved in the cancer progression, including the proposed cellular and molecular mechanisms in cancer cells trajectory. AT1: alveolar type 1 cells; AT2: alveolar type 2 cells; AAH: atypical adenomatous hyperplasia; AIS: adenocarcinoma in situ; MIA: minimally invasive adenocarcinoma; IA: invasive adenocarcinoma; EMT: epithelial-mesenchymal transition

Home

Download

Statistics

Help

Contact

Center for Computational Systems Medicine
leaf

Gene summary

leaf

Malignant transformation analysis

leaf

Malignant transformation related pathway analysis

leaf

Cell-cell communication analysis

leaf

Single-cell gene regulatory network inference analysis

leaf

Somatic mutation of malignant transformation related genes

leaf

Related drugs of malignant transformation related genes

Gene: GRIP1

Gene summary for GRIP1

check button Gene summary.

Gene informationSpeciesHuman
Gene symbol

GRIP1

Gene ID

23426

Gene nameglutamate receptor interacting protein 1
Gene AliasFRASRS3
Cytomap12q14.3
Gene Typeprotein-coding
GO ID

GO:0000902

UniProtAcc

Q9Y3R0


Top

Malignant transformation analysis

check button Identification of the aberrant gene expression in precancerous and cancerous lesions by comparing the gene expression of stem-like cells in diseased tissues with normal stem cells
check button Malignant transformation involving gene list.
Entrez IDSymbolReplicatesSpeciesOrganTissueAdj P-valueLog2FCMalignancy
23426GRIP1CCI_1HumanCervixCC4.06e-191.41e+000.528
23426GRIP1CCI_3HumanCervixCC1.85e-341.48e+000.516
23426GRIP1HTA11_3410_2000001011HumanColorectumAD1.36e-21-7.03e-010.0155
23426GRIP1HTA11_2487_2000001011HumanColorectumSER2.83e-15-7.43e-01-0.1808
23426GRIP1HTA11_2951_2000001011HumanColorectumAD2.77e-03-6.16e-010.0216
23426GRIP1HTA11_1938_2000001011HumanColorectumAD6.85e-06-5.77e-01-0.0811
23426GRIP1HTA11_78_2000001011HumanColorectumAD3.46e-09-6.12e-01-0.1088
23426GRIP1HTA11_347_2000001011HumanColorectumAD2.64e-16-6.13e-01-0.1954
23426GRIP1HTA11_3361_2000001011HumanColorectumAD1.50e-09-6.50e-01-0.1207
23426GRIP1HTA11_83_2000001011HumanColorectumSER9.59e-09-7.33e-01-0.1526
23426GRIP1HTA11_696_2000001011HumanColorectumAD6.52e-25-6.05e-01-0.1464
23426GRIP1HTA11_866_2000001011HumanColorectumAD2.87e-14-5.80e-01-0.1001
23426GRIP1HTA11_1391_2000001011HumanColorectumAD5.68e-17-6.46e-01-0.059
23426GRIP1HTA11_2992_2000001011HumanColorectumSER3.79e-02-5.17e-01-0.1706
23426GRIP1HTA11_5212_2000001011HumanColorectumAD2.70e-05-7.03e-01-0.2061
23426GRIP1HTA11_5216_2000001011HumanColorectumSER3.59e-03-6.74e-01-0.1462
23426GRIP1HTA11_546_2000001011HumanColorectumAD3.99e-05-5.08e-01-0.0842
23426GRIP1HTA11_7862_2000001011HumanColorectumAD5.39e-08-8.14e-01-0.0179
23426GRIP1HTA11_866_3004761011HumanColorectumAD8.30e-06-4.62e-010.096
23426GRIP1HTA11_8622_2000001021HumanColorectumSER4.47e-03-6.29e-010.0528
Page: 1 2 3 4 5 

check button Transcriptomic changes along malignancy continuum.
TissueExpression DynamicsAbbreviation
CervixThe image shows the transcriptomic changes along malignancy continuum.log2FC in expression of this searched gene in stem-like cells from each diseased tissue sample relative to stem-like cells in normal samples in each tissue plotted against the malignancy continuum. Samples are colored based on if they are from different disease stage.CC: Cervix cancer
HSIL_HPV: HPV-infected high-grade squamous intraepithelial lesions
N_HPV: HPV-infected normal cervix
Colorectum (GSE201348)The image shows the transcriptomic changes along malignancy continuum.log2FC in expression of this searched gene in stem-like cells from each diseased tissue sample relative to stem-like cells in normal samples in each tissue plotted against the malignancy continuum. Samples are colored based on if they are from different disease stage.FAP: Familial adenomatous polyposis
CRC: Colorectal cancer
Colorectum (HTA11)The image shows the transcriptomic changes along malignancy continuum.log2FC in expression of this searched gene in stem-like cells from each diseased tissue sample relative to stem-like cells in normal samples in each tissue plotted against the malignancy continuum. Samples are colored based on if they are from different disease stage.AD: Adenomas
SER: Sessile serrated lesions
MSI-H: Microsatellite-high colorectal cancer
MSS: Microsatellite stable colorectal cancer
EndometriumThe image shows the transcriptomic changes along malignancy continuum.log2FC in expression of this searched gene in stem-like cells from each diseased tissue sample relative to stem-like cells in normal samples in each tissue plotted against the malignancy continuum. Samples are colored based on if they are from different disease stage.
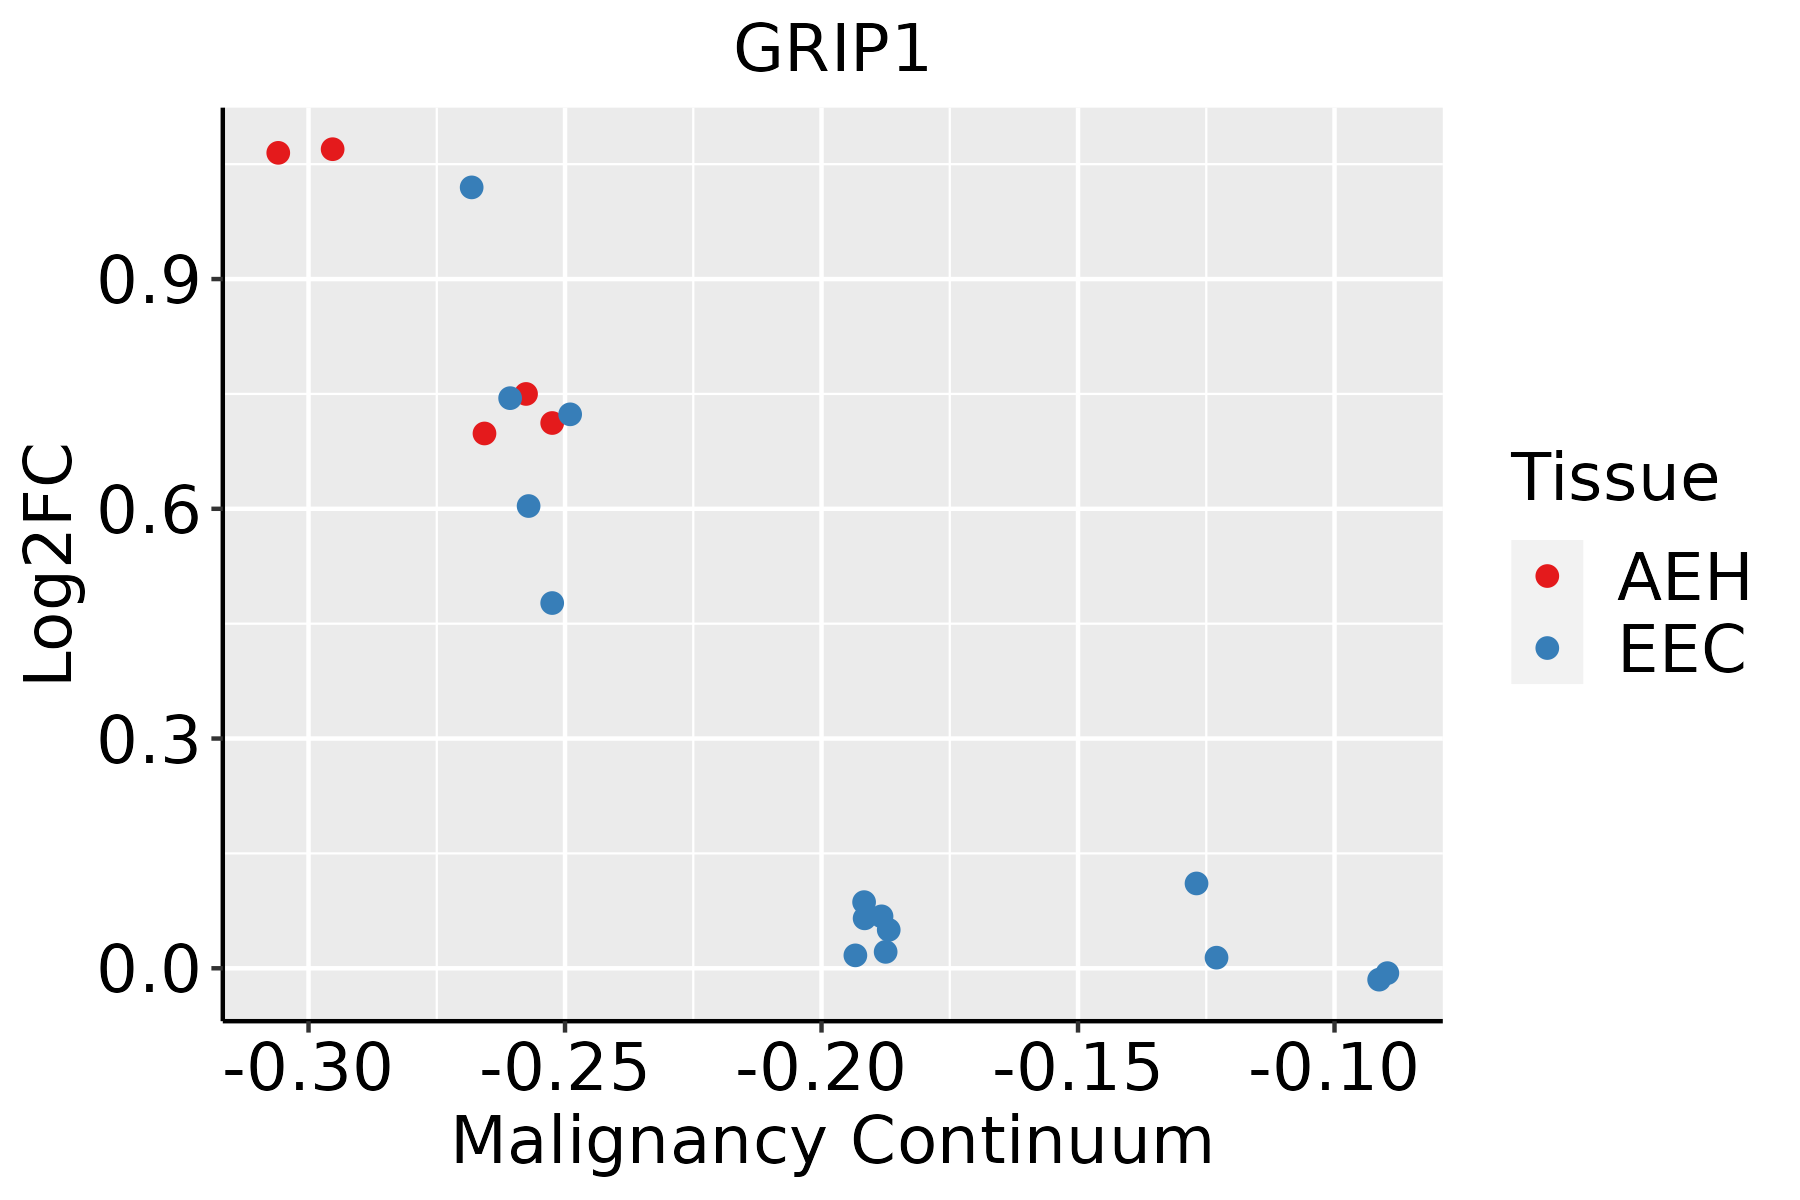
AEH: Atypical endometrial hyperplasia
EEC: Endometrioid Cancer
LungThe image shows the transcriptomic changes along malignancy continuum.log2FC in expression of this searched gene in stem-like cells from each diseased tissue sample relative to stem-like cells in normal samples in each tissue plotted against the malignancy continuum. Samples are colored based on if they are from different disease stage.AAH: Atypical adenomatous hyperplasia
AIS: Adenocarcinoma in situ
IAC: Invasive lung adenocarcinoma
MIA: Minimally invasive adenocarcinoma
ProstateThe image shows the transcriptomic changes along malignancy continuum.log2FC in expression of this searched gene in stem-like cells from each diseased tissue sample relative to stem-like cells in normal samples in each tissue plotted against the malignancy continuum. Samples are colored based on if they are from different disease stage.
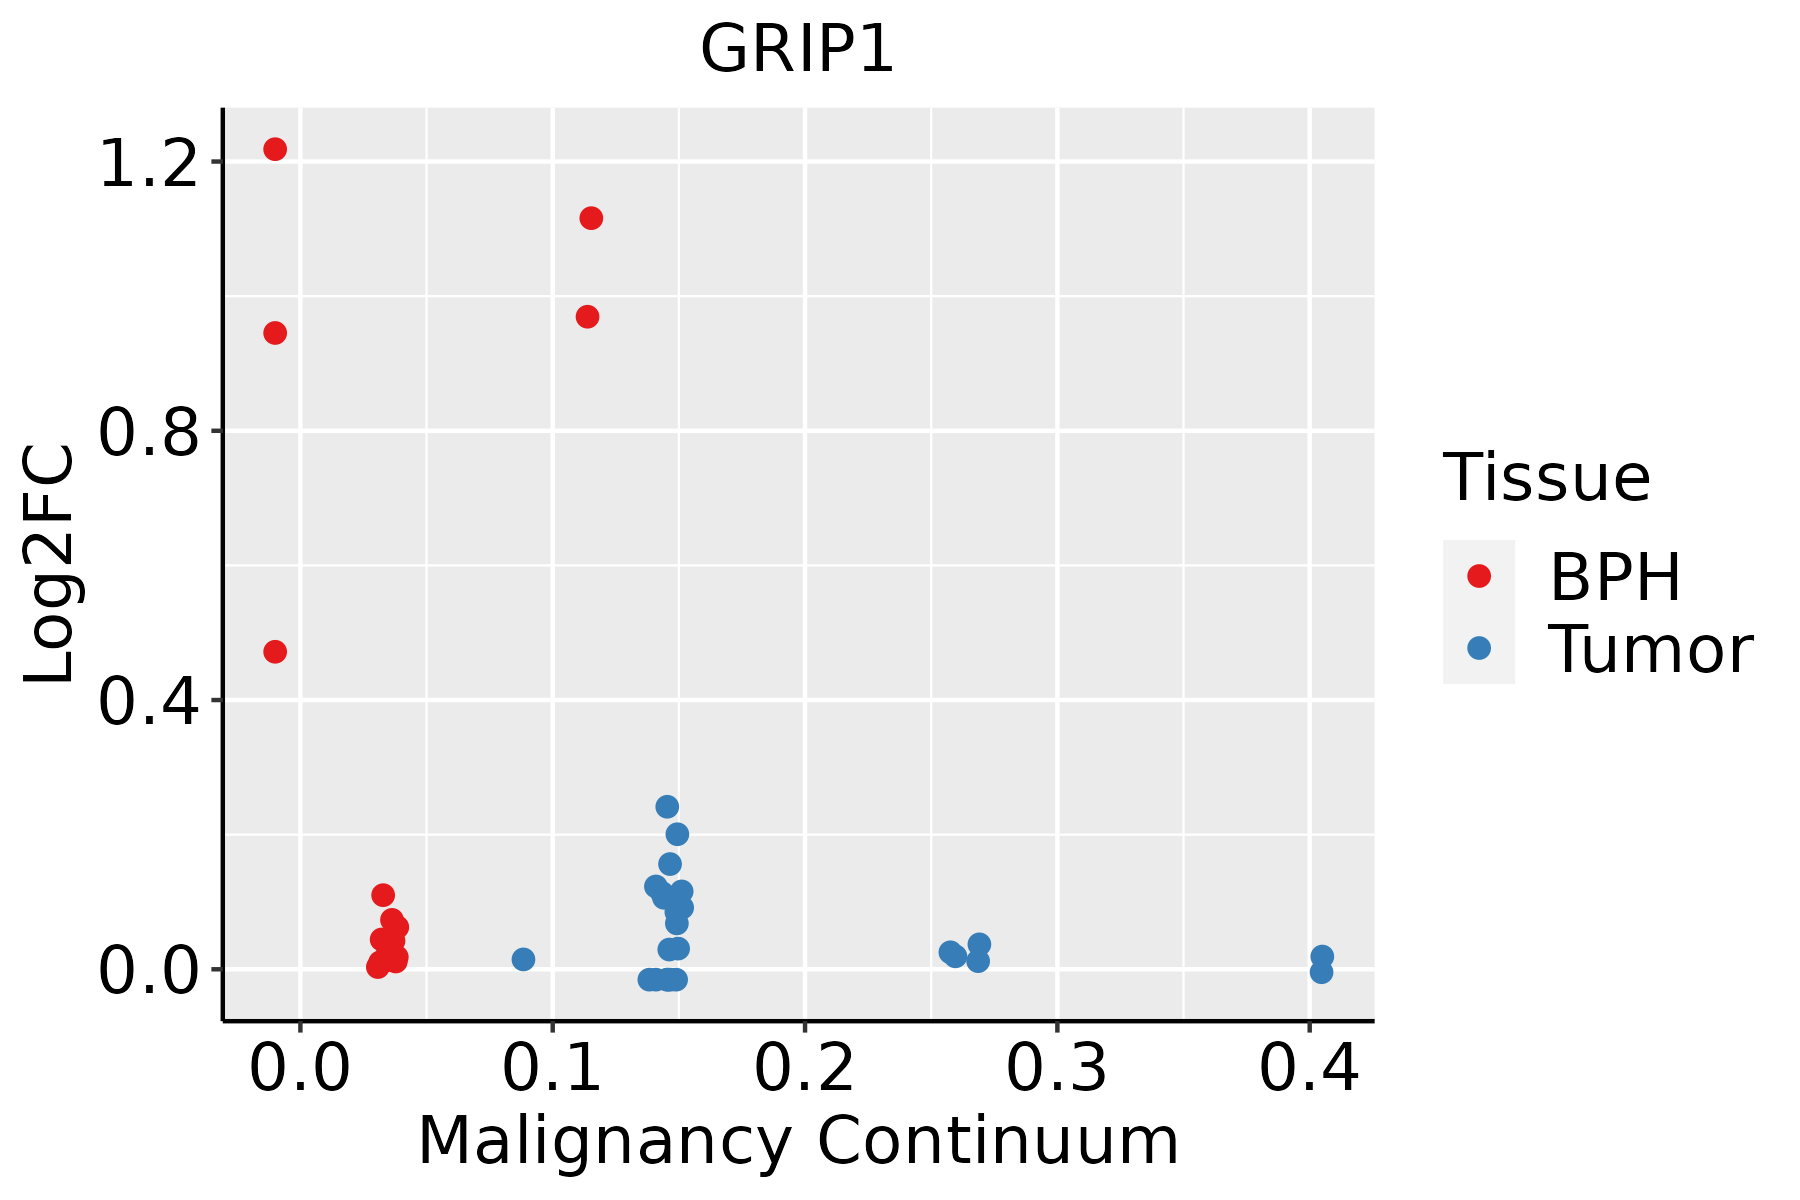
BPH: Benign Prostatic Hyperplasia
SkinThe image shows the transcriptomic changes along malignancy continuum.log2FC in expression of this searched gene in stem-like cells from each diseased tissue sample relative to stem-like cells in normal samples in each tissue plotted against the malignancy continuum. Samples are colored based on if they are from different disease stage.
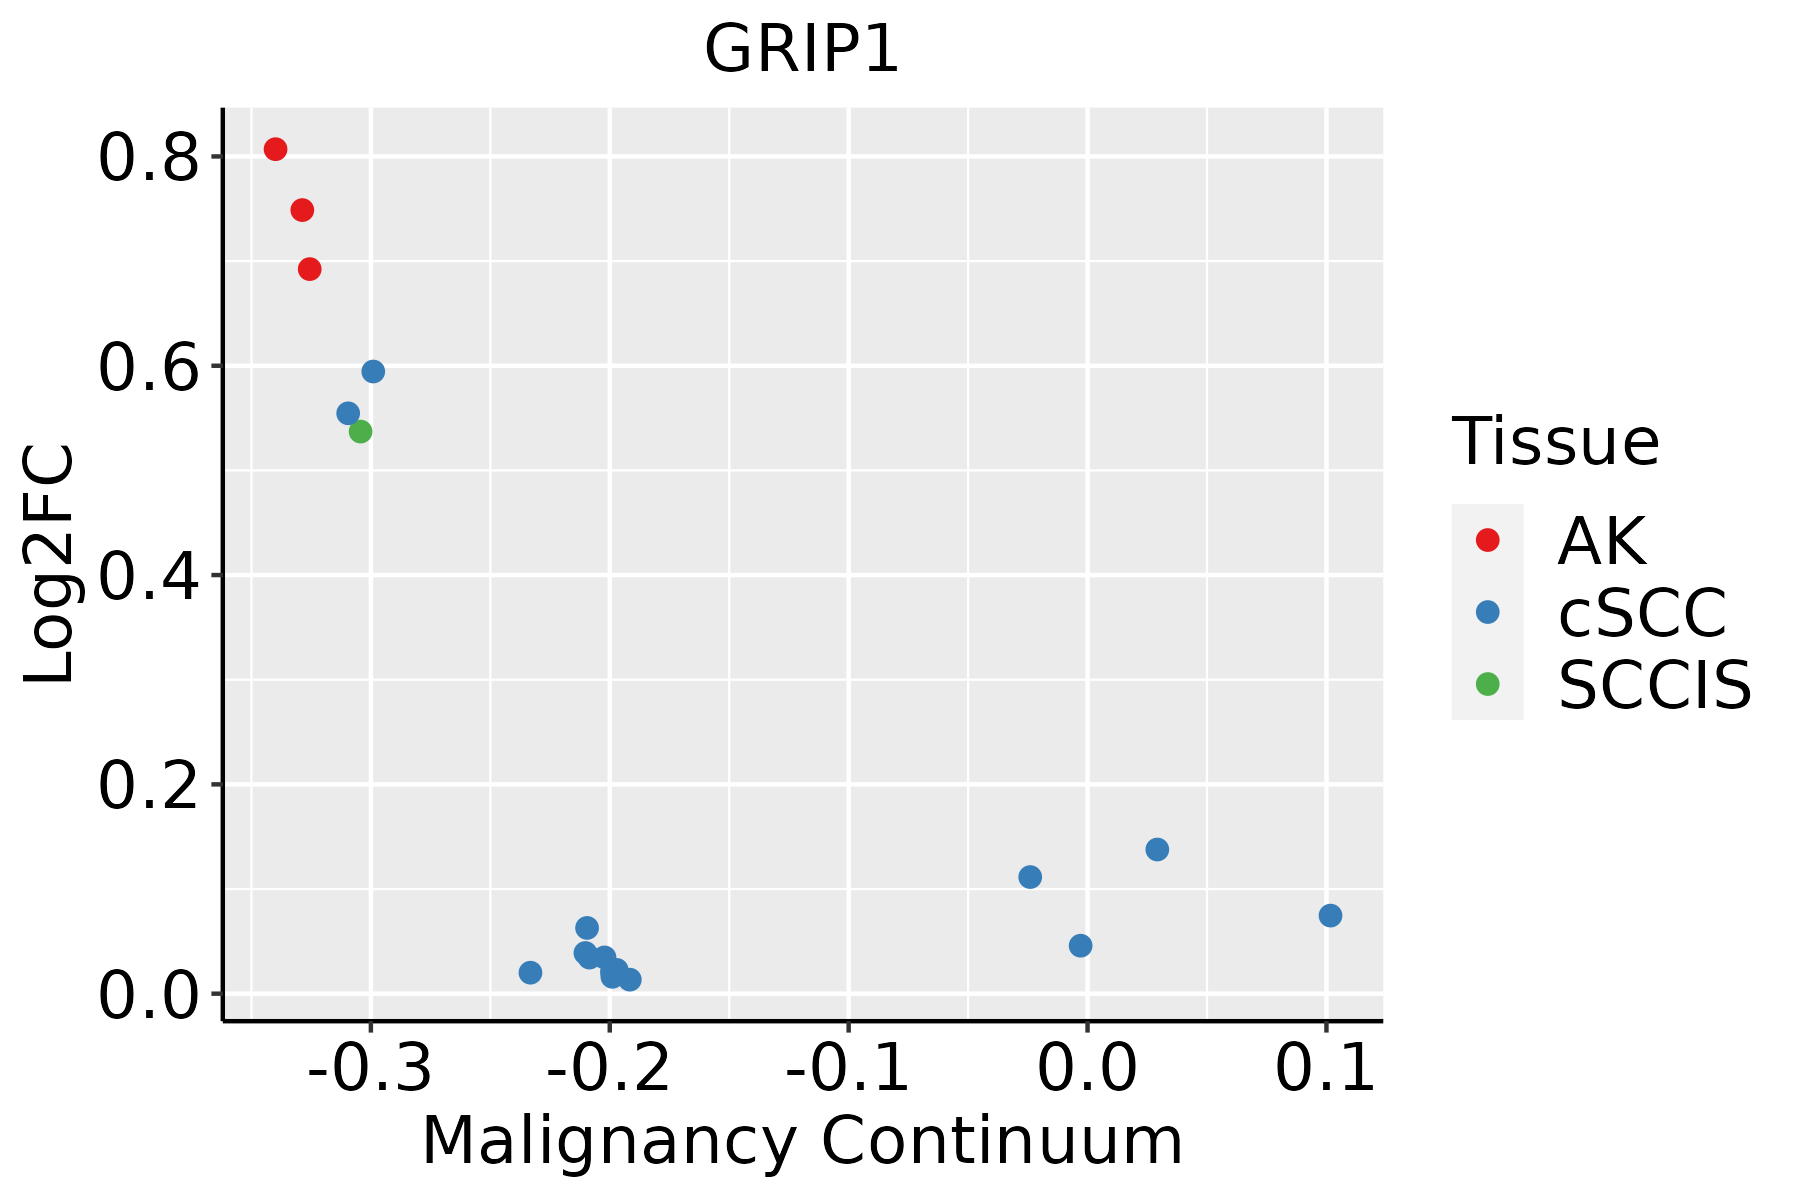
AK: Actinic keratosis
cSCC: Cutaneous squamous cell carcinoma
SCCIS:squamous cell carcinoma in situ
∗log2FC in expression of this searched gene in stem-like cells from each diseased tissue sample relative to stem-like cells in normal samples in each tissue plotted against the malignancy continuum. Samples are colored based on if they are from different disease stage.

Top

Malignant transformation related pathway analysis

check buttonFind out the enriched GO biological processes and KEGG pathways involved in transition from healthy to precancer to cancer
check button Figure of enriched GO biological processes.
TissueDisease StageEnriched GO biological Processes
ColorectumADGO analysis - Figure of enriched GO biological processes: Top 15 enriched GO BP terms are showed in the bar plot of each disease state in each tissue. Each row represents a significant GO biological process which is colored according to the -log10(p.adjust).
ColorectumSERGO analysis - Figure of enriched GO biological processes: Top 15 enriched GO BP terms are showed in the bar plot of each disease state in each tissue. Each row represents a significant GO biological process which is colored according to the -log10(p.adjust).
ColorectumMSSGO analysis - Figure of enriched GO biological processes: Top 15 enriched GO BP terms are showed in the bar plot of each disease state in each tissue. Each row represents a significant GO biological process which is colored according to the -log10(p.adjust).
ColorectumMSI-HGO analysis - Figure of enriched GO biological processes: Top 15 enriched GO BP terms are showed in the bar plot of each disease state in each tissue. Each row represents a significant GO biological process which is colored according to the -log10(p.adjust).
ColorectumFAPGO analysis - Figure of enriched GO biological processes: Top 15 enriched GO BP terms are showed in the bar plot of each disease state in each tissue. Each row represents a significant GO biological process which is colored according to the -log10(p.adjust).
∗Top 15 enriched GO BP terms are showed in the bar plot of each disease state in each tissue. Each row represents a significant GO biological process which is colored according to the -log10(p.adjust).
Page: 1 2 3 4 5 6 7 8 9 

check button Enriched GO biological processes.
GO IDTissueDisease StageDescriptionGene RatioBg Ratiopvaluep.adjustCount
GO:002260410CervixCCregulation of cell morphogenesis84/2311309/187231.00e-124.29e-1084
GO:007265910CervixCCprotein localization to plasma membrane73/2311284/187234.95e-106.73e-0873
GO:19907788CervixCCprotein localization to cell periphery78/2311333/187231.22e-089.73e-0778
GO:00163587CervixCCdendrite development58/2311243/187234.52e-071.76e-0558
GO:00313467CervixCCpositive regulation of cell projection organization72/2311353/187231.04e-052.32e-0472
GO:00988767CervixCCvesicle-mediated transport to the plasma membrane34/2311136/187233.75e-055.91e-0434
GO:00901509CervixCCestablishment of protein localization to membrane54/2311260/187237.67e-051.05e-0354
GO:00161977CervixCCendosomal transport48/2311230/187231.65e-041.97e-0348
GO:00619516CervixCCestablishment of protein localization to plasma membrane16/231160/187232.00e-031.46e-0216
GO:0072659ColorectumADprotein localization to plasma membrane122/3918284/187232.86e-171.49e-14122
GO:1990778ColorectumADprotein localization to cell periphery129/3918333/187235.51e-141.15e-11129
GO:0090150ColorectumADestablishment of protein localization to membrane100/3918260/187236.01e-116.33e-09100
GO:0016197ColorectumADendosomal transport90/3918230/187231.88e-101.73e-0890
GO:0022604ColorectumADregulation of cell morphogenesis109/3918309/187233.08e-092.07e-07109
GO:0098876ColorectumADvesicle-mediated transport to the plasma membrane57/3918136/187232.30e-081.27e-0657
GO:0061951ColorectumADestablishment of protein localization to plasma membrane31/391860/187231.37e-076.42e-0631
GO:0031346ColorectumADpositive regulation of cell projection organization104/3918353/187238.26e-051.30e-03104
GO:0032456ColorectumADendocytic recycling28/391873/187234.87e-045.30e-0328
GO:0016358ColorectumADdendrite development69/3918243/187233.32e-032.42e-0269
GO:1902414ColorectumADprotein localization to cell junction31/391894/187234.30e-032.95e-0231
Page: 1 2 3 4 5 6 7 8 9 10 

check button Enriched KEGG pathways.
Pathway IDTissueDisease StageDescriptionGene RatioBg Ratiopvaluep.adjustqvalueCount
Page: 1 

Top

Cell-cell communication analysis

check buttonIdentification of potential cell-cell interactions between two cell types and their ligand-receptor pairs for different disease states
LigandReceptorLRpairPathwayTissueDisease Stage
Page: 1 

Top

Single-cell gene regulatory network inference analysis

check buttonFind out the significant the regulons (TFs) and the target genes of each regulon across cell types for different disease states
TFCell TypeTissueDisease StageTarget GeneRSSRegulon Activity
∗The dot plots of a searched regulon are shown for all cell subpopulations in each disease state of each tissue based on the regulon specific score inferred using pySCENIC and by calculating the average expression.
Page: 1 

Top

Somatic mutation of malignant transformation related genes

check buttonAnnotation of somatic variants for genes involved in malignant transformation
Hugo SymbolVariant ClassVariant ClassificationdbSNP RSHGVScHGVSpHGVSp ShortSWISSPROTBIOTYPESIFTPolyPhenTumor Sample BarcodeTissueHistologySexAgeStageTherapy TypesDrugsOutcome
GRIP1SNVMissense_Mutationnovelc.2028G>Cp.Leu676Phep.L676FQ9Y3R0protein_codingdeleterious(0)probably_damaging(0.962)TCGA-5L-AAT1-01Breastbreast invasive carcinomaFemale<65III/IVHormone TherapyletrozolSD
GRIP1SNVMissense_Mutationc.1819G>Cp.Asp607Hisp.D607HQ9Y3R0protein_codingtolerated(0.05)benign(0.443)TCGA-A1-A0SI-01Breastbreast invasive carcinomaFemale<65I/IIUnknownUnknownSD
GRIP1SNVMissense_Mutationrs141923622c.644C>Tp.Thr215Metp.T215MQ9Y3R0protein_codingdeleterious(0)probably_damaging(0.918)TCGA-AN-A0AK-01Breastbreast invasive carcinomaFemale>=65I/IIUnknownUnknownSD
GRIP1SNVMissense_Mutationc.3211N>Ap.Glu1071Lysp.E1071KQ9Y3R0protein_codingdeleterious_low_confidence(0.03)benign(0.037)TCGA-C8-A1HM-01Breastbreast invasive carcinomaFemale>=65I/IIChemotherapydoxorubicinCR
GRIP1SNVMissense_Mutationrs753434168c.3209G>Ap.Arg1070Glnp.R1070QQ9Y3R0protein_codingtolerated_low_confidence(0.06)possibly_damaging(0.852)TCGA-PE-A5DC-01Breastbreast invasive carcinomaFemale>=65III/IVUnknownUnknownSD
GRIP1insertionFrame_Shift_Insnovelc.172_173insTGTGGGTp.Lys58MetfsTer18p.K58Mfs*18Q9Y3R0protein_codingTCGA-A8-A07R-01Breastbreast invasive carcinomaFemale>=65III/IVAncillaryzoledronicSD
GRIP1insertionNonsense_Mutationnovelc.170_171insTTTGCAGAAGTGACCAGCTGp.Met57IlefsTer5p.M57Ifs*5Q9Y3R0protein_codingTCGA-A8-A07R-01Breastbreast invasive carcinomaFemale>=65III/IVAncillaryzoledronicSD
GRIP1insertionFrame_Shift_Insnovelc.2725_2726insAAGATGTGTTAGATGTCTTGGGCCAGGATAAp.Arg909GlnfsTer29p.R909Qfs*29Q9Y3R0protein_codingTCGA-A8-A08H-01Breastbreast invasive carcinomaFemale>=65I/IIUnknownUnknownSD
GRIP1insertionNonsense_Mutationnovelc.2717_2718insATAGACAAATAGCAAGTATAAAAp.Ser906ArgfsTer2p.S906Rfs*2Q9Y3R0protein_codingTCGA-A8-A09C-01Breastbreast invasive carcinomaFemale>=65I/IIUnknownUnknownSD
GRIP1SNVMissense_Mutationnovelc.356N>Ap.Ser119Asnp.S119NQ9Y3R0protein_codingtolerated(0.24)benign(0.02)TCGA-2W-A8YY-01Cervixcervical & endocervical cancerFemale<65I/IIChemotherapycisplatinCR
Page: 1 2 3 4 5 6 7 8 9 10 11 12 13 

Top

Related drugs of malignant transformation related genes

check buttonIdentification of chemicals and drugs interact with genes involved in malignant transfromation
(DGIdb 4.0)
Entrez IDSymbolCategoryInteraction TypesDrug Claim NameDrug NamePMIDs
Page: 1