Schematic overview of the cellular and molecular mechanisms involved in the cancer progression, including the proposed cellular and molecular mechanisms in cancer cells trajectory. AT1: alveolar type 1 cells; AT2: alveolar type 2 cells; AAH: atypical adenomatous hyperplasia; AIS: adenocarcinoma in situ; MIA: minimally invasive adenocarcinoma; IA: invasive adenocarcinoma; EMT: epithelial-mesenchymal transition

Home

Download

Statistics

Help

Contact

Center for Computational Systems Medicine
leaf

Gene summary

leaf

Malignant transformation analysis

leaf

Malignant transformation related pathway analysis

leaf

Cell-cell communication analysis

leaf

Single-cell gene regulatory network inference analysis

leaf

Somatic mutation of malignant transformation related genes

leaf

Related drugs of malignant transformation related genes

Gene: GRINA

Gene summary for GRINA

check button Gene summary.

Gene informationSpeciesHuman
Gene symbol

GRINA

Gene ID

2907

Gene nameglutamate ionotropic receptor NMDA type subunit associated protein 1
Gene AliasHNRGW
Cytomap8q24.3
Gene Typeprotein-coding
GO ID

GO:0006873

UniProtAcc

Q7Z429


Top

Malignant transformation analysis

check button Identification of the aberrant gene expression in precancerous and cancerous lesions by comparing the gene expression of stem-like cells in diseased tissues with normal stem cells
check button Malignant transformation involving gene list.
Entrez IDSymbolReplicatesSpeciesOrganTissueAdj P-valueLog2FCMalignancy
2907GRINAGSM4909281HumanBreastIDC6.26e-053.37e-010.21
2907GRINAGSM4909287HumanBreastIDC2.87e-022.12e-010.2057
2907GRINAGSM4909293HumanBreastIDC1.52e-063.37e-010.1581
2907GRINAGSM4909296HumanBreastIDC6.02e-048.15e-020.1524
2907GRINAGSM4909297HumanBreastIDC2.50e-033.73e-020.1517
2907GRINAGSM4909298HumanBreastIDC2.83e-154.80e-010.1551
2907GRINAGSM4909304HumanBreastIDC5.89e-276.37e-010.1636
2907GRINAGSM4909305HumanBreastIDC1.90e-022.30e-010.0436
2907GRINAGSM4909306HumanBreastIDC2.64e-104.65e-010.1564
2907GRINAGSM4909308HumanBreastIDC2.57e-062.59e-010.158
2907GRINAGSM4909309HumanBreastIDC4.77e-032.09e-010.0483
2907GRINAGSM4909311HumanBreastIDC1.15e-283.42e-010.1534
2907GRINAGSM4909312HumanBreastIDC1.85e-123.79e-010.1552
2907GRINAGSM4909317HumanBreastIDC5.12e-174.59e-010.1355
2907GRINAGSM4909319HumanBreastIDC2.17e-312.72e-010.1563
2907GRINAGSM4909320HumanBreastIDC4.35e-032.50e-010.1575
2907GRINAGSM4909321HumanBreastIDC5.16e-152.73e-010.1559
2907GRINAM1HumanBreastIDC8.19e-073.10e-010.1577
2907GRINAP1HumanBreastIDC3.92e-03-4.64e-030.1527
2907GRINADCIS2HumanBreastDCIS1.05e-388.37e-020.0085
Page: 1 2 3 4 5 6 7 8 

check button Transcriptomic changes along malignancy continuum.
TissueExpression DynamicsAbbreviation
BreastThe image shows the transcriptomic changes along malignancy continuum.log2FC in expression of this searched gene in stem-like cells from each diseased tissue sample relative to stem-like cells in normal samples in each tissue plotted against the malignancy continuum. Samples are colored based on if they are from different disease stage.
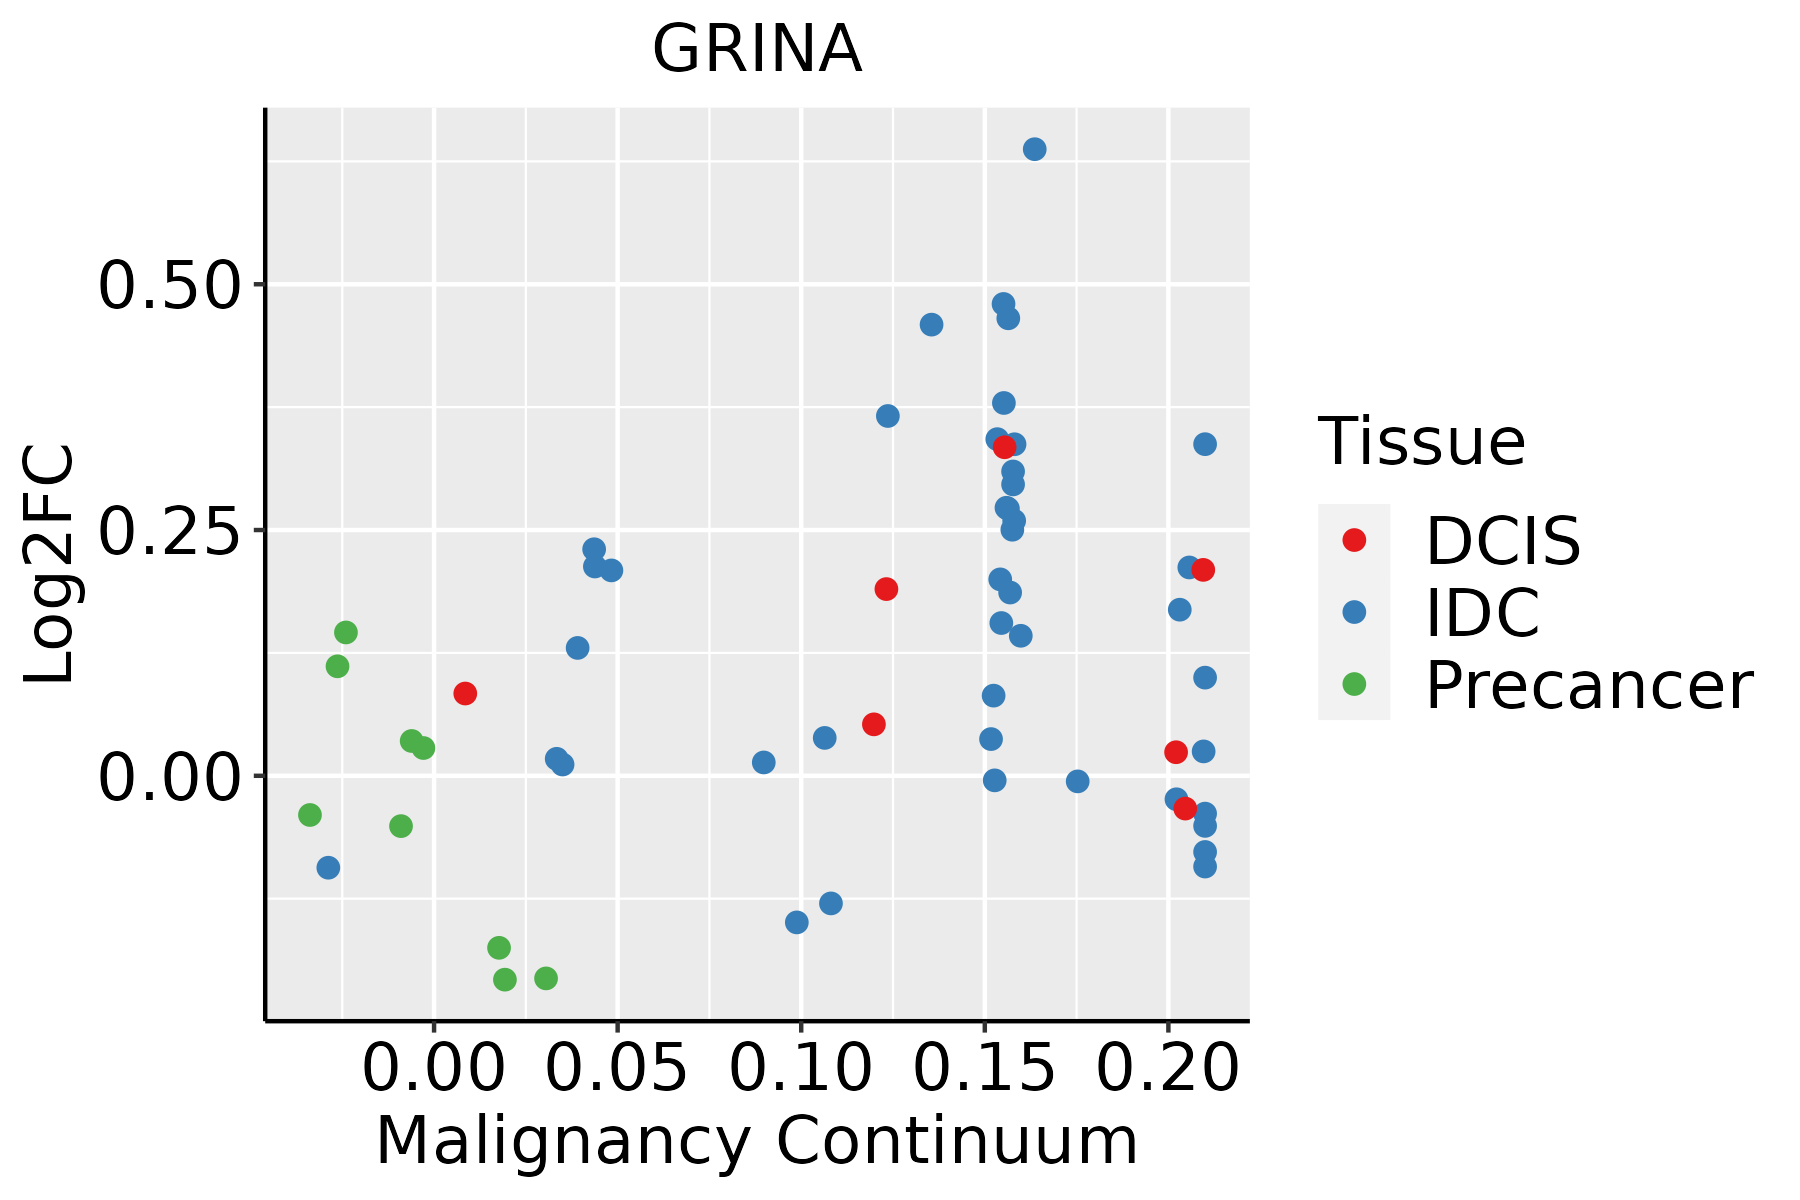
IDC: Invasive ductal carcinoma
DCIS: Ductal carcinoma in situ
Precancer(BRCA1-mut): Precancerous lesion from BRCA1 mutation carriers
Colorectum (GSE201348)The image shows the transcriptomic changes along malignancy continuum.log2FC in expression of this searched gene in stem-like cells from each diseased tissue sample relative to stem-like cells in normal samples in each tissue plotted against the malignancy continuum. Samples are colored based on if they are from different disease stage.FAP: Familial adenomatous polyposis
CRC: Colorectal cancer
Colorectum (HTA11)The image shows the transcriptomic changes along malignancy continuum.log2FC in expression of this searched gene in stem-like cells from each diseased tissue sample relative to stem-like cells in normal samples in each tissue plotted against the malignancy continuum. Samples are colored based on if they are from different disease stage.AD: Adenomas
SER: Sessile serrated lesions
MSI-H: Microsatellite-high colorectal cancer
MSS: Microsatellite stable colorectal cancer
EsophagusThe image shows the transcriptomic changes along malignancy continuum.log2FC in expression of this searched gene in stem-like cells from each diseased tissue sample relative to stem-like cells in normal samples in each tissue plotted against the malignancy continuum. Samples are colored based on if they are from different disease stage.ESCC: Esophageal squamous cell carcinoma
HGIN: High-grade intraepithelial neoplasias
LGIN: Low-grade intraepithelial neoplasias
LiverThe image shows the transcriptomic changes along malignancy continuum.log2FC in expression of this searched gene in stem-like cells from each diseased tissue sample relative to stem-like cells in normal samples in each tissue plotted against the malignancy continuum. Samples are colored based on if they are from different disease stage.
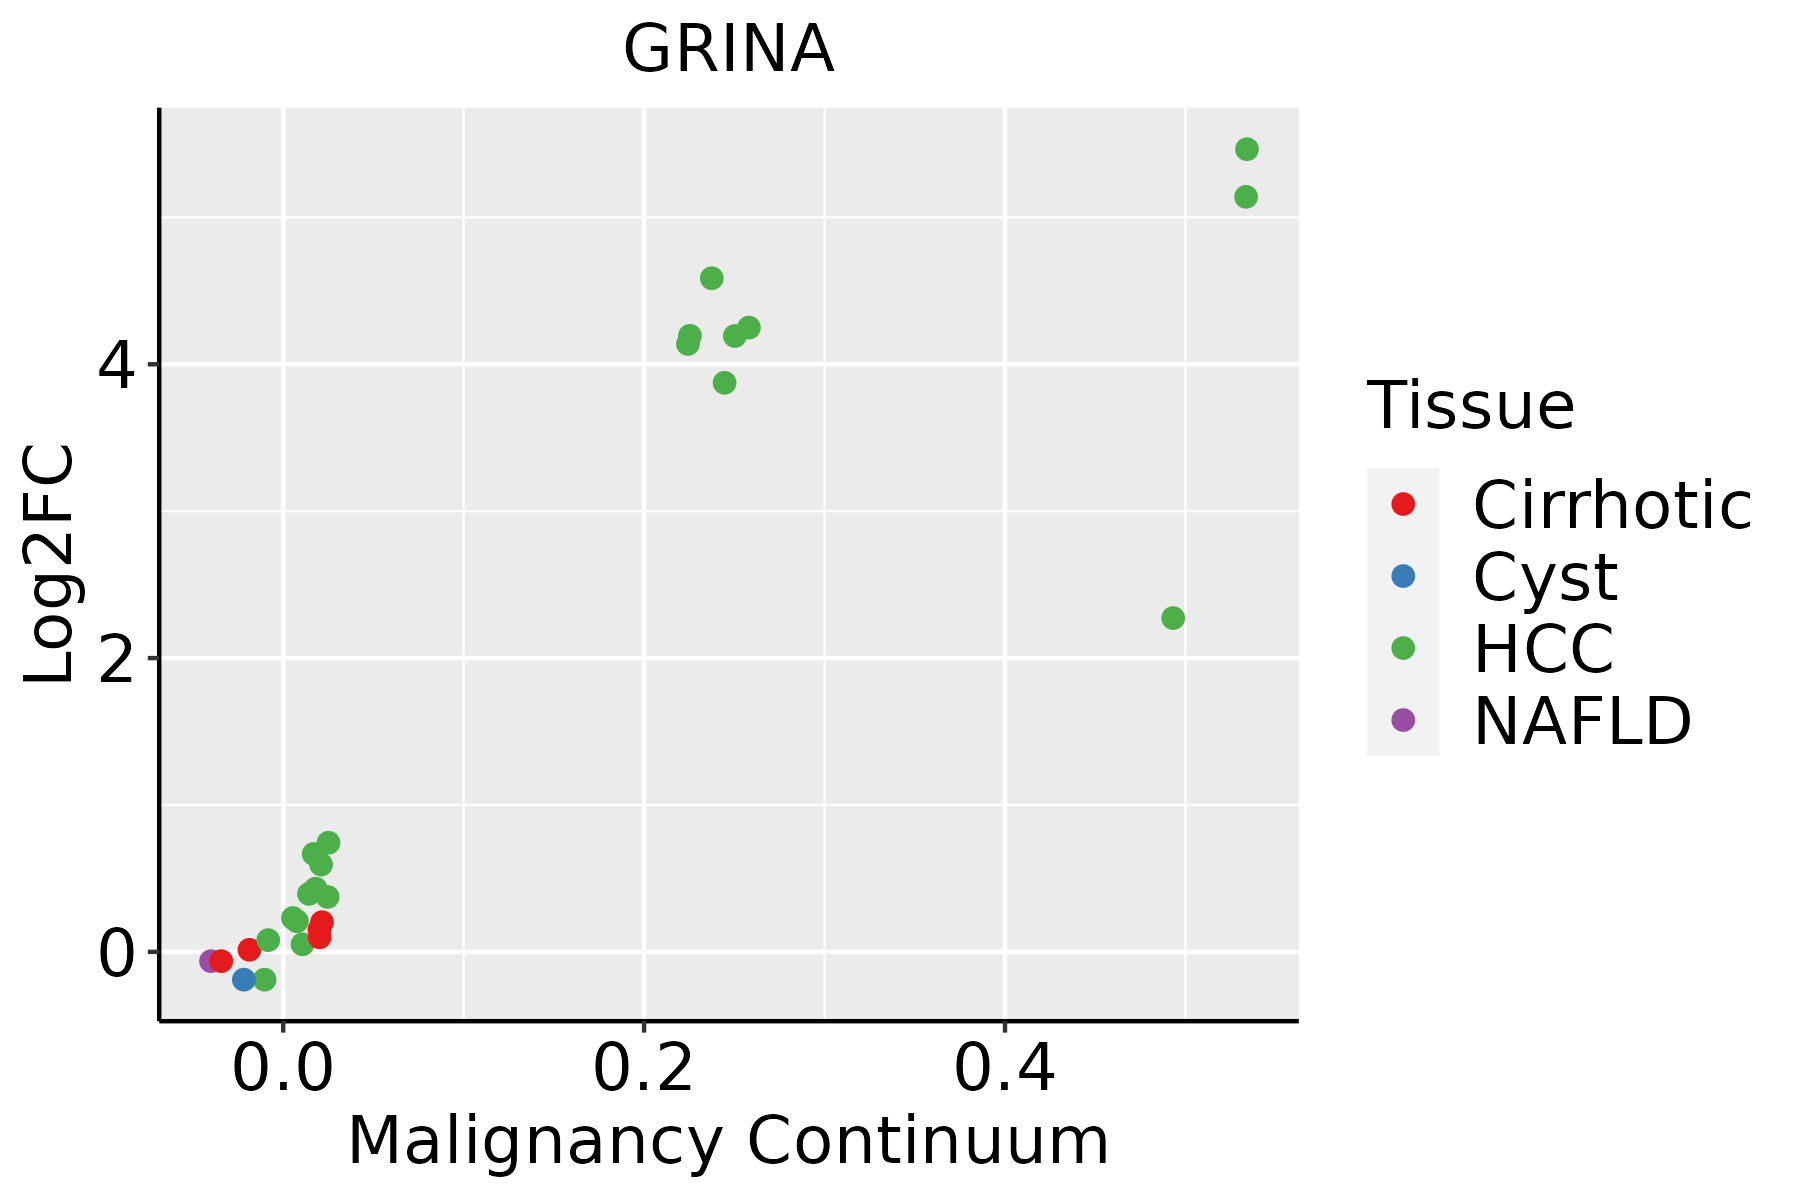
HCC: Hepatocellular carcinoma
NAFLD: Non-alcoholic fatty liver disease
Oral CavityThe image shows the transcriptomic changes along malignancy continuum.log2FC in expression of this searched gene in stem-like cells from each diseased tissue sample relative to stem-like cells in normal samples in each tissue plotted against the malignancy continuum. Samples are colored based on if they are from different disease stage.EOLP: Erosive Oral lichen planus
LP: leukoplakia
NEOLP: Non-erosive oral lichen planus
OSCC: Oral squamous cell carcinoma
ProstateThe image shows the transcriptomic changes along malignancy continuum.log2FC in expression of this searched gene in stem-like cells from each diseased tissue sample relative to stem-like cells in normal samples in each tissue plotted against the malignancy continuum. Samples are colored based on if they are from different disease stage.BPH: Benign Prostatic Hyperplasia
SkinThe image shows the transcriptomic changes along malignancy continuum.log2FC in expression of this searched gene in stem-like cells from each diseased tissue sample relative to stem-like cells in normal samples in each tissue plotted against the malignancy continuum. Samples are colored based on if they are from different disease stage.
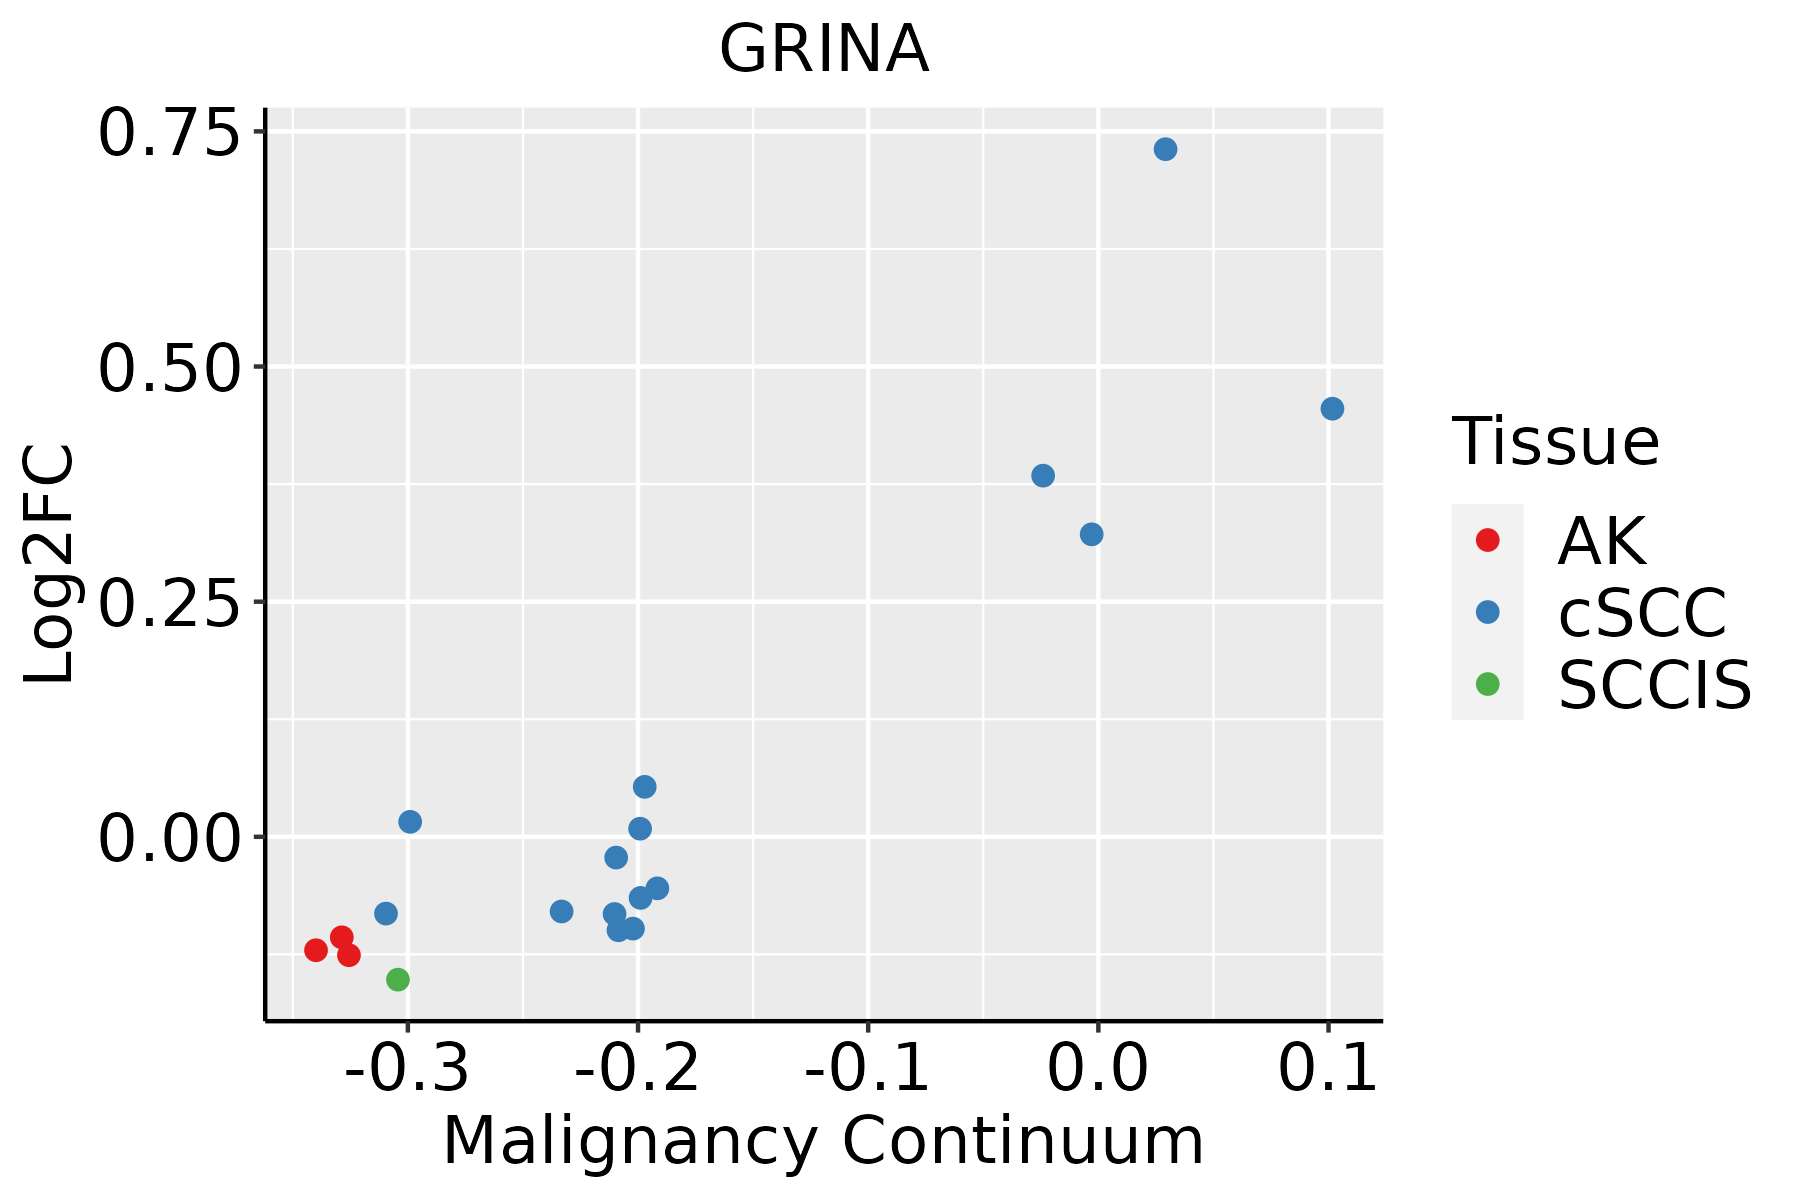
AK: Actinic keratosis
cSCC: Cutaneous squamous cell carcinoma
SCCIS:squamous cell carcinoma in situ
ThyroidThe image shows the transcriptomic changes along malignancy continuum.log2FC in expression of this searched gene in stem-like cells from each diseased tissue sample relative to stem-like cells in normal samples in each tissue plotted against the malignancy continuum. Samples are colored based on if they are from different disease stage.
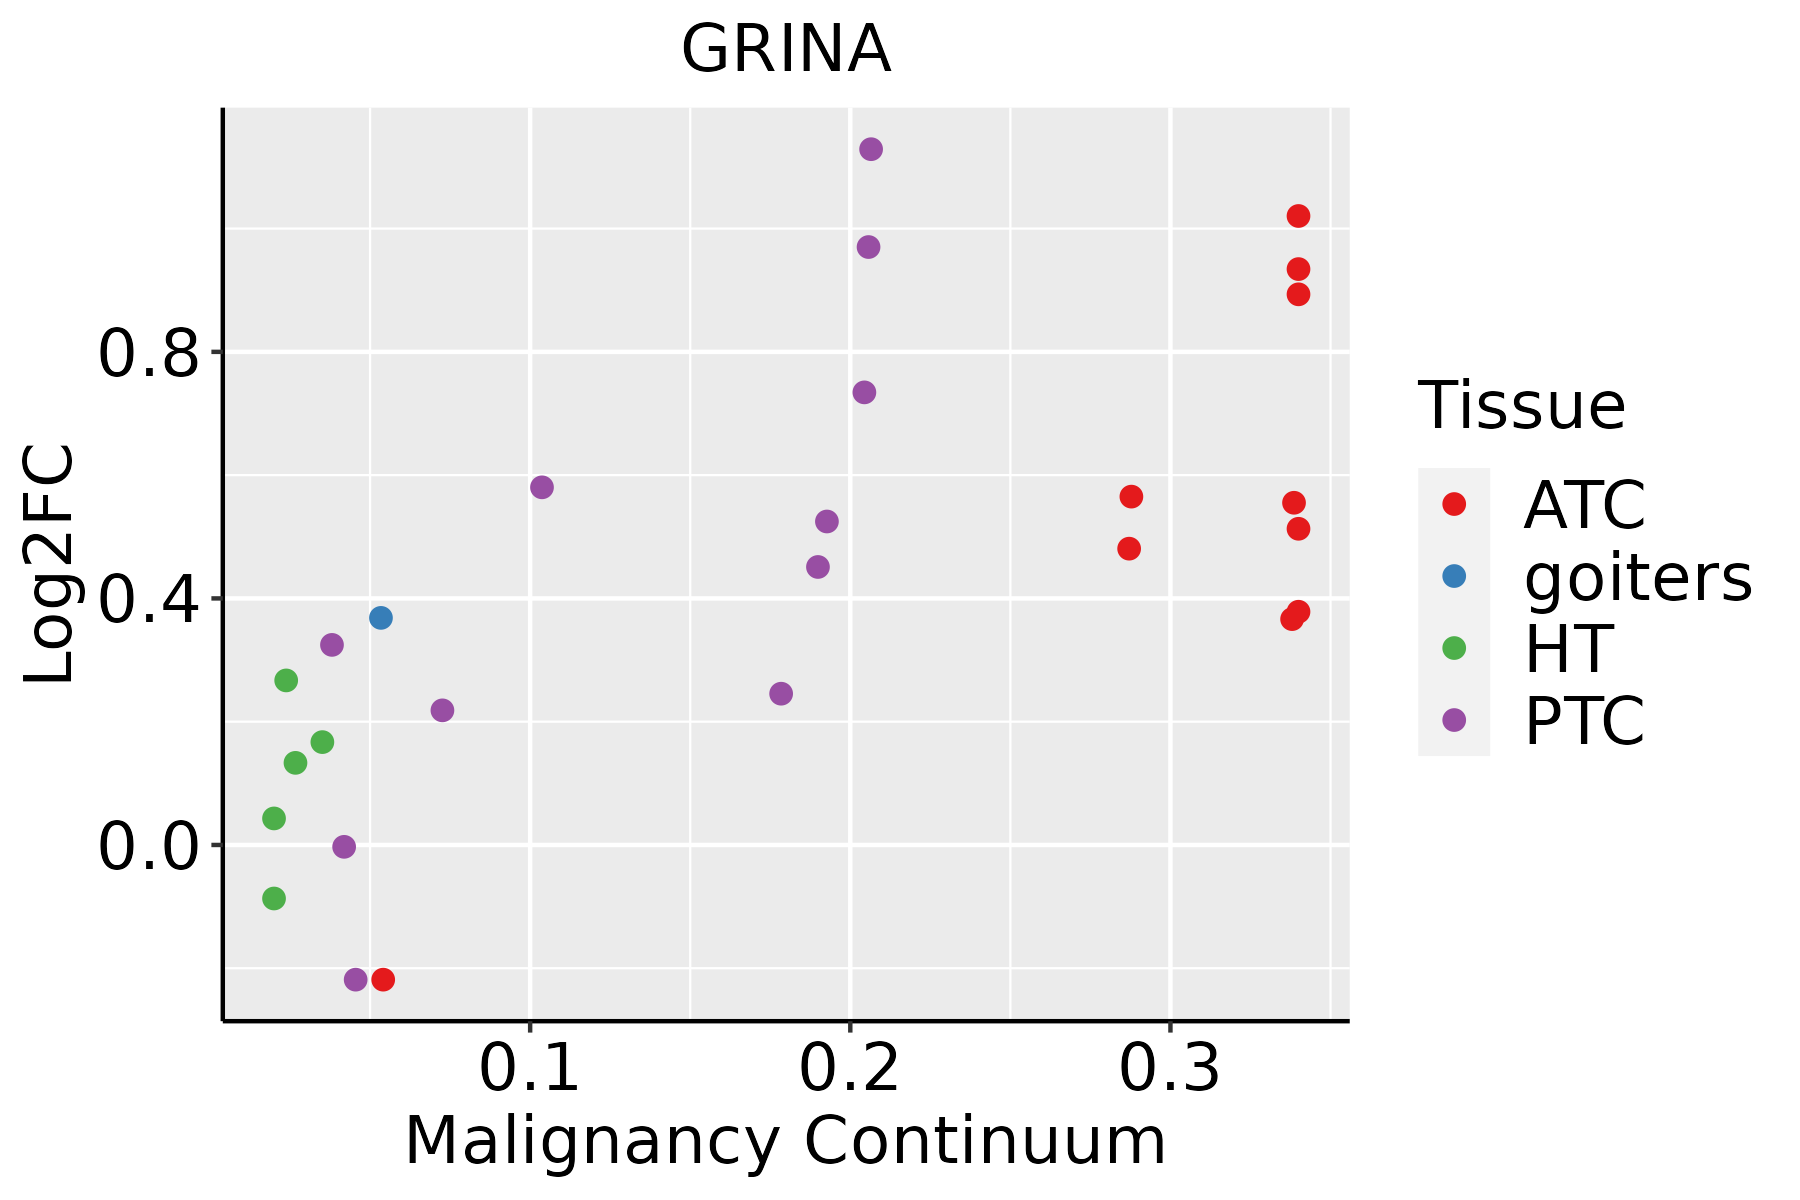
ATC: Anaplastic thyroid cancer
HT: Hashimoto's thyroiditis
PTC: Papillary thyroid cancer
∗log2FC in expression of this searched gene in stem-like cells from each diseased tissue sample relative to stem-like cells in normal samples in each tissue plotted against the malignancy continuum. Samples are colored based on if they are from different disease stage.

Top

Malignant transformation related pathway analysis

check buttonFind out the enriched GO biological processes and KEGG pathways involved in transition from healthy to precancer to cancer
check button Figure of enriched GO biological processes.
TissueDisease StageEnriched GO biological Processes
ColorectumADGO analysis - Figure of enriched GO biological processes: Top 15 enriched GO BP terms are showed in the bar plot of each disease state in each tissue. Each row represents a significant GO biological process which is colored according to the -log10(p.adjust).
ColorectumSERGO analysis - Figure of enriched GO biological processes: Top 15 enriched GO BP terms are showed in the bar plot of each disease state in each tissue. Each row represents a significant GO biological process which is colored according to the -log10(p.adjust).
ColorectumMSSGO analysis - Figure of enriched GO biological processes: Top 15 enriched GO BP terms are showed in the bar plot of each disease state in each tissue. Each row represents a significant GO biological process which is colored according to the -log10(p.adjust).
ColorectumMSI-HGO analysis - Figure of enriched GO biological processes: Top 15 enriched GO BP terms are showed in the bar plot of each disease state in each tissue. Each row represents a significant GO biological process which is colored according to the -log10(p.adjust).
ColorectumFAPGO analysis - Figure of enriched GO biological processes: Top 15 enriched GO BP terms are showed in the bar plot of each disease state in each tissue. Each row represents a significant GO biological process which is colored according to the -log10(p.adjust).
∗Top 15 enriched GO BP terms are showed in the bar plot of each disease state in each tissue. Each row represents a significant GO biological process which is colored according to the -log10(p.adjust).
Page: 1 2 3 4 5 6 7 8 9 

check button Enriched GO biological processes.
GO IDTissueDisease StageDescriptionGene RatioBg Ratiopvaluep.adjustCount
GO:200123314BreastIDCregulation of apoptotic signaling pathway82/1434356/187236.27e-205.93e-1782
GO:009719314BreastIDCintrinsic apoptotic signaling pathway69/1434288/187236.32e-182.99e-1569
GO:200124214BreastIDCregulation of intrinsic apoptotic signaling pathway47/1434164/187238.25e-162.93e-1347
GO:200123414BreastIDCnegative regulation of apoptotic signaling pathway49/1434224/187231.45e-112.58e-0949
GO:200124314BreastIDCnegative regulation of intrinsic apoptotic signaling pathway27/143498/187232.91e-092.50e-0727
GO:003497614BreastIDCresponse to endoplasmic reticulum stress43/1434256/187238.42e-073.82e-0543
GO:190589714BreastIDCregulation of response to endoplasmic reticulum stress19/143482/187231.04e-052.87e-0419
GO:190357313BreastIDCnegative regulation of response to endoplasmic reticulum stress13/143444/187231.62e-054.05e-0413
GO:007005914BreastIDCintrinsic apoptotic signaling pathway in response to endoplasmic reticulum stress14/143463/187232.37e-043.75e-0314
GO:003246913BreastIDCendoplasmic reticulum calcium ion homeostasis8/143425/187233.85e-045.40e-038
GO:190223614BreastIDCnegative regulation of endoplasmic reticulum stress-induced intrinsic apoptotic signaling pathway7/143420/187234.85e-046.42e-037
GO:19022355BreastIDCregulation of endoplasmic reticulum stress-induced intrinsic apoptotic signaling pathway8/143432/187232.32e-032.10e-028
GO:200123324BreastDCISregulation of apoptotic signaling pathway81/1390356/187233.51e-203.31e-1781
GO:009719324BreastDCISintrinsic apoptotic signaling pathway68/1390288/187234.93e-182.33e-1568
GO:200124224BreastDCISregulation of intrinsic apoptotic signaling pathway47/1390164/187232.49e-169.38e-1447
GO:200123424BreastDCISnegative regulation of apoptotic signaling pathway48/1390224/187231.70e-113.22e-0948
GO:200124322BreastDCISnegative regulation of intrinsic apoptotic signaling pathway27/139098/187231.48e-091.42e-0727
GO:003497622BreastDCISresponse to endoplasmic reticulum stress43/1390256/187233.65e-071.71e-0543
GO:190589722BreastDCISregulation of response to endoplasmic reticulum stress19/139082/187236.65e-061.86e-0419
GO:190357322BreastDCISnegative regulation of response to endoplasmic reticulum stress13/139044/187231.16e-052.98e-0413
Page: 1 2 3 4 5 6 7 8 9 10 

check button Enriched KEGG pathways.
Pathway IDTissueDisease StageDescriptionGene RatioBg Ratiopvaluep.adjustqvalueCount
Page: 1 

Top

Cell-cell communication analysis

check buttonIdentification of potential cell-cell interactions between two cell types and their ligand-receptor pairs for different disease states
LigandReceptorLRpairPathwayTissueDisease Stage
Page: 1 

Top

Single-cell gene regulatory network inference analysis

check buttonFind out the significant the regulons (TFs) and the target genes of each regulon across cell types for different disease states
TFCell TypeTissueDisease StageTarget GeneRSSRegulon Activity
∗The dot plots of a searched regulon are shown for all cell subpopulations in each disease state of each tissue based on the regulon specific score inferred using pySCENIC and by calculating the average expression.
Page: 1 

Top

Somatic mutation of malignant transformation related genes

check buttonAnnotation of somatic variants for genes involved in malignant transformation
Hugo SymbolVariant ClassVariant ClassificationdbSNP RSHGVScHGVSpHGVSp ShortSWISSPROTBIOTYPESIFTPolyPhenTumor Sample BarcodeTissueHistologySexAgeStageTherapy TypesDrugsOutcome
GRINASNVMissense_Mutationc.658T>Gp.Phe220Valp.F220VQ7Z429protein_codingtolerated(0.29)benign(0.031)TCGA-E9-A1ND-01Breastbreast invasive carcinomaFemale>=65I/IIHormone TherapyaromasinSD
GRINAinsertionFrame_Shift_Insnovelc.17_18insTp.Leu8PhefsTer119p.L8Ffs*119Q7Z429protein_codingTCGA-2W-A8YY-01Cervixcervical & endocervical cancerFemale<65I/IIChemotherapycisplatinCR
GRINASNVMissense_Mutationrs560551768c.73C>Gp.Pro25Alap.P25AQ7Z429protein_codingdeleterious(0.05)benign(0.098)TCGA-AZ-4313-01Colorectumcolon adenocarcinomaFemale<65I/IIUnknownUnknownSD
GRINASNVMissense_Mutationc.302A>Gp.Gln101Argp.Q101RQ7Z429protein_codingtolerated(0.26)possibly_damaging(0.901)TCGA-NH-A5IV-01Colorectumcolon adenocarcinomaFemale>=65I/IIUnknownUnknownSD
GRINASNVMissense_Mutationrs782307051c.487N>Tp.Arg163Cysp.R163CQ7Z429protein_codingdeleterious(0)probably_damaging(0.998)TCGA-AX-A06F-01Endometriumuterine corpus endometrioid carcinomaFemale<65III/IVChemotherapycarboplatinSD
GRINASNVMissense_Mutationrs200050797c.560N>Tp.Ala187Valp.A187VQ7Z429protein_codingtolerated(0.06)benign(0.327)TCGA-AX-A1C9-01Endometriumuterine corpus endometrioid carcinomaFemale>=65I/IIUnknownUnknownSD
GRINASNVMissense_Mutationrs560551768c.73C>Gp.Pro25Alap.P25AQ7Z429protein_codingdeleterious(0.05)benign(0.098)TCGA-B5-A0JU-01Endometriumuterine corpus endometrioid carcinomaFemale<65I/IIUnknownUnknownSD
GRINASNVMissense_Mutationnovelc.488G>Ap.Arg163Hisp.R163HQ7Z429protein_codingdeleterious(0)probably_damaging(0.995)TCGA-EO-A22U-01Endometriumuterine corpus endometrioid carcinomaFemale>=65I/IIUnknownUnknownSD
GRINASNVMissense_Mutationrs560551768c.73C>Gp.Pro25Alap.P25AQ7Z429protein_codingdeleterious(0.05)benign(0.098)TCGA-EO-A3KX-01Endometriumuterine corpus endometrioid carcinomaFemale>=65I/IIUnknownUnknownSD
GRINASNVMissense_Mutationnovelc.15N>Tp.Lys5Asnp.K5NQ7Z429protein_codingdeleterious_low_confidence(0)possibly_damaging(0.505)TCGA-EY-A1GI-01Endometriumuterine corpus endometrioid carcinomaFemale<65I/IIUnknownUnknownSD
Page: 1 2 3 

Top

Related drugs of malignant transformation related genes

check buttonIdentification of chemicals and drugs interact with genes involved in malignant transfromation
(DGIdb 4.0)
Entrez IDSymbolCategoryInteraction TypesDrug Claim NameDrug NamePMIDs
Page: 1