
|
|||||
|
 | |
| |
| |
| |
| |
| |
|
Gene: GRIN2B |
Gene summary for GRIN2B |
| Gene information | Species | Human | Gene symbol | GRIN2B | Gene ID | 2904 |
| Gene name | glutamate ionotropic receptor NMDA type subunit 2B | |
| Gene Alias | DEE27 | |
| Cytomap | 12p13.1 | |
| Gene Type | protein-coding | GO ID | GO:0003008 | UniProtAcc | Q13224 |
Top |
Malignant transformation analysis |
| Identification of the aberrant gene expression in precancerous and cancerous lesions by comparing the gene expression of stem-like cells in diseased tissues with normal stem cells |
| Entrez ID | Symbol | Replicates | Species | Organ | Tissue | Adj P-value | Log2FC | Malignancy |
| 2904 | GRIN2B | HTA11_3410_2000001011 | Human | Colorectum | AD | 2.64e-27 | 7.11e-01 | 0.0155 |
| 2904 | GRIN2B | HTA11_2951_2000001011 | Human | Colorectum | AD | 3.56e-06 | 6.49e-01 | 0.0216 |
| 2904 | GRIN2B | HTA11_1938_2000001011 | Human | Colorectum | AD | 8.75e-25 | 1.12e+00 | -0.0811 |
| 2904 | GRIN2B | HTA11_78_2000001011 | Human | Colorectum | AD | 1.91e-10 | 4.39e-01 | -0.1088 |
| 2904 | GRIN2B | HTA11_1391_2000001011 | Human | Colorectum | AD | 1.85e-33 | 1.63e+00 | -0.059 |
| 2904 | GRIN2B | HTA11_866_3004761011 | Human | Colorectum | AD | 5.04e-10 | 4.03e-01 | 0.096 |
| 2904 | GRIN2B | HTA11_10711_2000001011 | Human | Colorectum | AD | 1.63e-12 | 6.57e-01 | 0.0338 |
| 2904 | GRIN2B | HTA11_7696_3000711011 | Human | Colorectum | AD | 7.40e-54 | 1.23e+00 | 0.0674 |
| 2904 | GRIN2B | HTA11_6818_2000001021 | Human | Colorectum | AD | 4.73e-21 | 8.55e-01 | 0.0588 |
| 2904 | GRIN2B | HTA11_99999970781_79442 | Human | Colorectum | MSS | 1.60e-06 | 3.56e-01 | 0.294 |
| 2904 | GRIN2B | HTA11_99999965062_69753 | Human | Colorectum | MSI-H | 1.30e-15 | 2.00e+00 | 0.3487 |
| 2904 | GRIN2B | HTA11_99999965104_69814 | Human | Colorectum | MSS | 6.10e-18 | 8.26e-01 | 0.281 |
| 2904 | GRIN2B | HTA11_99999971662_82457 | Human | Colorectum | MSS | 8.82e-30 | 9.04e-01 | 0.3859 |
| 2904 | GRIN2B | HTA11_99999973899_84307 | Human | Colorectum | MSS | 3.51e-05 | 4.52e-01 | 0.2585 |
| 2904 | GRIN2B | F007 | Human | Colorectum | FAP | 1.18e-30 | 1.19e+00 | 0.1176 |
| 2904 | GRIN2B | A002-C-010 | Human | Colorectum | FAP | 4.58e-69 | 1.30e+00 | 0.242 |
| 2904 | GRIN2B | A001-C-207 | Human | Colorectum | FAP | 1.71e-27 | 9.92e-01 | 0.1278 |
| 2904 | GRIN2B | A015-C-203 | Human | Colorectum | FAP | 1.58e-03 | 4.64e-01 | -0.1294 |
| 2904 | GRIN2B | A015-C-204 | Human | Colorectum | FAP | 2.97e-02 | 3.81e-01 | -0.0228 |
| 2904 | GRIN2B | A002-C-201 | Human | Colorectum | FAP | 1.34e-19 | 7.87e-01 | 0.0324 |
| Page: 1 2 3 |
| Tissue | Expression Dynamics | Abbreviation |
| Colorectum (GSE201348) |  | FAP: Familial adenomatous polyposis |
| CRC: Colorectal cancer | ||
| Colorectum (HTA11) |  | AD: Adenomas |
| SER: Sessile serrated lesions | ||
| MSI-H: Microsatellite-high colorectal cancer | ||
| MSS: Microsatellite stable colorectal cancer | ||
| Liver | 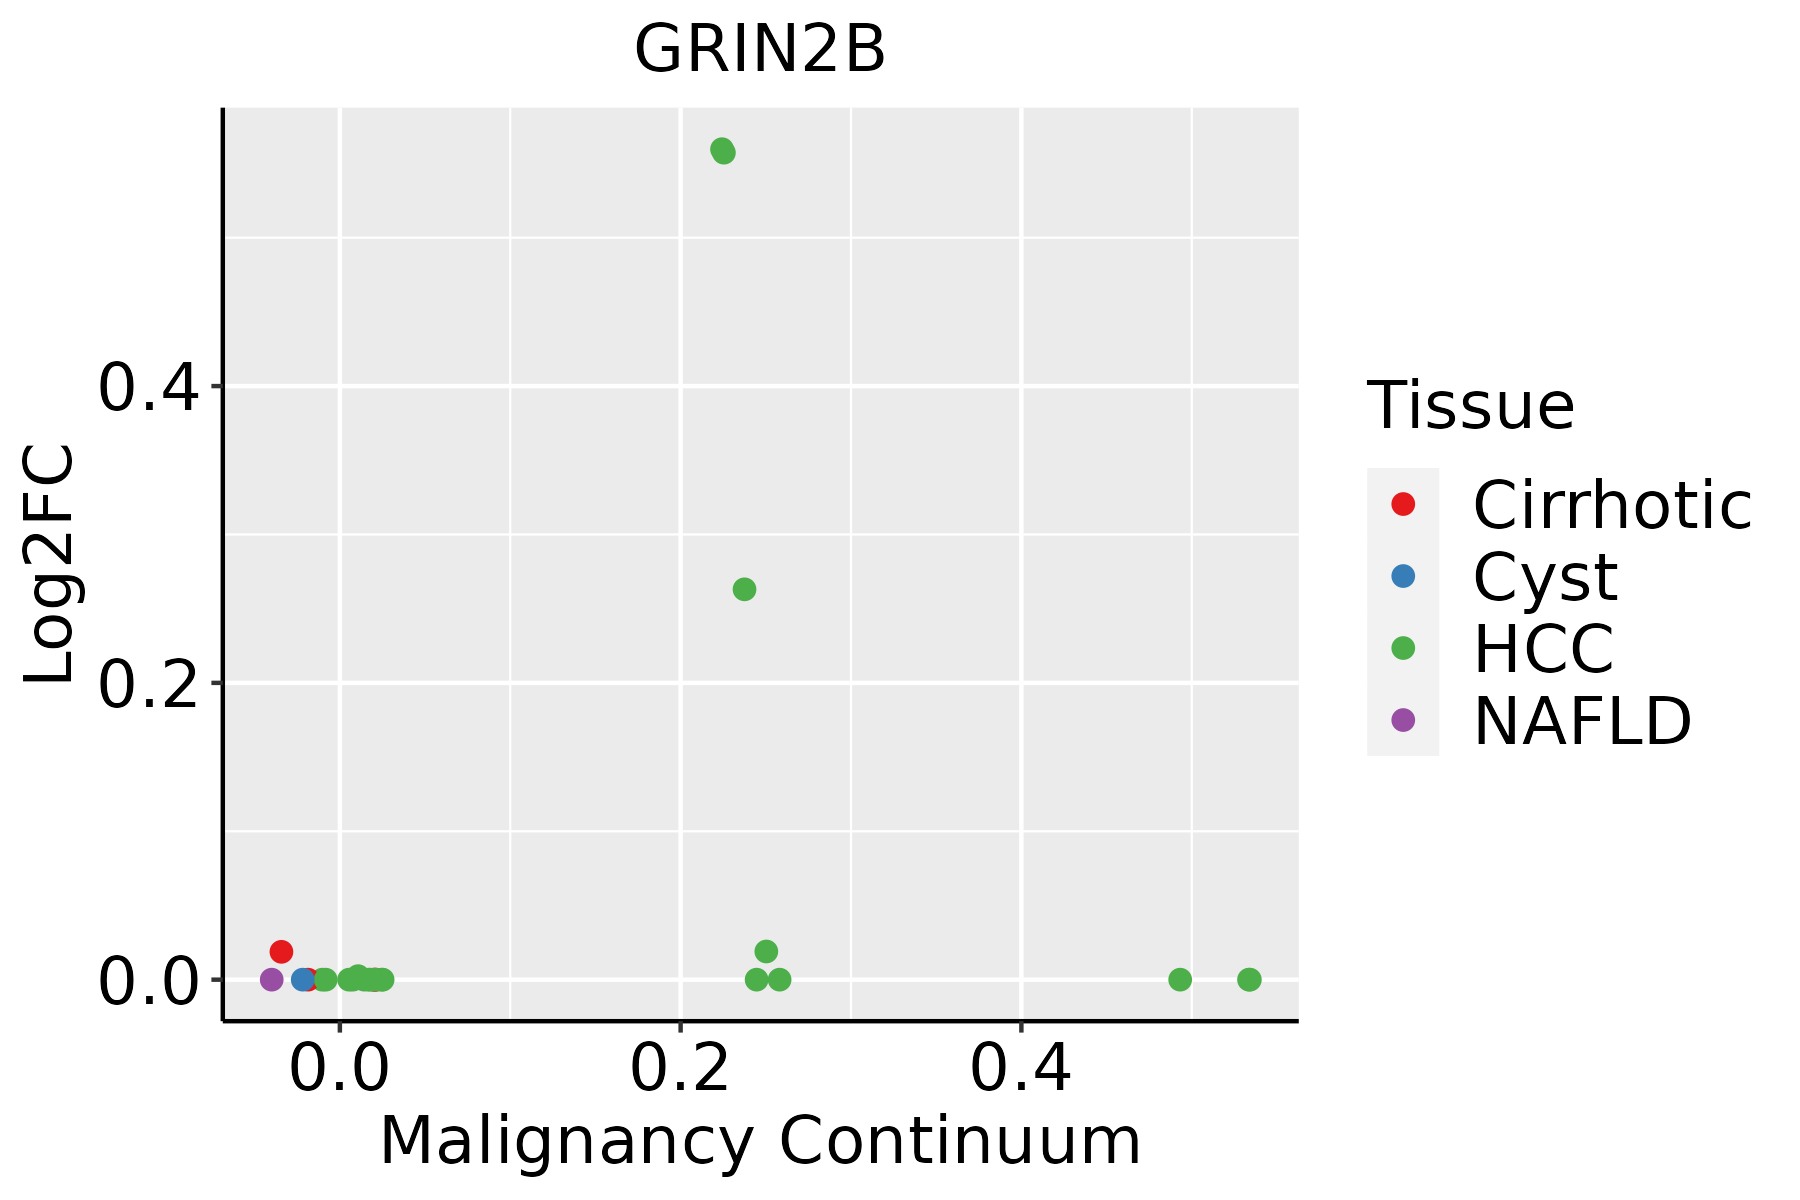 | HCC: Hepatocellular carcinoma |
| NAFLD: Non-alcoholic fatty liver disease |
| ∗log2FC in expression of this searched gene in stem-like cells from each diseased tissue sample relative to stem-like cells in normal samples in each tissue plotted against the malignancy continuum. Samples are colored based on if they are from different disease stage. |
Top |
Malignant transformation related pathway analysis |
| Find out the enriched GO biological processes and KEGG pathways involved in transition from healthy to precancer to cancer |
| Tissue | Disease Stage | Enriched GO biological Processes |
| Colorectum | AD |  |
| Colorectum | SER |  |
| Colorectum | MSS |  |
| Colorectum | MSI-H |  |
| Colorectum | FAP |  |
| ∗Top 15 enriched GO BP terms are showed in the bar plot of each disease state in each tissue. Each row represents a significant GO biological process which is colored according to the -log10(p.adjust). |
| Page: 1 2 3 4 5 6 7 8 9 |
| GO ID | Tissue | Disease Stage | Description | Gene Ratio | Bg Ratio | pvalue | p.adjust | Count |
| GO:0045862 | Colorectum | AD | positive regulation of proteolysis | 129/3918 | 372/18723 | 4.04e-10 | 3.46e-08 | 129 |
| GO:0070997 | Colorectum | AD | neuron death | 114/3918 | 361/18723 | 1.13e-06 | 3.72e-05 | 114 |
| GO:2000116 | Colorectum | AD | regulation of cysteine-type endopeptidase activity | 79/3918 | 235/18723 | 3.74e-06 | 1.03e-04 | 79 |
| GO:0052547 | Colorectum | AD | regulation of peptidase activity | 137/3918 | 461/18723 | 4.12e-06 | 1.12e-04 | 137 |
| GO:0010952 | Colorectum | AD | positive regulation of peptidase activity | 68/3918 | 197/18723 | 6.30e-06 | 1.59e-04 | 68 |
| GO:1901214 | Colorectum | AD | regulation of neuron death | 99/3918 | 319/18723 | 1.26e-05 | 2.76e-04 | 99 |
| GO:0106027 | Colorectum | AD | neuron projection organization | 36/3918 | 93/18723 | 6.58e-05 | 1.07e-03 | 36 |
| GO:0052548 | Colorectum | AD | regulation of endopeptidase activity | 124/3918 | 432/18723 | 6.58e-05 | 1.07e-03 | 124 |
| GO:0043954 | Colorectum | AD | cellular component maintenance | 26/3918 | 61/18723 | 1.04e-04 | 1.56e-03 | 26 |
| GO:0010950 | Colorectum | AD | positive regulation of endopeptidase activity | 59/3918 | 179/18723 | 1.11e-04 | 1.65e-03 | 59 |
| GO:0097061 | Colorectum | AD | dendritic spine organization | 31/3918 | 84/18723 | 5.48e-04 | 5.83e-03 | 31 |
| GO:0031345 | Colorectum | AD | negative regulation of cell projection organization | 58/3918 | 186/18723 | 6.37e-04 | 6.58e-03 | 58 |
| GO:2001056 | Colorectum | AD | positive regulation of cysteine-type endopeptidase activity | 47/3918 | 148/18723 | 1.30e-03 | 1.14e-02 | 47 |
| GO:0099173 | Colorectum | AD | postsynapse organization | 51/3918 | 168/18723 | 2.47e-03 | 1.90e-02 | 51 |
| GO:1901216 | Colorectum | AD | positive regulation of neuron death | 32/3918 | 97/18723 | 3.74e-03 | 2.63e-02 | 32 |
| GO:0097305 | Colorectum | AD | response to alcohol | 71/3918 | 253/18723 | 4.01e-03 | 2.80e-02 | 71 |
| GO:0050808 | Colorectum | AD | synapse organization | 112/3918 | 426/18723 | 4.25e-03 | 2.92e-02 | 112 |
| GO:0050807 | Colorectum | AD | regulation of synapse organization | 60/3918 | 211/18723 | 5.67e-03 | 3.64e-02 | 60 |
| GO:0097062 | Colorectum | AD | dendritic spine maintenance | 10/3918 | 21/18723 | 5.71e-03 | 3.64e-02 | 10 |
| GO:00458622 | Colorectum | MSS | positive regulation of proteolysis | 119/3467 | 372/18723 | 2.14e-10 | 2.09e-08 | 119 |
| Page: 1 2 3 4 5 |
| Pathway ID | Tissue | Disease Stage | Description | Gene Ratio | Bg Ratio | pvalue | p.adjust | qvalue | Count |
| hsa05010 | Colorectum | AD | Alzheimer disease | 174/2092 | 384/8465 | 1.82e-19 | 9.26e-18 | 5.91e-18 | 174 |
| hsa05016 | Colorectum | AD | Huntington disease | 147/2092 | 306/8465 | 1.93e-19 | 9.26e-18 | 5.91e-18 | 147 |
| hsa05020 | Colorectum | AD | Prion disease | 133/2092 | 273/8465 | 2.47e-18 | 8.29e-17 | 5.29e-17 | 133 |
| hsa05014 | Colorectum | AD | Amyotrophic lateral sclerosis | 164/2092 | 364/8465 | 4.28e-18 | 1.27e-16 | 8.09e-17 | 164 |
| hsa05022 | Colorectum | AD | Pathways of neurodegeneration - multiple diseases | 201/2092 | 476/8465 | 4.54e-18 | 1.27e-16 | 8.09e-17 | 201 |
| hsa05017 | Colorectum | AD | Spinocerebellar ataxia | 60/2092 | 143/8465 | 3.78e-06 | 4.35e-05 | 2.78e-05 | 60 |
| hsa04015 | Colorectum | AD | Rap1 signaling pathway | 71/2092 | 210/8465 | 1.72e-03 | 9.68e-03 | 6.18e-03 | 71 |
| hsa04728 | Colorectum | AD | Dopaminergic synapse | 46/2092 | 132/8465 | 5.55e-03 | 2.48e-02 | 1.58e-02 | 46 |
| hsa04720 | Colorectum | AD | Long-term potentiation | 26/2092 | 67/8465 | 7.26e-03 | 2.97e-02 | 1.89e-02 | 26 |
| hsa050101 | Colorectum | AD | Alzheimer disease | 174/2092 | 384/8465 | 1.82e-19 | 9.26e-18 | 5.91e-18 | 174 |
| hsa050161 | Colorectum | AD | Huntington disease | 147/2092 | 306/8465 | 1.93e-19 | 9.26e-18 | 5.91e-18 | 147 |
| hsa050201 | Colorectum | AD | Prion disease | 133/2092 | 273/8465 | 2.47e-18 | 8.29e-17 | 5.29e-17 | 133 |
| hsa050141 | Colorectum | AD | Amyotrophic lateral sclerosis | 164/2092 | 364/8465 | 4.28e-18 | 1.27e-16 | 8.09e-17 | 164 |
| hsa050221 | Colorectum | AD | Pathways of neurodegeneration - multiple diseases | 201/2092 | 476/8465 | 4.54e-18 | 1.27e-16 | 8.09e-17 | 201 |
| hsa050171 | Colorectum | AD | Spinocerebellar ataxia | 60/2092 | 143/8465 | 3.78e-06 | 4.35e-05 | 2.78e-05 | 60 |
| hsa040151 | Colorectum | AD | Rap1 signaling pathway | 71/2092 | 210/8465 | 1.72e-03 | 9.68e-03 | 6.18e-03 | 71 |
| hsa047281 | Colorectum | AD | Dopaminergic synapse | 46/2092 | 132/8465 | 5.55e-03 | 2.48e-02 | 1.58e-02 | 46 |
| hsa047201 | Colorectum | AD | Long-term potentiation | 26/2092 | 67/8465 | 7.26e-03 | 2.97e-02 | 1.89e-02 | 26 |
| hsa050104 | Colorectum | MSS | Alzheimer disease | 169/1875 | 384/8465 | 1.21e-22 | 1.01e-20 | 6.21e-21 | 169 |
| hsa050164 | Colorectum | MSS | Huntington disease | 141/1875 | 306/8465 | 2.90e-21 | 1.62e-19 | 9.92e-20 | 141 |
| Page: 1 2 3 4 5 |
Top |
Cell-cell communication analysis |
| Identification of potential cell-cell interactions between two cell types and their ligand-receptor pairs for different disease states |
| Ligand | Receptor | LRpair | Pathway | Tissue | Disease Stage |
| Page: 1 |
Top |
Single-cell gene regulatory network inference analysis |
| Find out the significant the regulons (TFs) and the target genes of each regulon across cell types for different disease states |
| TF | Cell Type | Tissue | Disease Stage | Target Gene | RSS | Regulon Activity |
| ∗The dot plots of a searched regulon are shown for all cell subpopulations in each disease state of each tissue based on the regulon specific score inferred using pySCENIC and by calculating the average expression. |
| Page: 1 |
Top |
Somatic mutation of malignant transformation related genes |
| Annotation of somatic variants for genes involved in malignant transformation |
| Hugo Symbol | Variant Class | Variant Classification | dbSNP RS | HGVSc | HGVSp | HGVSp Short | SWISSPROT | BIOTYPE | SIFT | PolyPhen | Tumor Sample Barcode | Tissue | Histology | Sex | Age | Stage | Therapy Types | Drugs | Outcome |
| GRIN2B | SNV | Missense_Mutation | novel | c.1778N>C | p.Arg593Thr | p.R593T | Q13224 | protein_coding | deleterious(0) | benign(0.034) | TCGA-3C-AALI-01 | Breast | breast invasive carcinoma | Female | <65 | I/II | Unspecific | Poly E | Complete Response |
| GRIN2B | SNV | Missense_Mutation | rs772027875 | c.4203N>A | p.Ser1401Arg | p.S1401R | Q13224 | protein_coding | tolerated(0.22) | benign(0.012) | TCGA-A2-A1G0-01 | Breast | breast invasive carcinoma | Female | <65 | I/II | Chemotherapy | taxotere | SD |
| GRIN2B | SNV | Missense_Mutation | c.1010N>C | p.Arg337Thr | p.R337T | Q13224 | protein_coding | deleterious(0) | benign(0.398) | TCGA-A8-A06Z-01 | Breast | breast invasive carcinoma | Female | >=65 | I/II | Unknown | Unknown | SD | |
| GRIN2B | SNV | Missense_Mutation | rs672601378 | c.1619N>A | p.Arg540His | p.R540H | Q13224 | protein_coding | deleterious(0) | probably_damaging(0.956) | TCGA-AN-A04D-01 | Breast | breast invasive carcinoma | Female | <65 | I/II | Unknown | Unknown | SD |
| GRIN2B | SNV | Missense_Mutation | novel | c.3791N>C | p.Asp1264Ala | p.D1264A | Q13224 | protein_coding | tolerated(0.69) | benign(0.005) | TCGA-AR-A1AP-01 | Breast | breast invasive carcinoma | Female | >=65 | I/II | Hormone Therapy | anastrozole | SD |
| GRIN2B | SNV | Missense_Mutation | c.2309N>T | p.Ser770Phe | p.S770F | Q13224 | protein_coding | deleterious(0) | probably_damaging(0.915) | TCGA-BH-A0B1-01 | Breast | breast invasive carcinoma | Female | >=65 | I/II | Chemotherapy | adriamycin | SD | |
| GRIN2B | SNV | Missense_Mutation | c.2282G>T | p.Gly761Val | p.G761V | Q13224 | protein_coding | deleterious(0.01) | probably_damaging(0.988) | TCGA-BH-A0EE-01 | Breast | breast invasive carcinoma | Female | >=65 | I/II | Chemotherapy | docetaxel | SD | |
| GRIN2B | SNV | Missense_Mutation | c.1747G>C | p.Val583Leu | p.V583L | Q13224 | protein_coding | tolerated(0.21) | benign(0.034) | TCGA-BH-A0H5-01 | Breast | breast invasive carcinoma | Female | <65 | I/II | Chemotherapy | cytoxan | CR | |
| GRIN2B | SNV | Missense_Mutation | c.3896G>A | p.Arg1299His | p.R1299H | Q13224 | protein_coding | tolerated(0.11) | benign(0.011) | TCGA-D8-A13Z-01 | Breast | breast invasive carcinoma | Female | <65 | I/II | Chemotherapy | doxorubicine | SD | |
| GRIN2B | SNV | Missense_Mutation | c.4021N>C | p.Glu1341Gln | p.E1341Q | Q13224 | protein_coding | tolerated(0.1) | possibly_damaging(0.707) | TCGA-D8-A1J9-01 | Breast | breast invasive carcinoma | Female | <65 | I/II | Unknown | Unknown | SD |
| Page: 1 2 3 4 5 6 7 8 9 10 11 12 13 14 15 16 17 18 19 20 21 22 23 24 25 26 27 28 29 |
Top |
Related drugs of malignant transformation related genes |
| Identification of chemicals and drugs interact with genes involved in malignant transfromation |
| (DGIdb 4.0) |
| Entrez ID | Symbol | Category | Interaction Types | Drug Claim Name | Drug Name | PMIDs |
| 2904 | GRIN2B | CELL SURFACE, ION CHANNEL, DRUGGABLE GENOME | blocker | 178101077 | ||
| 2904 | GRIN2B | CELL SURFACE, ION CHANNEL, DRUGGABLE GENOME | CERC-301 | RISLENEMDAZ | ||
| 2904 | GRIN2B | CELL SURFACE, ION CHANNEL, DRUGGABLE GENOME | quetiapine | QUETIAPINE | 23859574 | |
| 2904 | GRIN2B | CELL SURFACE, ION CHANNEL, DRUGGABLE GENOME | antagonist | CHEMBL2106798 | NERAMEXANE MESYLATE | |
| 2904 | GRIN2B | CELL SURFACE, ION CHANNEL, DRUGGABLE GENOME | antagonist | CHEMBL182066 | RADIPRODIL | |
| 2904 | GRIN2B | CELL SURFACE, ION CHANNEL, DRUGGABLE GENOME | Neu-2000 | |||
| 2904 | GRIN2B | CELL SURFACE, ION CHANNEL, DRUGGABLE GENOME | blocker | 135650617 | DIZOCILPINE | |
| 2904 | GRIN2B | CELL SURFACE, ION CHANNEL, DRUGGABLE GENOME | ELIPRODIL | ELIPRODIL | ||
| 2904 | GRIN2B | CELL SURFACE, ION CHANNEL, DRUGGABLE GENOME | CNS-5161 | CNS-5161 | ||
| 2904 | GRIN2B | CELL SURFACE, ION CHANNEL, DRUGGABLE GENOME | CHEMBL1714 | KETAMINE HYDROCHLORIDE |
| Page: 1 2 3 4 5 6 7 8 9 |

Copyright 2023-Present -The University of Texas Health Science Center at Houston |