
|
|||||
|
 | |
| |
| |
| |
| |
| |
|
Gene: GRIK2 |
Gene summary for GRIK2 |
| Gene information | Species | Human | Gene symbol | GRIK2 | Gene ID | 2898 |
| Gene name | glutamate ionotropic receptor kainate type subunit 2 | |
| Gene Alias | EAA4 | |
| Cytomap | 6q16.3 | |
| Gene Type | protein-coding | GO ID | GO:0003008 | UniProtAcc | Q13002 |
Top |
Malignant transformation analysis |
| Identification of the aberrant gene expression in precancerous and cancerous lesions by comparing the gene expression of stem-like cells in diseased tissues with normal stem cells |
| Entrez ID | Symbol | Replicates | Species | Organ | Tissue | Adj P-value | Log2FC | Malignancy |
| 2898 | GRIK2 | HTA11_347_2000001011 | Human | Colorectum | AD | 3.61e-04 | 2.18e-01 | -0.1954 |
| 2898 | GRIK2 | HTA11_3361_2000001011 | Human | Colorectum | AD | 6.91e-04 | 2.84e-01 | -0.1207 |
| 2898 | GRIK2 | HTA11_10623_2000001011 | Human | Colorectum | AD | 9.65e-03 | 3.52e-01 | -0.0177 |
| 2898 | GRIK2 | HTA11_10711_2000001011 | Human | Colorectum | AD | 1.40e-09 | 4.10e-01 | 0.0338 |
| 2898 | GRIK2 | HTA11_7696_3000711011 | Human | Colorectum | AD | 2.99e-16 | 4.33e-01 | 0.0674 |
| 2898 | GRIK2 | HTA11_11156_2000001011 | Human | Colorectum | AD | 1.28e-05 | 5.33e-01 | 0.0397 |
| 2898 | GRIK2 | HTA11_99999970781_79442 | Human | Colorectum | MSS | 3.31e-12 | 4.32e-01 | 0.294 |
| 2898 | GRIK2 | HTA11_99999971662_82457 | Human | Colorectum | MSS | 2.32e-06 | 1.17e-01 | 0.3859 |
| 2898 | GRIK2 | HTA11_99999973899_84307 | Human | Colorectum | MSS | 9.39e-08 | 4.24e-01 | 0.2585 |
| 2898 | GRIK2 | HTA11_99999974143_84620 | Human | Colorectum | MSS | 3.46e-52 | 1.07e+00 | 0.3005 |
| 2898 | GRIK2 | AEH-subject1 | Human | Endometrium | AEH | 2.83e-14 | 2.78e-01 | -0.3059 |
| 2898 | GRIK2 | AEH-subject2 | Human | Endometrium | AEH | 2.01e-07 | 2.66e-01 | -0.2525 |
| 2898 | GRIK2 | AEH-subject3 | Human | Endometrium | AEH | 4.17e-06 | 2.38e-01 | -0.2576 |
| 2898 | GRIK2 | AEH-subject4 | Human | Endometrium | AEH | 4.37e-12 | 3.78e-01 | -0.2657 |
| 2898 | GRIK2 | AEH-subject5 | Human | Endometrium | AEH | 3.81e-02 | 1.51e-01 | -0.2953 |
| 2898 | GRIK2 | EEC-subject1 | Human | Endometrium | EEC | 6.54e-05 | 2.28e-01 | -0.2682 |
| 2898 | GRIK2 | HTA12-25-1 | Human | Pancreas | PDAC | 3.92e-05 | 5.59e-01 | 0.313 |
| 2898 | GRIK2 | HTA12-26-1 | Human | Pancreas | PDAC | 2.56e-13 | 7.83e-01 | 0.3728 |
| 2898 | GRIK2 | HTA12-29-1 | Human | Pancreas | PDAC | 1.60e-45 | 1.12e+00 | 0.3722 |
| 2898 | GRIK2 | GSM5252128_BPH327PrGF_Via | Human | Prostate | BPH | 9.61e-03 | 9.21e-02 | -0.1688 |
| Page: 1 2 |
| Tissue | Expression Dynamics | Abbreviation |
| Colorectum (GSE201348) |  | FAP: Familial adenomatous polyposis |
| CRC: Colorectal cancer | ||
| Colorectum (HTA11) |  | AD: Adenomas |
| SER: Sessile serrated lesions | ||
| MSI-H: Microsatellite-high colorectal cancer | ||
| MSS: Microsatellite stable colorectal cancer | ||
| Endometrium | 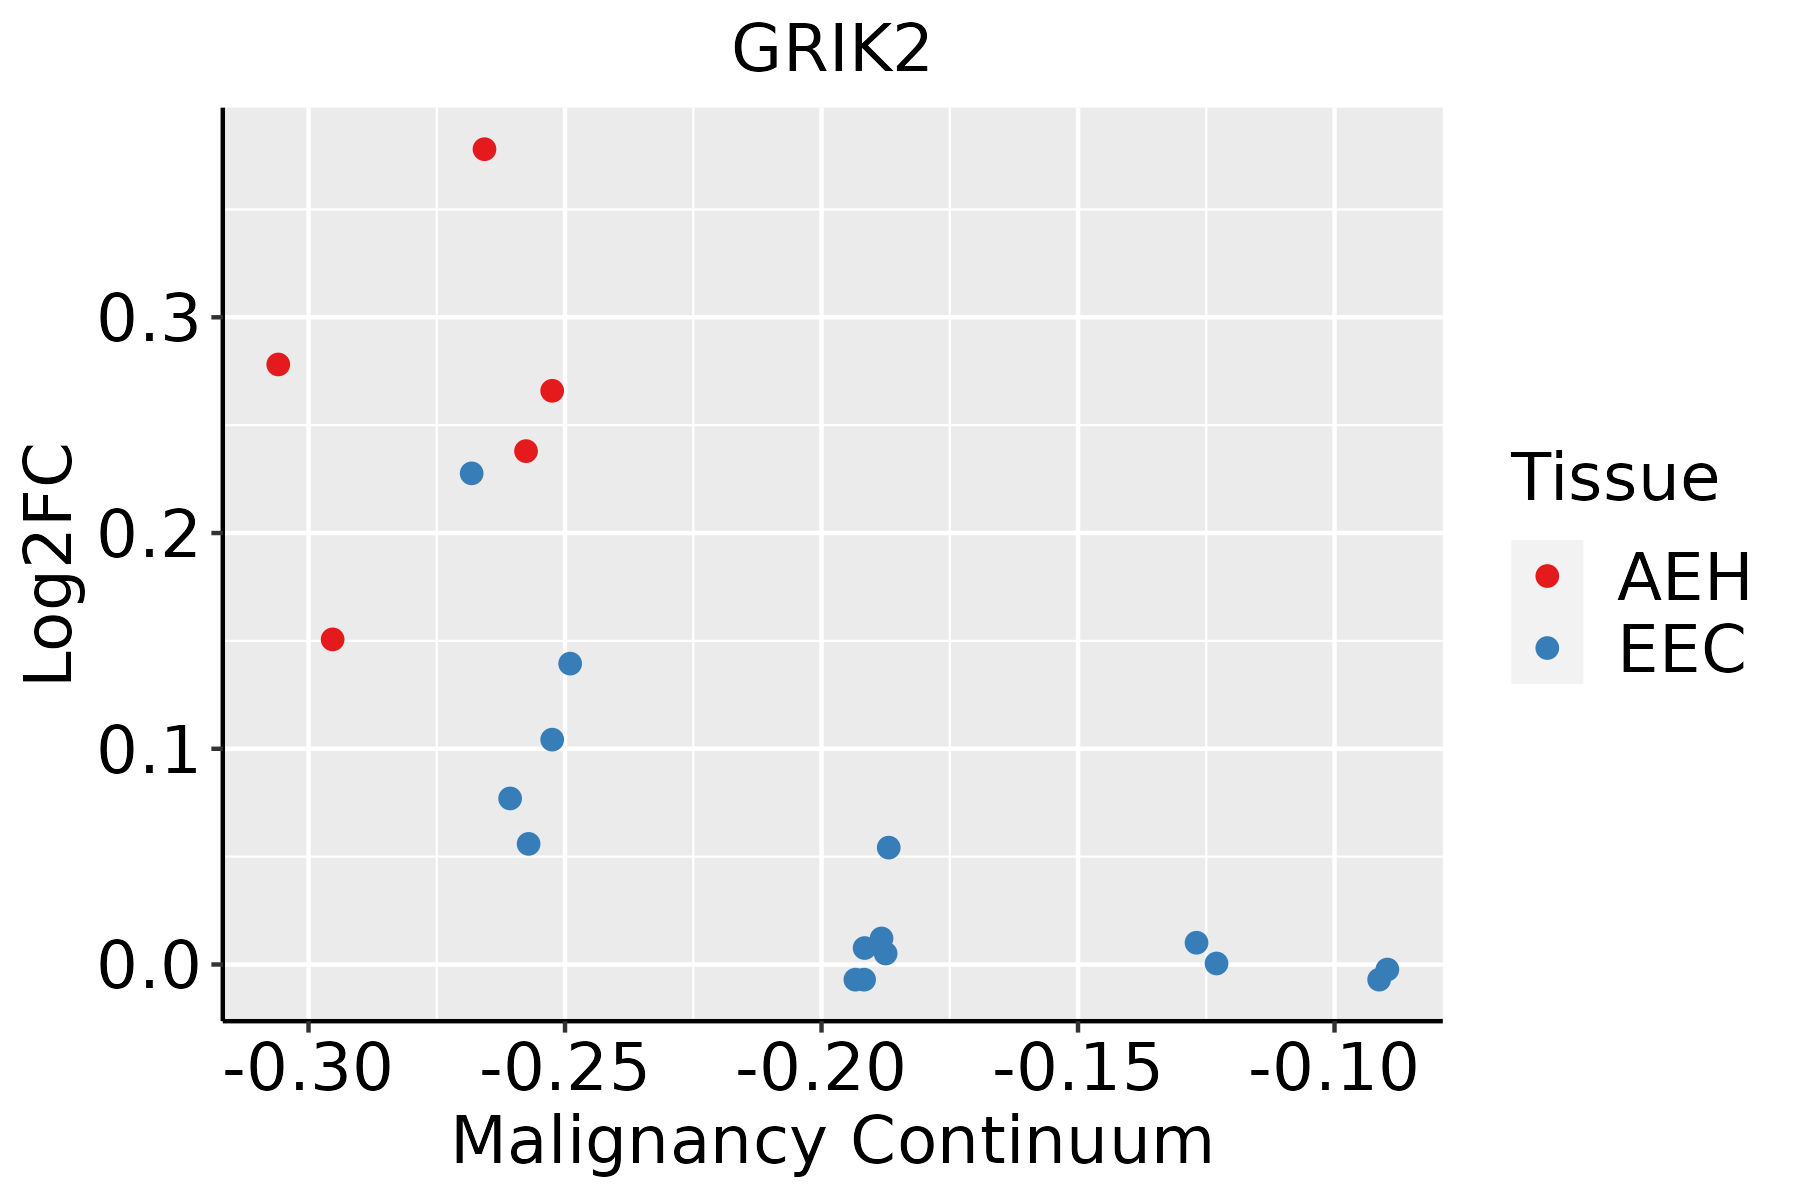 | AEH: Atypical endometrial hyperplasia |
| EEC: Endometrioid Cancer | ||
| Prostate | 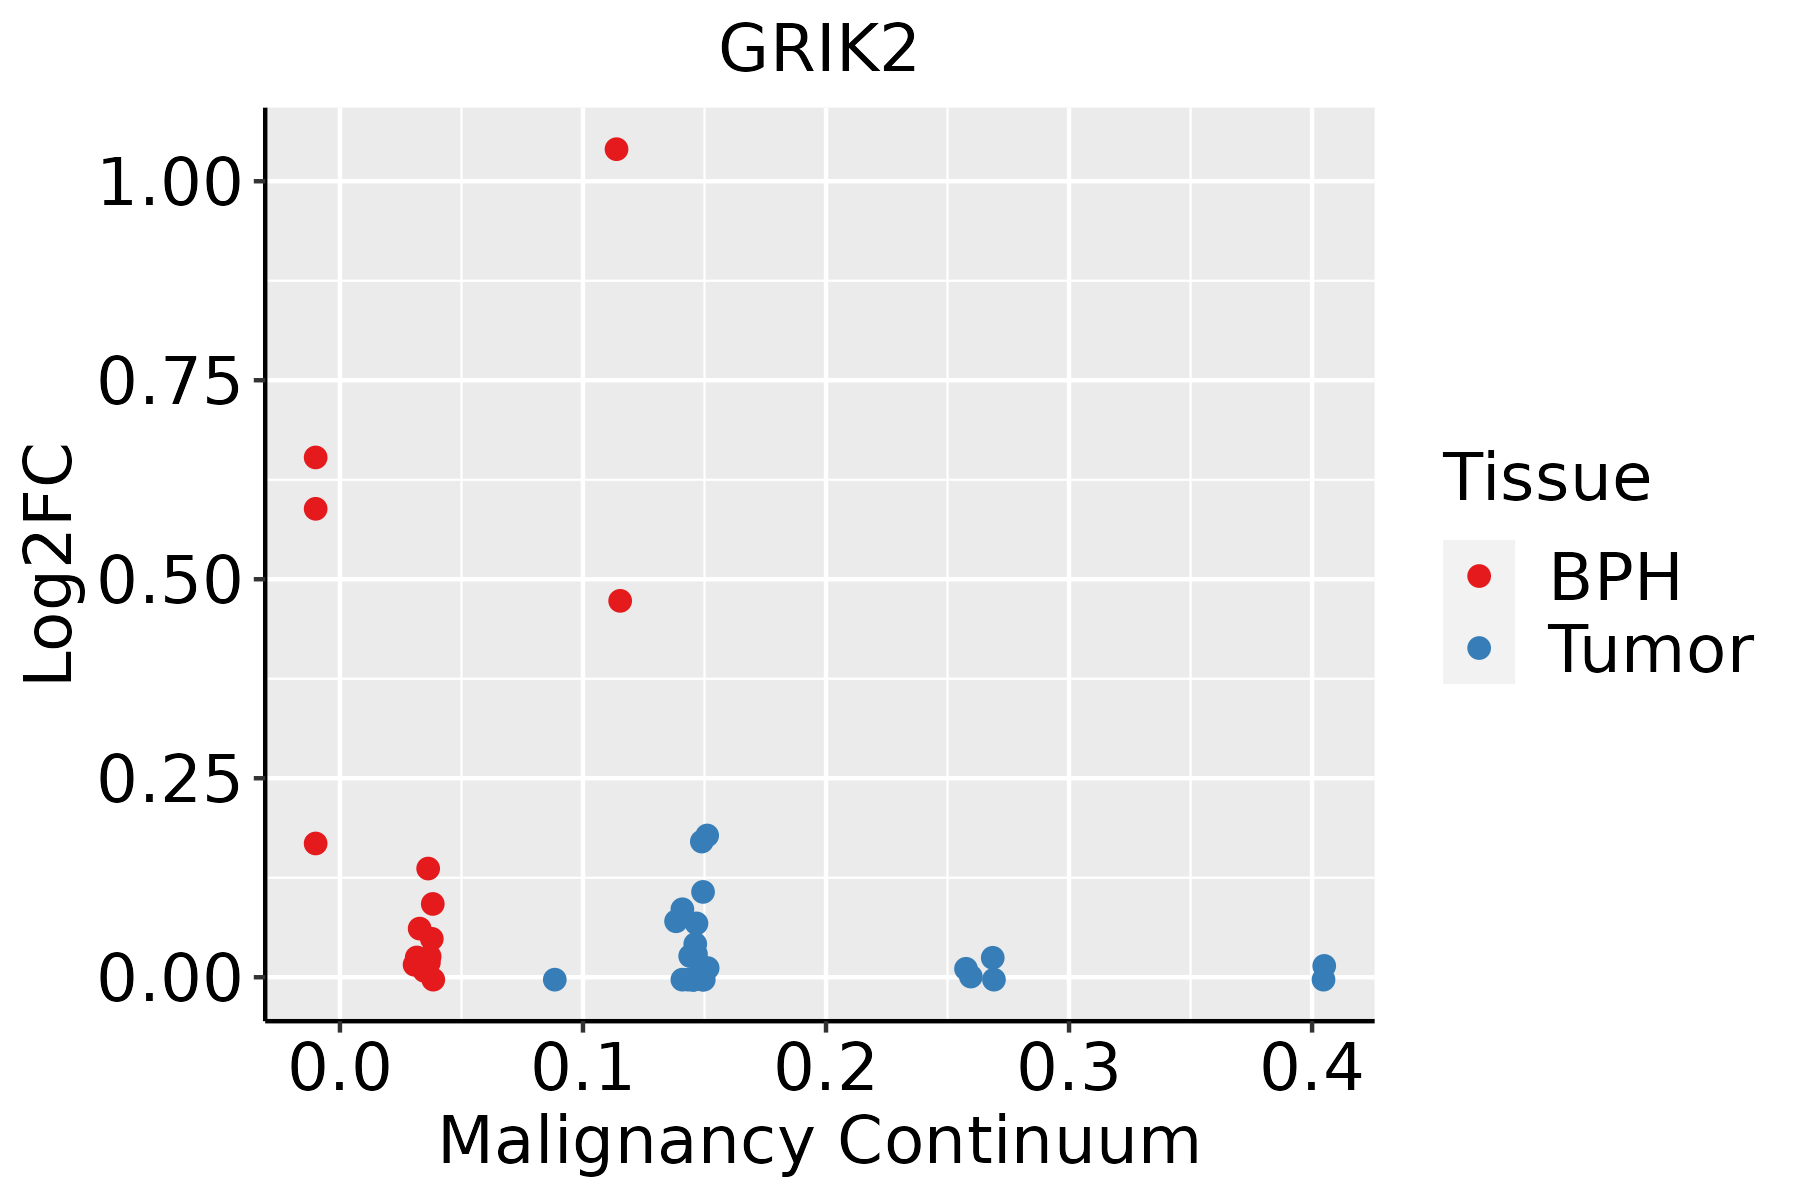 | BPH: Benign Prostatic Hyperplasia |
| ∗log2FC in expression of this searched gene in stem-like cells from each diseased tissue sample relative to stem-like cells in normal samples in each tissue plotted against the malignancy continuum. Samples are colored based on if they are from different disease stage. |
Top |
Malignant transformation related pathway analysis |
| Find out the enriched GO biological processes and KEGG pathways involved in transition from healthy to precancer to cancer |
| Tissue | Disease Stage | Enriched GO biological Processes |
| Colorectum | AD |  |
| Colorectum | SER |  |
| Colorectum | MSS |  |
| Colorectum | MSI-H |  |
| Colorectum | FAP |  |
| ∗Top 15 enriched GO BP terms are showed in the bar plot of each disease state in each tissue. Each row represents a significant GO biological process which is colored according to the -log10(p.adjust). |
| Page: 1 2 3 4 5 6 7 8 9 |
| GO ID | Tissue | Disease Stage | Description | Gene Ratio | Bg Ratio | pvalue | p.adjust | Count |
| GO:00092669 | Endometrium | AEH | response to temperature stimulus | 33/2100 | 178/18723 | 2.53e-03 | 1.87e-02 | 33 |
| GO:000926614 | Endometrium | EEC | response to temperature stimulus | 35/2168 | 178/18723 | 1.15e-03 | 9.82e-03 | 35 |
| GO:000926610 | Prostate | BPH | response to temperature stimulus | 56/3107 | 178/18723 | 6.74e-07 | 1.30e-05 | 56 |
| Page: 1 |
| Pathway ID | Tissue | Disease Stage | Description | Gene Ratio | Bg Ratio | pvalue | p.adjust | qvalue | Count |
| Page: 1 |
Top |
Cell-cell communication analysis |
| Identification of potential cell-cell interactions between two cell types and their ligand-receptor pairs for different disease states |
| Ligand | Receptor | LRpair | Pathway | Tissue | Disease Stage |
| Page: 1 |
Top |
Single-cell gene regulatory network inference analysis |
| Find out the significant the regulons (TFs) and the target genes of each regulon across cell types for different disease states |
| TF | Cell Type | Tissue | Disease Stage | Target Gene | RSS | Regulon Activity |
| ∗The dot plots of a searched regulon are shown for all cell subpopulations in each disease state of each tissue based on the regulon specific score inferred using pySCENIC and by calculating the average expression. |
| Page: 1 |
Top |
Somatic mutation of malignant transformation related genes |
| Annotation of somatic variants for genes involved in malignant transformation |
| Hugo Symbol | Variant Class | Variant Classification | dbSNP RS | HGVSc | HGVSp | HGVSp Short | SWISSPROT | BIOTYPE | SIFT | PolyPhen | Tumor Sample Barcode | Tissue | Histology | Sex | Age | Stage | Therapy Types | Drugs | Outcome |
| GRIK2 | SNV | Missense_Mutation | c.1602G>C | p.Met534Ile | p.M534I | Q13002 | protein_coding | deleterious(0) | possibly_damaging(0.616) | TCGA-A8-A08G-01 | Breast | breast invasive carcinoma | Female | <65 | I/II | Chemotherapy | 5-fluorouracil | CR | |
| GRIK2 | SNV | Missense_Mutation | c.667N>C | p.Glu223Gln | p.E223Q | Q13002 | protein_coding | tolerated(0.28) | probably_damaging(0.986) | TCGA-A8-A09A-01 | Breast | breast invasive carcinoma | Female | <65 | I/II | Hormone Therapy | tamoxiphen | SD | |
| GRIK2 | SNV | Missense_Mutation | c.635N>G | p.Lys212Arg | p.K212R | Q13002 | protein_coding | tolerated(1) | benign(0.006) | TCGA-A8-A09G-01 | Breast | breast invasive carcinoma | Female | >=65 | III/IV | Unknown | Unknown | SD | |
| GRIK2 | SNV | Missense_Mutation | novel | c.1301N>A | p.Ile434Asn | p.I434N | Q13002 | protein_coding | deleterious(0) | possibly_damaging(0.805) | TCGA-AR-A2LR-01 | Breast | breast invasive carcinoma | Female | <65 | I/II | Chemotherapy | adriamycin | SD |
| GRIK2 | SNV | Missense_Mutation | c.42N>T | p.Arg14Ser | p.R14S | Q13002 | protein_coding | deleterious(0.02) | benign(0.08) | TCGA-BH-A0B4-01 | Breast | breast invasive carcinoma | Male | >=65 | III/IV | Hormone Therapy | tamoxiphen | SD | |
| GRIK2 | SNV | Missense_Mutation | rs748577917 | c.697N>A | p.Glu233Lys | p.E233K | Q13002 | protein_coding | tolerated(0.22) | benign(0.017) | TCGA-BH-A0HP-01 | Breast | breast invasive carcinoma | Female | >=65 | III/IV | Chemotherapy | doxorubicin | SD |
| GRIK2 | SNV | Missense_Mutation | c.2282N>G | p.Ser761Cys | p.S761C | Q13002 | protein_coding | deleterious(0) | probably_damaging(0.985) | TCGA-BH-A18V-01 | Breast | breast invasive carcinoma | Female | <65 | I/II | Unknown | Unknown | SD | |
| GRIK2 | SNV | Missense_Mutation | novel | c.2453N>C | p.Gln818Pro | p.Q818P | Q13002 | protein_coding | tolerated(0.07) | possibly_damaging(0.53) | TCGA-E2-A14V-01 | Breast | breast invasive carcinoma | Female | <65 | I/II | Chemotherapy | cyclophosphamide | SD |
| GRIK2 | SNV | Missense_Mutation | c.392N>C | p.Gln131Pro | p.Q131P | Q13002 | protein_coding | deleterious(0) | probably_damaging(0.979) | TCGA-E2-A14Z-01 | Breast | breast invasive carcinoma | Female | <65 | I/II | Hormone Therapy | arimidex | PD | |
| GRIK2 | SNV | Missense_Mutation | c.2266N>C | p.Gly756Arg | p.G756R | Q13002 | protein_coding | deleterious(0) | probably_damaging(1) | TCGA-E9-A1RF-01 | Breast | breast invasive carcinoma | Female | >=65 | III/IV | Hormone Therapy | tamoxiphen | SD |
| Page: 1 2 3 4 5 6 7 8 9 10 11 12 13 14 15 16 17 18 19 20 21 22 23 24 25 |
Top |
Related drugs of malignant transformation related genes |
| Identification of chemicals and drugs interact with genes involved in malignant transfromation |
| (DGIdb 4.0) |
| Entrez ID | Symbol | Category | Interaction Types | Drug Claim Name | Drug Name | PMIDs |
| 2898 | GRIK2 | DRUGGABLE GENOME, ION CHANNEL | TALBUTAL | TALBUTAL | ||
| 2898 | GRIK2 | DRUGGABLE GENOME, ION CHANNEL | antagonist | CHEMBL220492 | TOPIRAMATE | |
| 2898 | GRIK2 | DRUGGABLE GENOME, ION CHANNEL | THIOPENTAL | THIOPENTAL | ||
| 2898 | GRIK2 | DRUGGABLE GENOME, ION CHANNEL | antagonist | CHEMBL14935 | TEZAMPANEL | |
| 2898 | GRIK2 | DRUGGABLE GENOME, ION CHANNEL | PRIMIDONE | PRIMIDONE | ||
| 2898 | GRIK2 | DRUGGABLE GENOME, ION CHANNEL | BUTALBITAL | BUTALBITAL | ||
| 2898 | GRIK2 | DRUGGABLE GENOME, ION CHANNEL | PENTOBARBITAL | PENTOBARBITAL | ||
| 2898 | GRIK2 | DRUGGABLE GENOME, ION CHANNEL | agonist | 178101134 | ||
| 2898 | GRIK2 | DRUGGABLE GENOME, ION CHANNEL | HEXOBARBITAL | HEXOBARBITAL | ||
| 2898 | GRIK2 | DRUGGABLE GENOME, ION CHANNEL | agonist | 178100898 |
| Page: 1 2 3 4 |

Copyright 2023-Present -The University of Texas Health Science Center at Houston |