
|
|||||
|
 | |
| |
| |
| |
| |
| |
|
Gene: GRHPR |
Gene summary for GRHPR |
| Gene information | Species | Human | Gene symbol | GRHPR | Gene ID | 9380 |
| Gene name | glyoxylate and hydroxypyruvate reductase | |
| Gene Alias | GLXR | |
| Cytomap | 9p13.2 | |
| Gene Type | protein-coding | GO ID | GO:0003008 | UniProtAcc | Q9UBQ7 |
Top |
Malignant transformation analysis |
| Identification of the aberrant gene expression in precancerous and cancerous lesions by comparing the gene expression of stem-like cells in diseased tissues with normal stem cells |
| Entrez ID | Symbol | Replicates | Species | Organ | Tissue | Adj P-value | Log2FC | Malignancy |
| 9380 | GRHPR | HTA11_3361_2000001011 | Human | Colorectum | AD | 3.34e-03 | 3.17e-01 | -0.1207 |
| 9380 | GRHPR | HTA11_696_2000001011 | Human | Colorectum | AD | 6.76e-04 | 2.37e-01 | -0.1464 |
| 9380 | GRHPR | HTA11_866_2000001011 | Human | Colorectum | AD | 3.50e-06 | 2.06e-01 | -0.1001 |
| 9380 | GRHPR | HTA11_1391_2000001011 | Human | Colorectum | AD | 5.66e-06 | 3.80e-01 | -0.059 |
| 9380 | GRHPR | HTA11_866_3004761011 | Human | Colorectum | AD | 3.68e-05 | 2.83e-01 | 0.096 |
| 9380 | GRHPR | HTA11_8622_2000001021 | Human | Colorectum | SER | 1.57e-02 | 3.49e-01 | 0.0528 |
| 9380 | GRHPR | HTA11_7696_3000711011 | Human | Colorectum | AD | 3.85e-05 | 2.10e-01 | 0.0674 |
| 9380 | GRHPR | HTA11_99999965062_69753 | Human | Colorectum | MSI-H | 1.34e-04 | 8.15e-01 | 0.3487 |
| 9380 | GRHPR | HTA11_99999971662_82457 | Human | Colorectum | MSS | 2.31e-15 | 4.52e-01 | 0.3859 |
| 9380 | GRHPR | HTA11_99999974143_84620 | Human | Colorectum | MSS | 3.12e-09 | 3.10e-01 | 0.3005 |
| 9380 | GRHPR | AEH-subject1 | Human | Endometrium | AEH | 2.97e-18 | -3.58e-01 | -0.3059 |
| 9380 | GRHPR | AEH-subject2 | Human | Endometrium | AEH | 1.05e-13 | -3.01e-01 | -0.2525 |
| 9380 | GRHPR | AEH-subject3 | Human | Endometrium | AEH | 4.74e-09 | -2.43e-01 | -0.2576 |
| 9380 | GRHPR | AEH-subject4 | Human | Endometrium | AEH | 4.49e-07 | -2.99e-01 | -0.2657 |
| 9380 | GRHPR | AEH-subject5 | Human | Endometrium | AEH | 1.16e-04 | -2.74e-01 | -0.2953 |
| 9380 | GRHPR | EEC-subject1 | Human | Endometrium | EEC | 1.04e-16 | -3.44e-01 | -0.2682 |
| 9380 | GRHPR | EEC-subject2 | Human | Endometrium | EEC | 3.61e-14 | -3.27e-01 | -0.2607 |
| 9380 | GRHPR | EEC-subject3 | Human | Endometrium | EEC | 3.30e-35 | -3.67e-01 | -0.2525 |
| 9380 | GRHPR | EEC-subject4 | Human | Endometrium | EEC | 3.44e-08 | -2.17e-01 | -0.2571 |
| 9380 | GRHPR | EEC-subject5 | Human | Endometrium | EEC | 6.84e-06 | -1.63e-01 | -0.249 |
| Page: 1 2 3 4 5 6 7 8 |
| Tissue | Expression Dynamics | Abbreviation |
| Colorectum (GSE201348) |  | FAP: Familial adenomatous polyposis |
| CRC: Colorectal cancer | ||
| Colorectum (HTA11) | 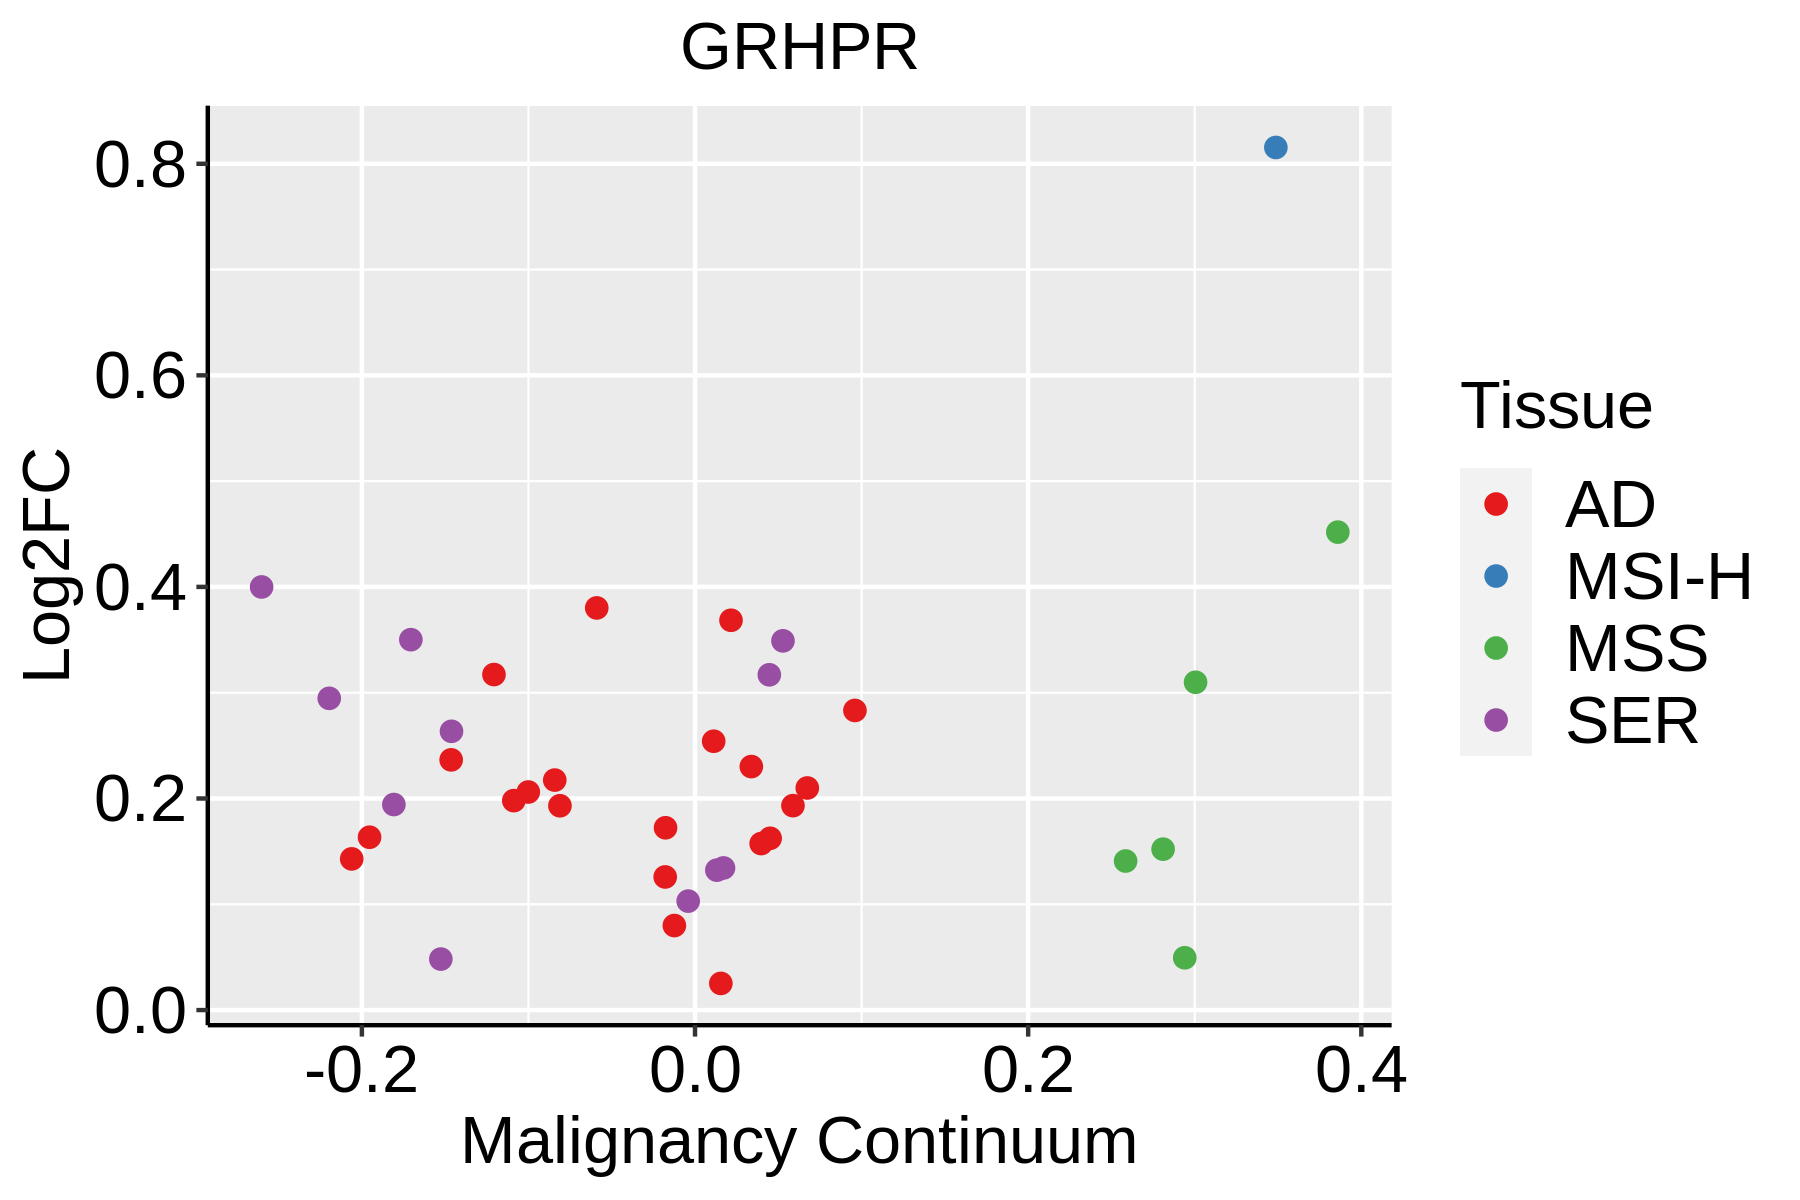 | AD: Adenomas |
| SER: Sessile serrated lesions | ||
| MSI-H: Microsatellite-high colorectal cancer | ||
| MSS: Microsatellite stable colorectal cancer | ||
| Endometrium | 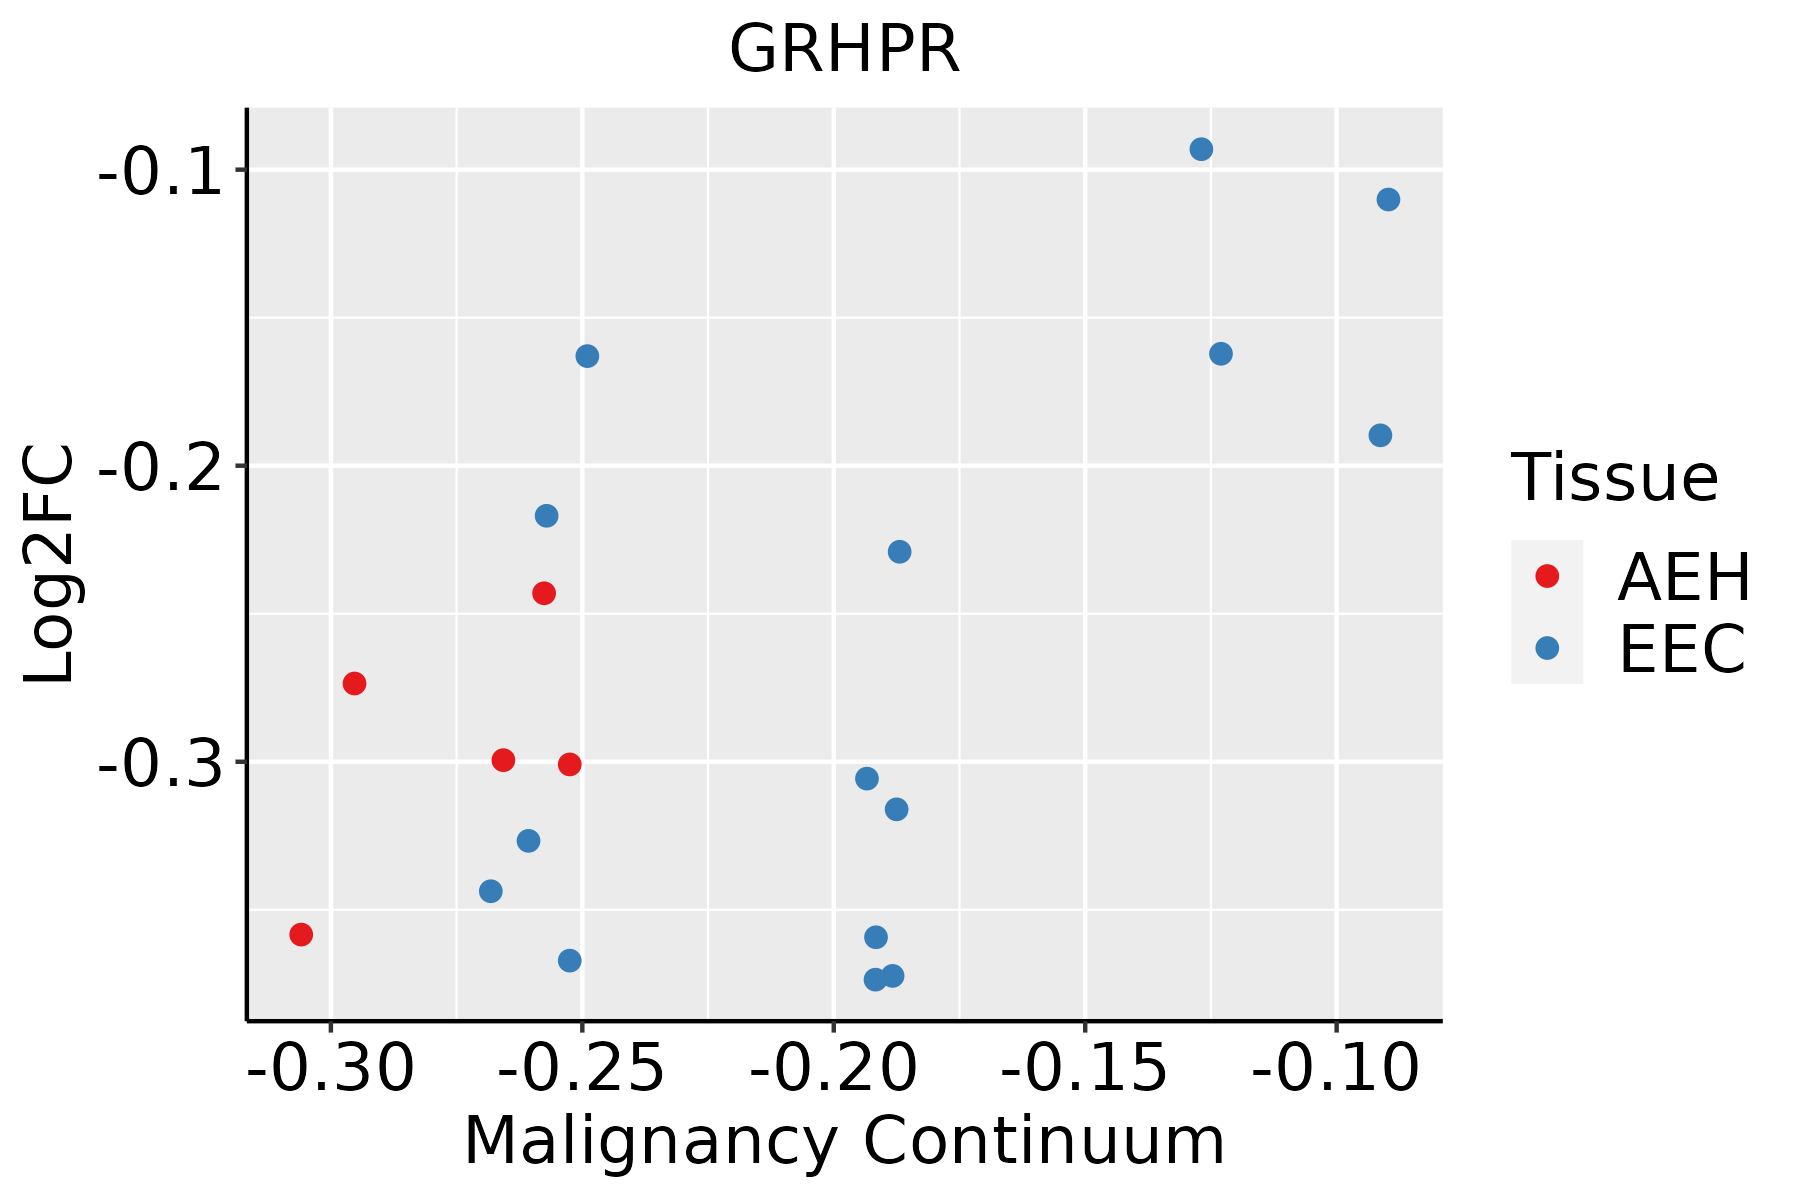 | AEH: Atypical endometrial hyperplasia |
| EEC: Endometrioid Cancer | ||
| Esophagus | 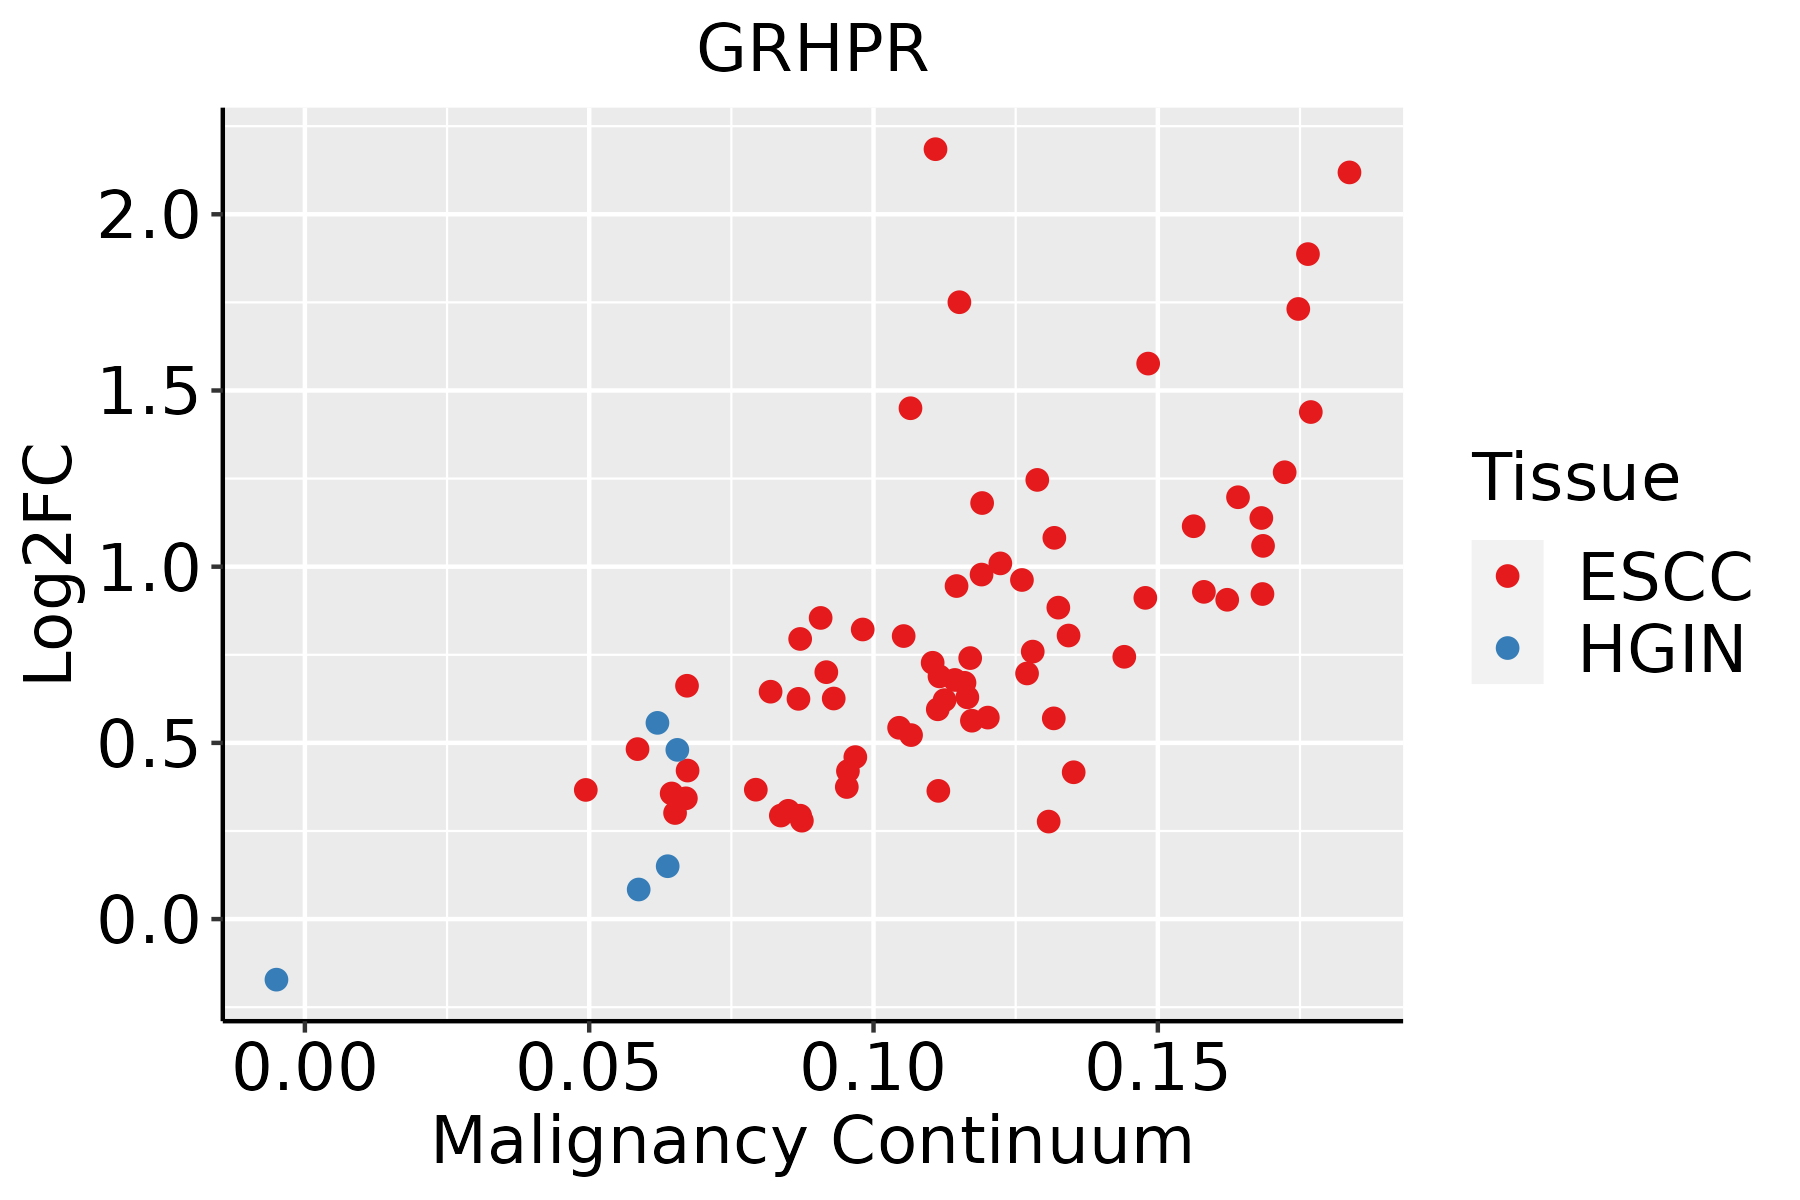 | ESCC: Esophageal squamous cell carcinoma |
| HGIN: High-grade intraepithelial neoplasias | ||
| LGIN: Low-grade intraepithelial neoplasias | ||
| Liver | 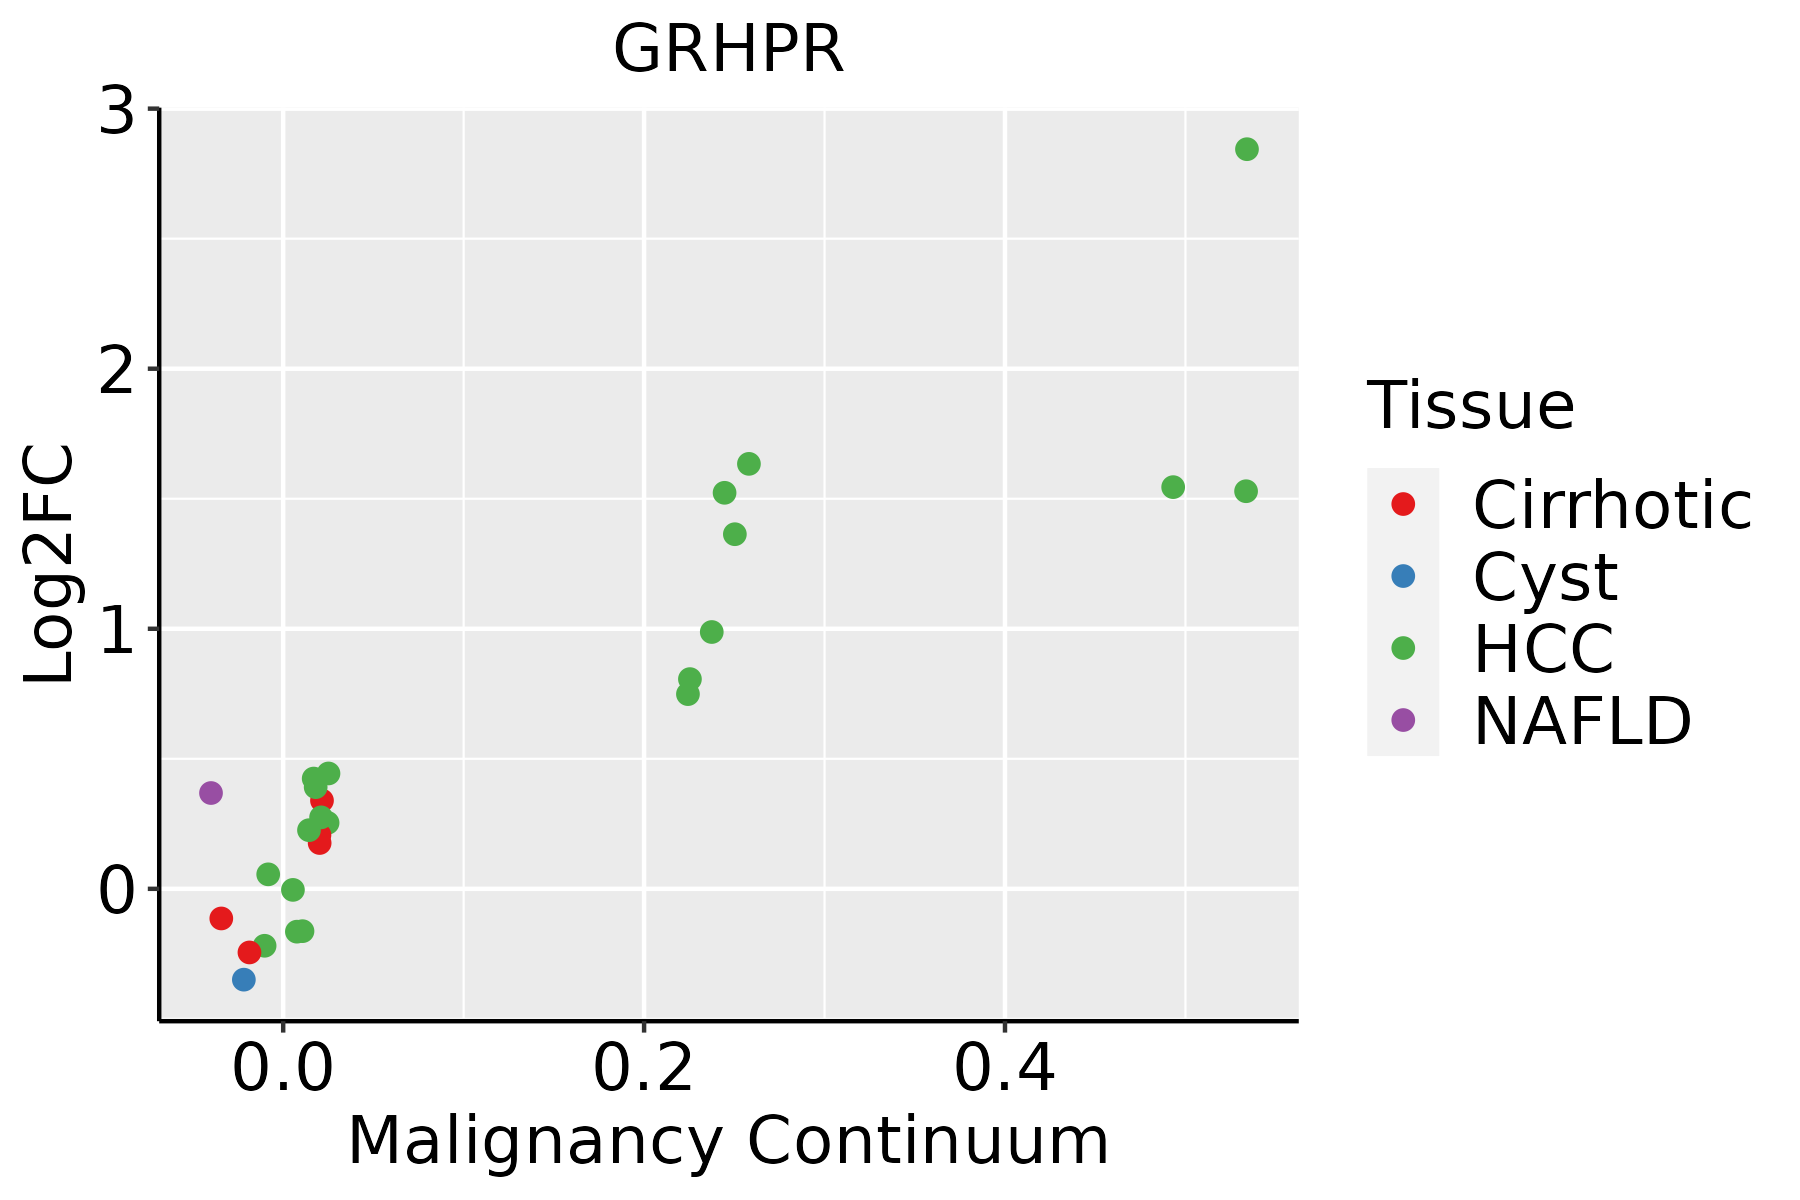 | HCC: Hepatocellular carcinoma |
| NAFLD: Non-alcoholic fatty liver disease | ||
| Oral Cavity | 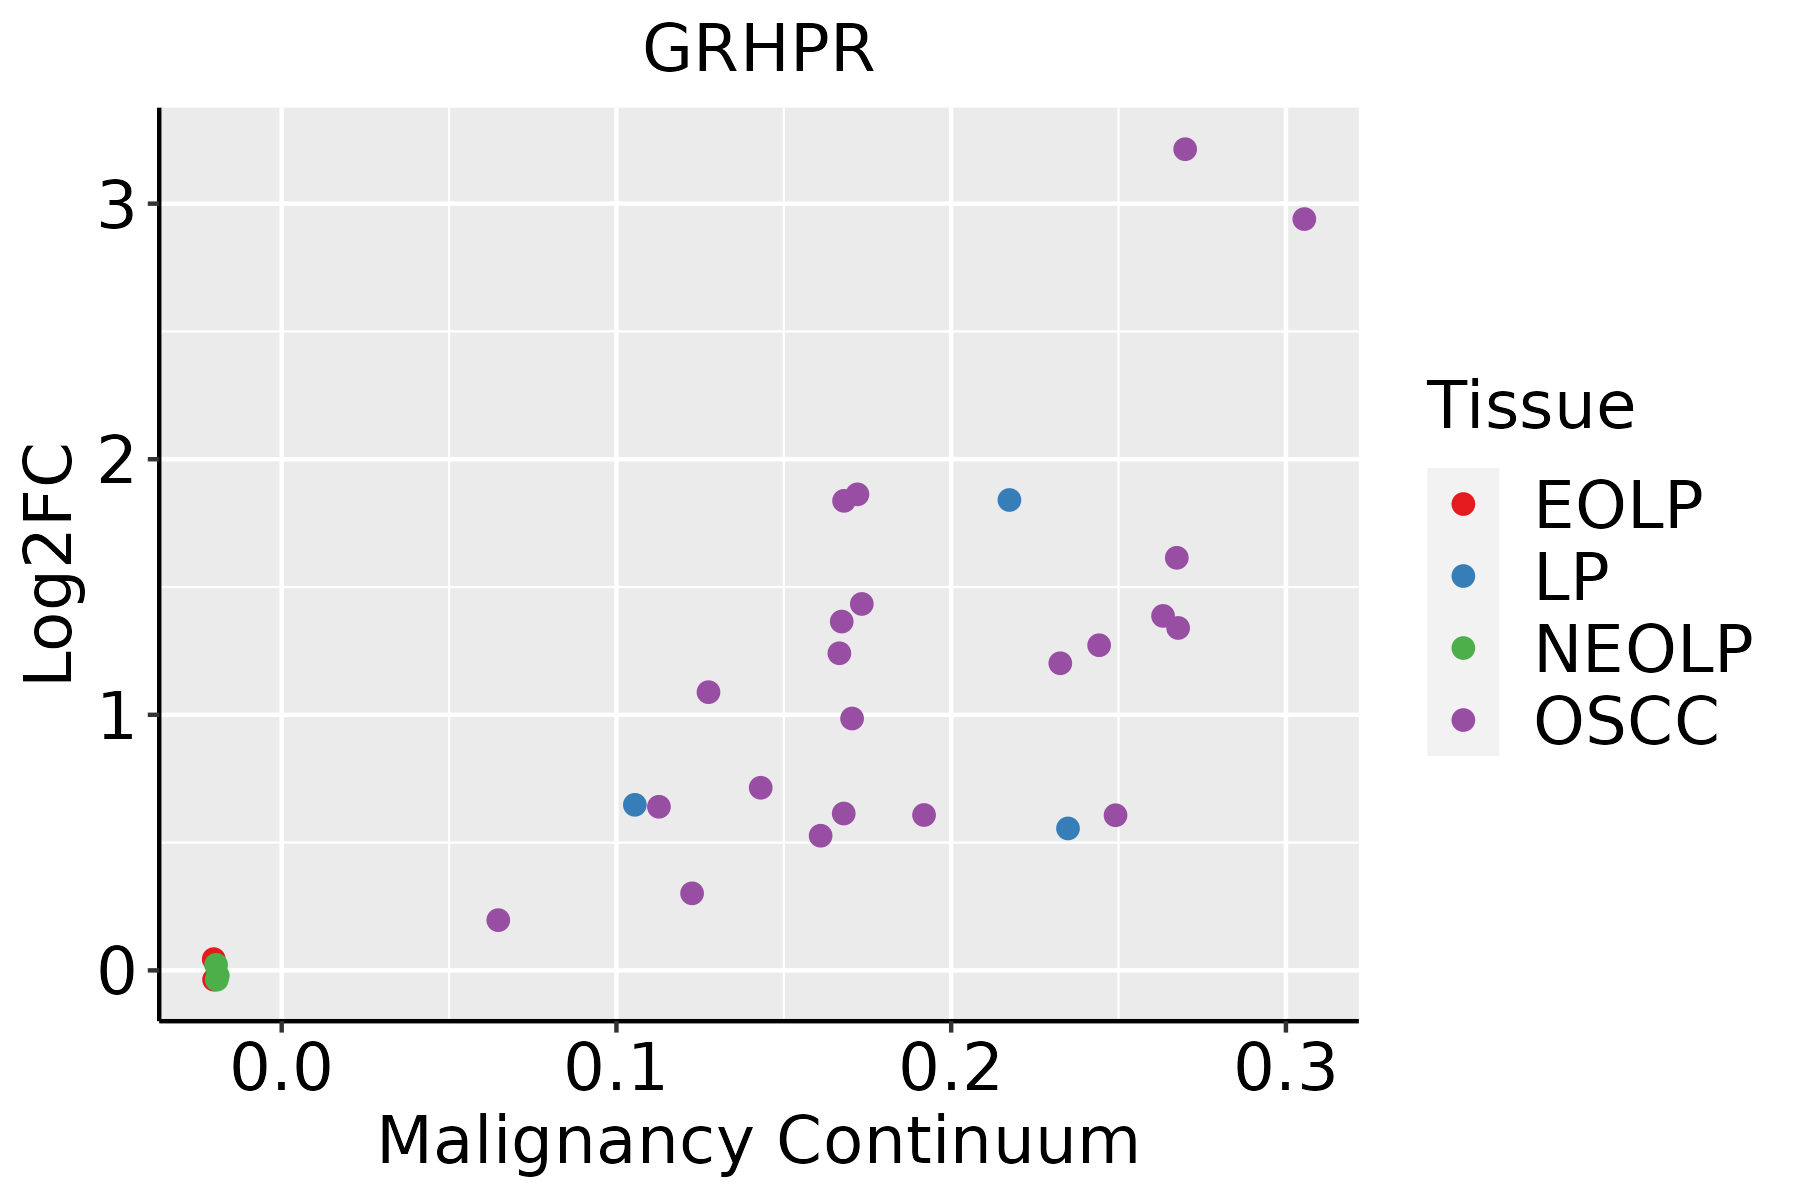 | EOLP: Erosive Oral lichen planus |
| LP: leukoplakia | ||
| NEOLP: Non-erosive oral lichen planus | ||
| OSCC: Oral squamous cell carcinoma | ||
| Prostate |  | BPH: Benign Prostatic Hyperplasia |
| Skin | 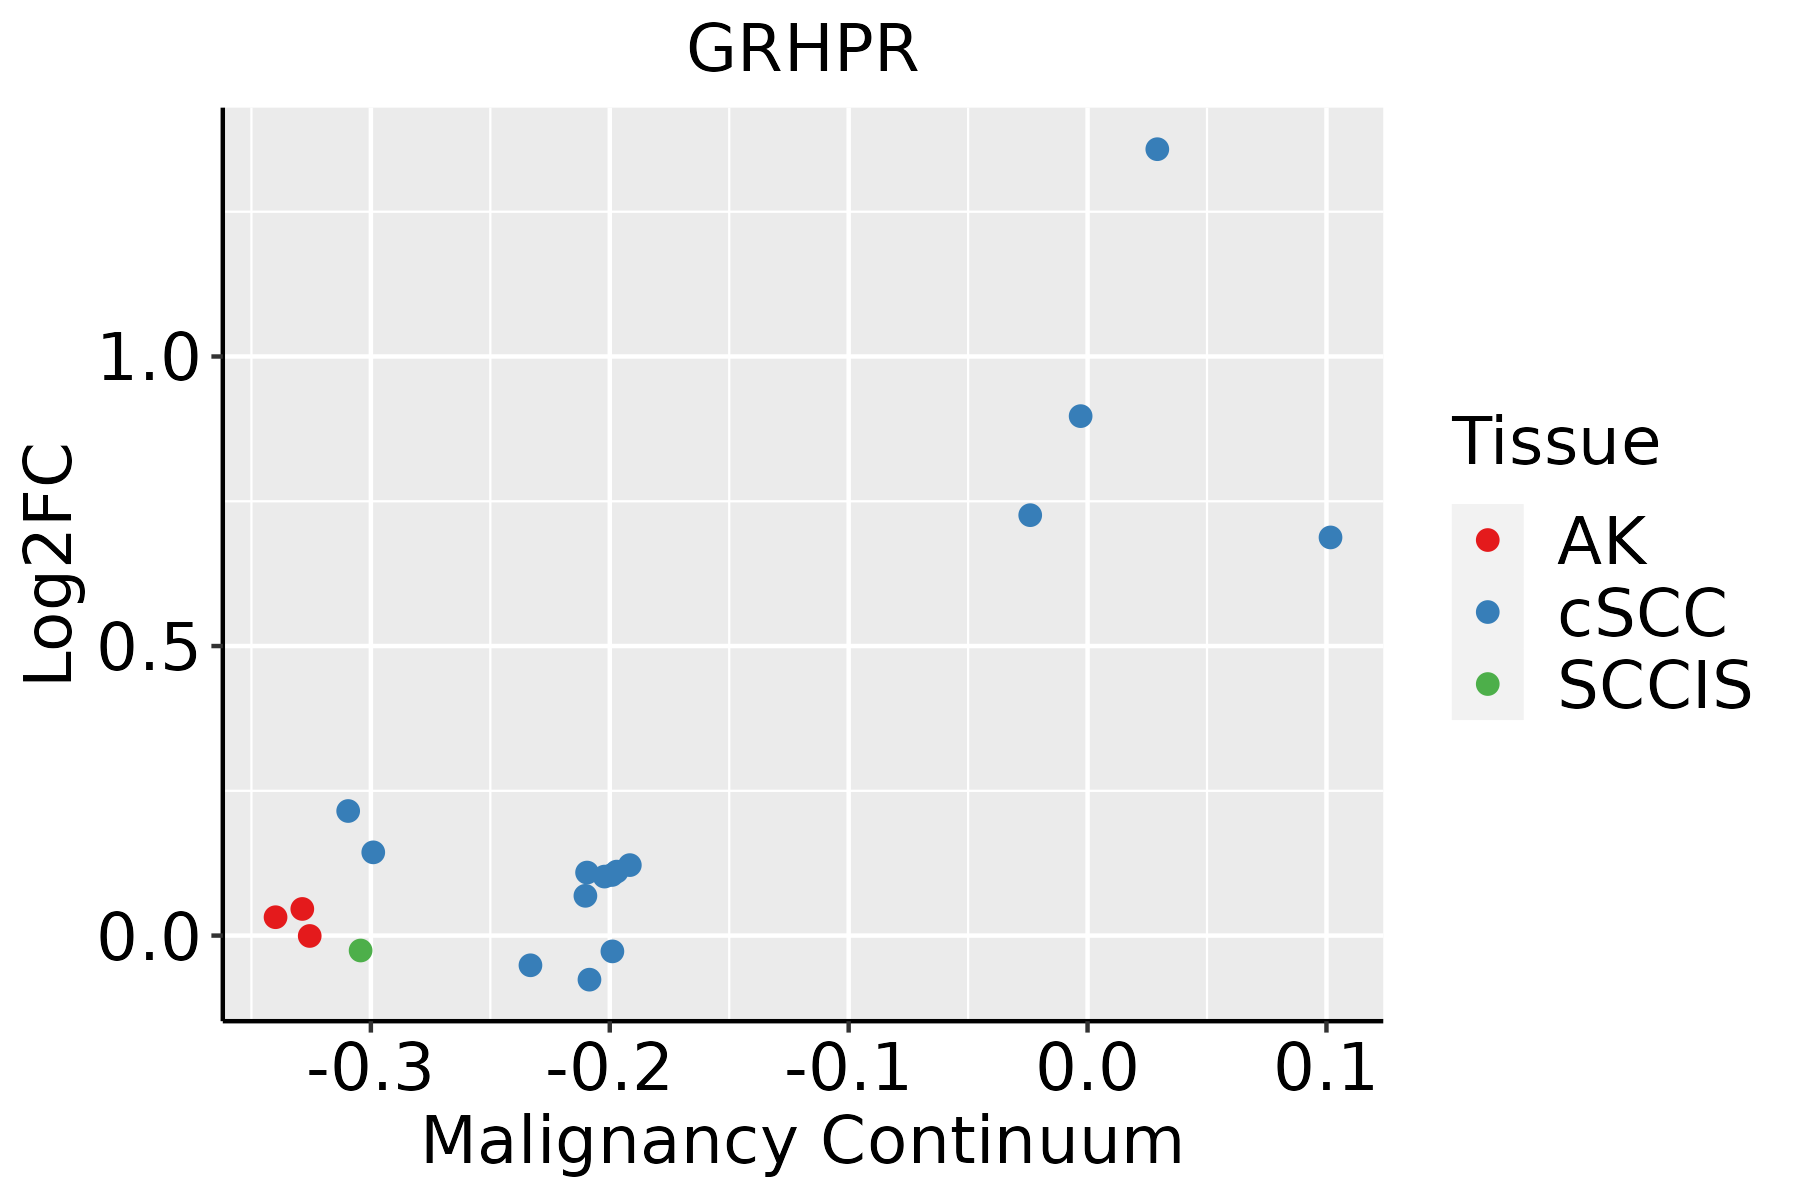 | AK: Actinic keratosis |
| cSCC: Cutaneous squamous cell carcinoma | ||
| SCCIS:squamous cell carcinoma in situ | ||
| Thyroid | 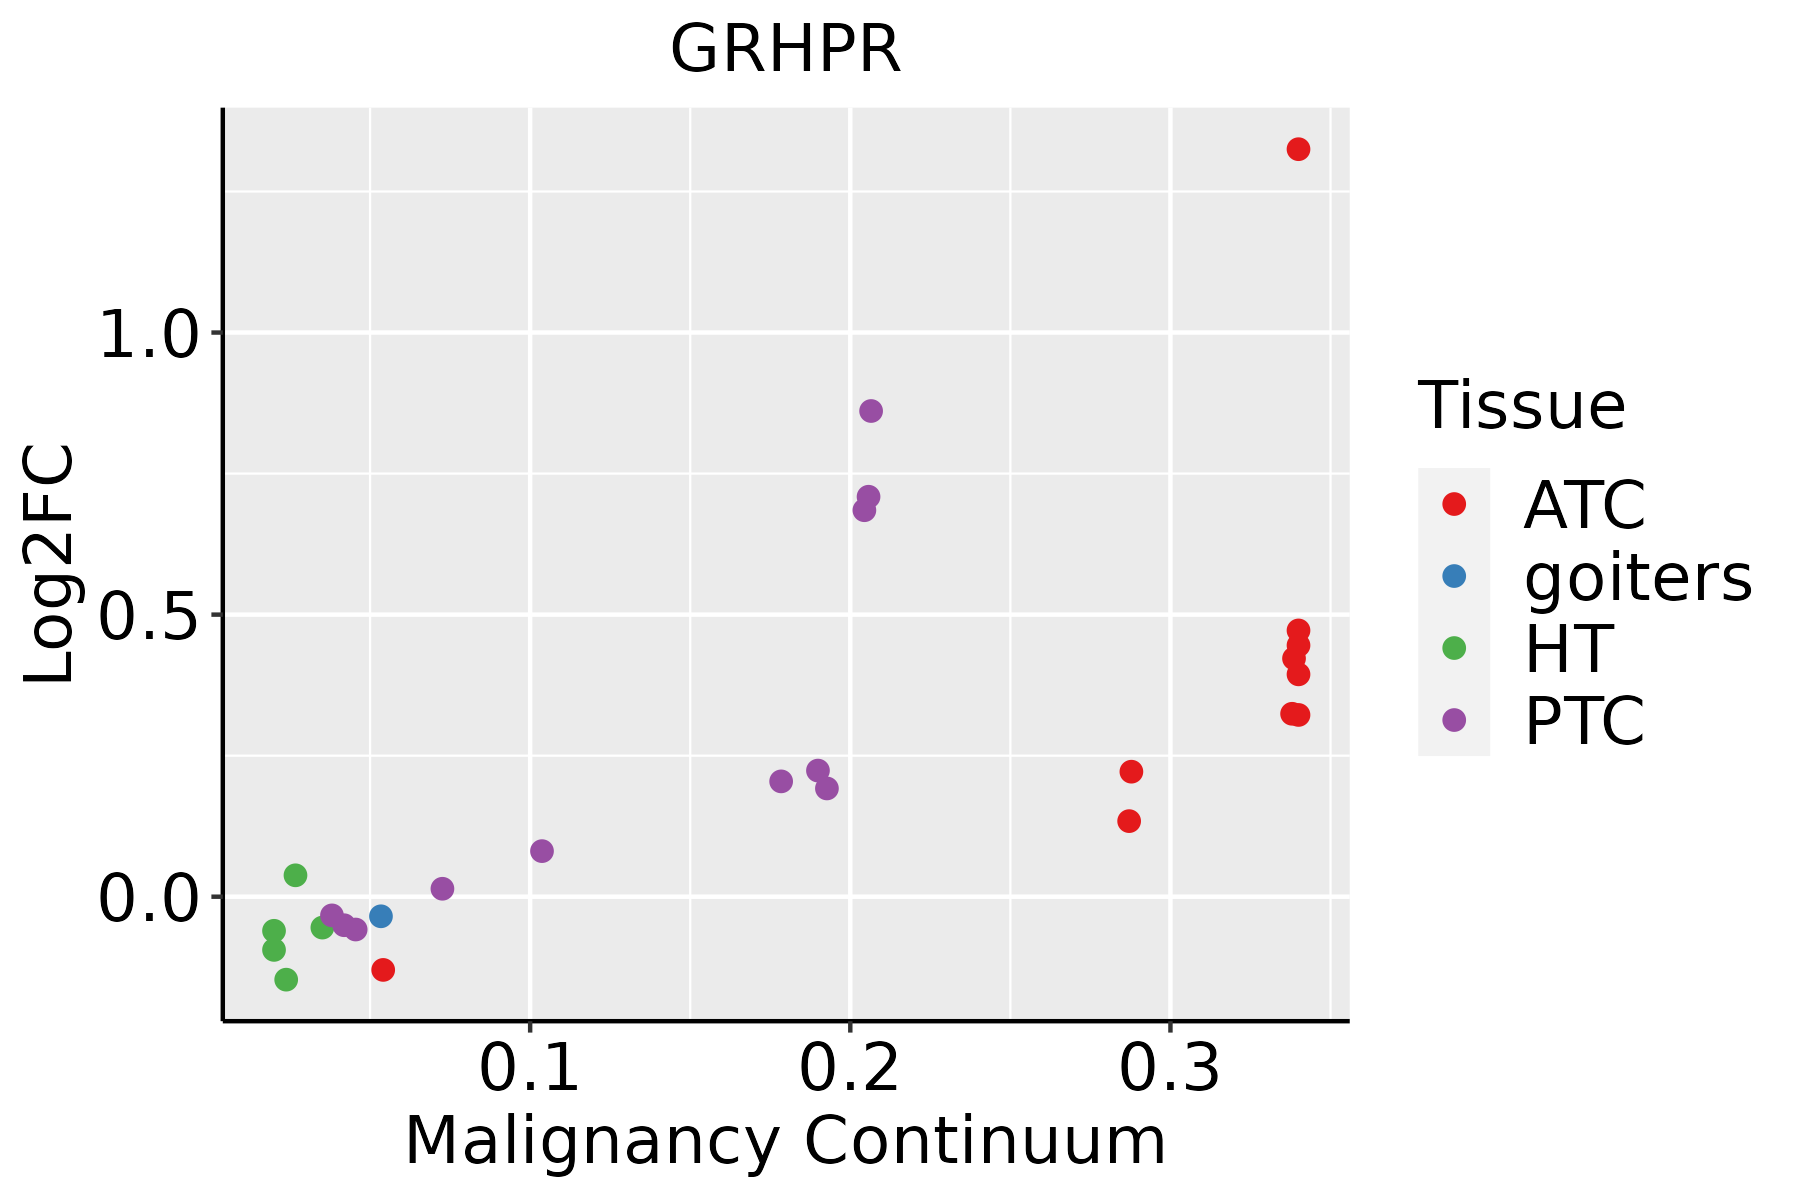 | ATC: Anaplastic thyroid cancer |
| HT: Hashimoto's thyroiditis | ||
| PTC: Papillary thyroid cancer |
| ∗log2FC in expression of this searched gene in stem-like cells from each diseased tissue sample relative to stem-like cells in normal samples in each tissue plotted against the malignancy continuum. Samples are colored based on if they are from different disease stage. |
Top |
Malignant transformation related pathway analysis |
| Find out the enriched GO biological processes and KEGG pathways involved in transition from healthy to precancer to cancer |
| Tissue | Disease Stage | Enriched GO biological Processes |
| Colorectum | AD |  |
| Colorectum | SER |  |
| Colorectum | MSS |  |
| Colorectum | MSI-H |  |
| Colorectum | FAP |  |
| ∗Top 15 enriched GO BP terms are showed in the bar plot of each disease state in each tissue. Each row represents a significant GO biological process which is colored according to the -log10(p.adjust). |
| Page: 1 2 3 4 5 6 7 8 9 |
| GO ID | Tissue | Disease Stage | Description | Gene Ratio | Bg Ratio | pvalue | p.adjust | Count |
| GO:0043648 | Colorectum | AD | dicarboxylic acid metabolic process | 34/3918 | 96/18723 | 7.22e-04 | 7.28e-03 | 34 |
| GO:0006081 | Colorectum | AD | cellular aldehyde metabolic process | 22/3918 | 60/18723 | 3.64e-03 | 2.60e-02 | 22 |
| GO:00060811 | Colorectum | MSS | cellular aldehyde metabolic process | 21/3467 | 60/18723 | 1.81e-03 | 1.60e-02 | 21 |
| GO:00060812 | Colorectum | MSI-H | cellular aldehyde metabolic process | 13/1319 | 60/18723 | 2.27e-04 | 5.94e-03 | 13 |
| GO:00060818 | Esophagus | ESCC | cellular aldehyde metabolic process | 40/8552 | 60/18723 | 8.30e-04 | 4.28e-03 | 40 |
| GO:00436485 | Esophagus | ESCC | dicarboxylic acid metabolic process | 58/8552 | 96/18723 | 2.55e-03 | 1.09e-02 | 58 |
| GO:004364811 | Liver | Cirrhotic | dicarboxylic acid metabolic process | 43/4634 | 96/18723 | 1.42e-05 | 1.97e-04 | 43 |
| GO:00060815 | Liver | Cirrhotic | cellular aldehyde metabolic process | 28/4634 | 60/18723 | 1.83e-04 | 1.71e-03 | 28 |
| GO:00436482 | Liver | HCC | dicarboxylic acid metabolic process | 68/7958 | 96/18723 | 1.73e-08 | 4.14e-07 | 68 |
| GO:000608112 | Liver | HCC | cellular aldehyde metabolic process | 39/7958 | 60/18723 | 3.61e-04 | 2.50e-03 | 39 |
| GO:00060817 | Oral cavity | OSCC | cellular aldehyde metabolic process | 36/7305 | 60/18723 | 7.94e-04 | 4.27e-03 | 36 |
| GO:00436484 | Oral cavity | OSCC | dicarboxylic acid metabolic process | 50/7305 | 96/18723 | 6.24e-03 | 2.35e-02 | 50 |
| GO:000608114 | Oral cavity | LP | cellular aldehyde metabolic process | 26/4623 | 60/18723 | 1.19e-03 | 9.62e-03 | 26 |
| GO:00060816 | Prostate | BPH | cellular aldehyde metabolic process | 20/3107 | 60/18723 | 1.14e-03 | 7.10e-03 | 20 |
| GO:000608113 | Prostate | Tumor | cellular aldehyde metabolic process | 21/3246 | 60/18723 | 7.59e-04 | 5.20e-03 | 21 |
| GO:00060819 | Skin | cSCC | cellular aldehyde metabolic process | 28/4864 | 60/18723 | 4.35e-04 | 3.36e-03 | 28 |
| GO:00436486 | Skin | cSCC | dicarboxylic acid metabolic process | 38/4864 | 96/18723 | 2.38e-03 | 1.38e-02 | 38 |
| Page: 1 |
| Pathway ID | Tissue | Disease Stage | Description | Gene Ratio | Bg Ratio | pvalue | p.adjust | qvalue | Count |
| hsa00630 | Colorectum | AD | Glyoxylate and dicarboxylate metabolism | 14/2092 | 30/8465 | 7.25e-03 | 2.97e-02 | 1.89e-02 | 14 |
| hsa006301 | Colorectum | AD | Glyoxylate and dicarboxylate metabolism | 14/2092 | 30/8465 | 7.25e-03 | 2.97e-02 | 1.89e-02 | 14 |
| hsa006202 | Colorectum | SER | Pyruvate metabolism | 22/1580 | 47/8465 | 9.62e-06 | 1.33e-04 | 9.67e-05 | 22 |
| hsa006203 | Colorectum | SER | Pyruvate metabolism | 22/1580 | 47/8465 | 9.62e-06 | 1.33e-04 | 9.67e-05 | 22 |
| hsa006204 | Colorectum | MSS | Pyruvate metabolism | 24/1875 | 47/8465 | 1.25e-05 | 1.35e-04 | 8.27e-05 | 24 |
| hsa006205 | Colorectum | MSS | Pyruvate metabolism | 24/1875 | 47/8465 | 1.25e-05 | 1.35e-04 | 8.27e-05 | 24 |
| hsa006302 | Colorectum | MSI-H | Glyoxylate and dicarboxylate metabolism | 8/797 | 30/8465 | 5.34e-03 | 4.94e-02 | 4.14e-02 | 8 |
| hsa006303 | Colorectum | MSI-H | Glyoxylate and dicarboxylate metabolism | 8/797 | 30/8465 | 5.34e-03 | 4.94e-02 | 4.14e-02 | 8 |
| hsa0062023 | Esophagus | ESCC | Pyruvate metabolism | 32/4205 | 47/8465 | 8.11e-03 | 1.94e-02 | 9.94e-03 | 32 |
| hsa006306 | Esophagus | ESCC | Glyoxylate and dicarboxylate metabolism | 21/4205 | 30/8465 | 1.95e-02 | 4.35e-02 | 2.23e-02 | 21 |
| hsa0062033 | Esophagus | ESCC | Pyruvate metabolism | 32/4205 | 47/8465 | 8.11e-03 | 1.94e-02 | 9.94e-03 | 32 |
| hsa0063013 | Esophagus | ESCC | Glyoxylate and dicarboxylate metabolism | 21/4205 | 30/8465 | 1.95e-02 | 4.35e-02 | 2.23e-02 | 21 |
| hsa006208 | Liver | Cirrhotic | Pyruvate metabolism | 29/2530 | 47/8465 | 5.90e-06 | 5.95e-05 | 3.67e-05 | 29 |
| hsa006304 | Liver | Cirrhotic | Glyoxylate and dicarboxylate metabolism | 20/2530 | 30/8465 | 3.36e-05 | 2.54e-04 | 1.57e-04 | 20 |
| hsa00260 | Liver | Cirrhotic | Glycine, serine and threonine metabolism | 22/2530 | 40/8465 | 7.85e-04 | 4.51e-03 | 2.78e-03 | 22 |
| hsa0062011 | Liver | Cirrhotic | Pyruvate metabolism | 29/2530 | 47/8465 | 5.90e-06 | 5.95e-05 | 3.67e-05 | 29 |
| hsa0063011 | Liver | Cirrhotic | Glyoxylate and dicarboxylate metabolism | 20/2530 | 30/8465 | 3.36e-05 | 2.54e-04 | 1.57e-04 | 20 |
| hsa002601 | Liver | Cirrhotic | Glycine, serine and threonine metabolism | 22/2530 | 40/8465 | 7.85e-04 | 4.51e-03 | 2.78e-03 | 22 |
| hsa0062021 | Liver | HCC | Pyruvate metabolism | 37/4020 | 47/8465 | 1.10e-05 | 8.03e-05 | 4.46e-05 | 37 |
| hsa0063021 | Liver | HCC | Glyoxylate and dicarboxylate metabolism | 24/4020 | 30/8465 | 2.66e-04 | 1.24e-03 | 6.88e-04 | 24 |
| Page: 1 2 |
Top |
Cell-cell communication analysis |
| Identification of potential cell-cell interactions between two cell types and their ligand-receptor pairs for different disease states |
| Ligand | Receptor | LRpair | Pathway | Tissue | Disease Stage |
| Page: 1 |
Top |
Single-cell gene regulatory network inference analysis |
| Find out the significant the regulons (TFs) and the target genes of each regulon across cell types for different disease states |
| TF | Cell Type | Tissue | Disease Stage | Target Gene | RSS | Regulon Activity |
| ∗The dot plots of a searched regulon are shown for all cell subpopulations in each disease state of each tissue based on the regulon specific score inferred using pySCENIC and by calculating the average expression. |
| Page: 1 |
Top |
Somatic mutation of malignant transformation related genes |
| Annotation of somatic variants for genes involved in malignant transformation |
| Hugo Symbol | Variant Class | Variant Classification | dbSNP RS | HGVSc | HGVSp | HGVSp Short | SWISSPROT | BIOTYPE | SIFT | PolyPhen | Tumor Sample Barcode | Tissue | Histology | Sex | Age | Stage | Therapy Types | Drugs | Outcome |
| GRHPR | SNV | Missense_Mutation | c.73N>T | p.Arg25Trp | p.R25W | Q9UBQ7 | protein_coding | deleterious(0) | benign(0.357) | TCGA-E9-A1RH-01 | Breast | breast invasive carcinoma | Female | <65 | I/II | Chemotherapy | 5-fluorouracil | SD | |
| GRHPR | SNV | Missense_Mutation | novel | c.508C>T | p.Arg170Trp | p.R170W | Q9UBQ7 | protein_coding | deleterious(0) | possibly_damaging(0.848) | TCGA-PE-A5DE-01 | Breast | breast invasive carcinoma | Female | <65 | I/II | Chemotherapy | taxotere | CR |
| GRHPR | SNV | Missense_Mutation | rs566239341 | c.419N>T | p.Ser140Leu | p.S140L | Q9UBQ7 | protein_coding | tolerated(0.08) | benign(0.131) | TCGA-DG-A2KL-01 | Cervix | cervical & endocervical cancer | Female | <65 | I/II | Chemotherapy | cisplatin | SD |
| GRHPR | SNV | Missense_Mutation | c.241A>G | p.Met81Val | p.M81V | Q9UBQ7 | protein_coding | tolerated(0.07) | benign(0.039) | TCGA-CK-6746-01 | Colorectum | colon adenocarcinoma | Female | >=65 | I/II | Unknown | Unknown | SD | |
| GRHPR | SNV | Missense_Mutation | rs146603229 | c.296N>A | p.Arg99Gln | p.R99Q | Q9UBQ7 | protein_coding | tolerated(0.12) | benign(0.152) | TCGA-D5-6537-01 | Colorectum | colon adenocarcinoma | Male | <65 | III/IV | Unknown | Unknown | PD |
| GRHPR | SNV | Missense_Mutation | novel | c.964A>T | p.Met322Leu | p.M322L | Q9UBQ7 | protein_coding | tolerated(0.19) | benign(0.245) | TCGA-G4-6303-01 | Colorectum | colon adenocarcinoma | Female | <65 | III/IV | Chemotherapy | 5-fu | PD |
| GRHPR | SNV | Missense_Mutation | c.739G>T | p.Asp247Tyr | p.D247Y | Q9UBQ7 | protein_coding | deleterious(0) | possibly_damaging(0.767) | TCGA-AG-3887-01 | Colorectum | rectum adenocarcinoma | Male | >=65 | I/II | Chemotherapy | irinotecan | SD | |
| GRHPR | SNV | Missense_Mutation | rs180177312 | c.478N>A | p.Gly160Arg | p.G160R | Q9UBQ7 | protein_coding | deleterious(0) | probably_damaging(0.992) | TCGA-A5-A7WJ-01 | Endometrium | uterine corpus endometrioid carcinoma | Female | <65 | I/II | Unknown | Unknown | SD |
| GRHPR | SNV | Missense_Mutation | novel | c.415N>G | p.Thr139Ala | p.T139A | Q9UBQ7 | protein_coding | tolerated(0.7) | benign(0.003) | TCGA-AJ-A3EL-01 | Endometrium | uterine corpus endometrioid carcinoma | Female | <65 | I/II | Unknown | Unknown | SD |
| GRHPR | SNV | Missense_Mutation | rs369950120 | c.742N>A | p.Val248Ile | p.V248I | Q9UBQ7 | protein_coding | tolerated(0.09) | benign(0.198) | TCGA-AP-A0LT-01 | Endometrium | uterine corpus endometrioid carcinoma | Female | <65 | I/II | Unknown | Unknown | SD |
| Page: 1 2 3 |
Top |
Related drugs of malignant transformation related genes |
| Identification of chemicals and drugs interact with genes involved in malignant transfromation |
| (DGIdb 4.0) |
| Entrez ID | Symbol | Category | Interaction Types | Drug Claim Name | Drug Name | PMIDs |
| Page: 1 |

Copyright 2023-Present -The University of Texas Health Science Center at Houston |