
|
|||||
|
 | |
| |
| |
| |
| |
| |
|
Gene: GRHL1 |
Gene summary for GRHL1 |
| Gene information | Species | Human | Gene symbol | GRHL1 | Gene ID | 29841 |
| Gene name | grainyhead like transcription factor 1 | |
| Gene Alias | LBP32 | |
| Cytomap | 2p25.1 | |
| Gene Type | protein-coding | GO ID | GO:0002934 | UniProtAcc | Q9NZI5 |
Top |
Malignant transformation analysis |
| Identification of the aberrant gene expression in precancerous and cancerous lesions by comparing the gene expression of stem-like cells in diseased tissues with normal stem cells |
| Entrez ID | Symbol | Replicates | Species | Organ | Tissue | Adj P-value | Log2FC | Malignancy |
| 29841 | GRHL1 | CCI_1 | Human | Cervix | CC | 9.24e-10 | 1.21e+00 | 0.528 |
| 29841 | GRHL1 | CCI_3 | Human | Cervix | CC | 3.82e-02 | 4.70e-01 | 0.516 |
| 29841 | GRHL1 | sample3 | Human | Cervix | CC | 1.74e-11 | 2.99e-01 | 0.1387 |
| 29841 | GRHL1 | H2 | Human | Cervix | HSIL_HPV | 2.11e-02 | 2.14e-01 | 0.0632 |
| 29841 | GRHL1 | L1 | Human | Cervix | CC | 2.52e-07 | 5.04e-01 | 0.0802 |
| 29841 | GRHL1 | T3 | Human | Cervix | CC | 1.97e-08 | 3.29e-01 | 0.1389 |
| 29841 | GRHL1 | LZE4T | Human | Esophagus | ESCC | 3.12e-03 | 2.13e-01 | 0.0811 |
| 29841 | GRHL1 | LZE22T | Human | Esophagus | ESCC | 2.04e-03 | 6.57e-01 | 0.068 |
| 29841 | GRHL1 | LZE24T | Human | Esophagus | ESCC | 1.02e-09 | 3.04e-01 | 0.0596 |
| 29841 | GRHL1 | P1T-E | Human | Esophagus | ESCC | 6.73e-10 | 6.32e-01 | 0.0875 |
| 29841 | GRHL1 | P2T-E | Human | Esophagus | ESCC | 4.84e-06 | 9.26e-02 | 0.1177 |
| 29841 | GRHL1 | P4T-E | Human | Esophagus | ESCC | 7.42e-17 | 5.37e-01 | 0.1323 |
| 29841 | GRHL1 | P5T-E | Human | Esophagus | ESCC | 7.84e-03 | 5.89e-02 | 0.1327 |
| 29841 | GRHL1 | P8T-E | Human | Esophagus | ESCC | 9.28e-14 | 2.39e-01 | 0.0889 |
| 29841 | GRHL1 | P12T-E | Human | Esophagus | ESCC | 5.27e-54 | 1.16e+00 | 0.1122 |
| 29841 | GRHL1 | P15T-E | Human | Esophagus | ESCC | 1.47e-18 | 4.24e-01 | 0.1149 |
| 29841 | GRHL1 | P16T-E | Human | Esophagus | ESCC | 1.35e-35 | 7.02e-01 | 0.1153 |
| 29841 | GRHL1 | P20T-E | Human | Esophagus | ESCC | 6.98e-09 | 2.24e-01 | 0.1124 |
| 29841 | GRHL1 | P21T-E | Human | Esophagus | ESCC | 4.46e-08 | 7.30e-02 | 0.1617 |
| 29841 | GRHL1 | P22T-E | Human | Esophagus | ESCC | 1.52e-05 | 1.07e-01 | 0.1236 |
| Page: 1 2 3 4 |
| Tissue | Expression Dynamics | Abbreviation |
| Cervix | 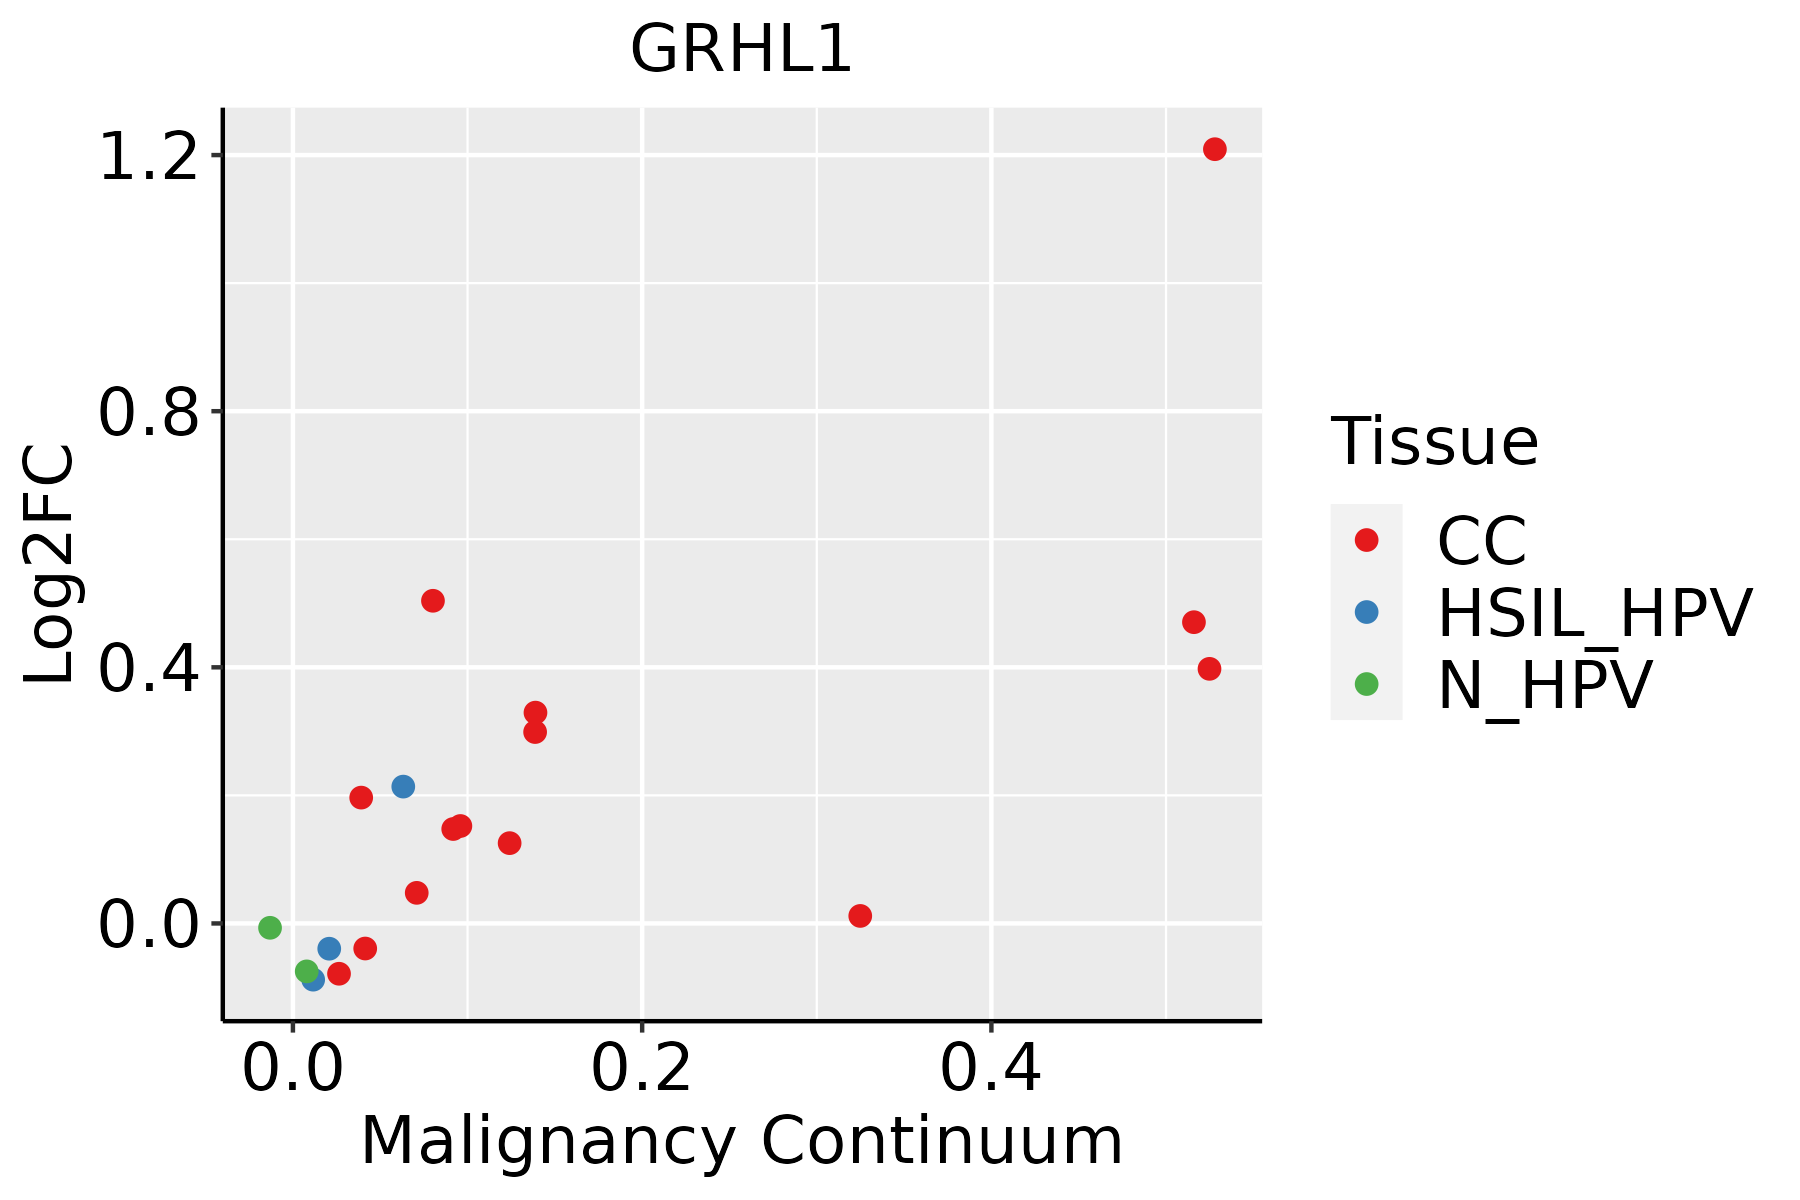 | CC: Cervix cancer |
| HSIL_HPV: HPV-infected high-grade squamous intraepithelial lesions | ||
| N_HPV: HPV-infected normal cervix | ||
| Esophagus |  | ESCC: Esophageal squamous cell carcinoma |
| HGIN: High-grade intraepithelial neoplasias | ||
| LGIN: Low-grade intraepithelial neoplasias | ||
| Oral Cavity |  | EOLP: Erosive Oral lichen planus |
| LP: leukoplakia | ||
| NEOLP: Non-erosive oral lichen planus | ||
| OSCC: Oral squamous cell carcinoma |
| ∗log2FC in expression of this searched gene in stem-like cells from each diseased tissue sample relative to stem-like cells in normal samples in each tissue plotted against the malignancy continuum. Samples are colored based on if they are from different disease stage. |
Top |
Malignant transformation related pathway analysis |
| Find out the enriched GO biological processes and KEGG pathways involved in transition from healthy to precancer to cancer |
| Tissue | Disease Stage | Enriched GO biological Processes |
| Colorectum | AD |  |
| Colorectum | SER |  |
| Colorectum | MSS |  |
| Colorectum | MSI-H |  |
| Colorectum | FAP |  |
| ∗Top 15 enriched GO BP terms are showed in the bar plot of each disease state in each tissue. Each row represents a significant GO biological process which is colored according to the -log10(p.adjust). |
| Page: 1 2 3 4 5 6 7 8 9 |
| GO ID | Tissue | Disease Stage | Description | Gene Ratio | Bg Ratio | pvalue | p.adjust | Count |
| GO:00085446 | Cervix | CC | epidermis development | 83/2311 | 324/18723 | 3.91e-11 | 8.54e-09 | 83 |
| GO:00435884 | Cervix | CC | skin development | 71/2311 | 263/18723 | 8.04e-11 | 1.46e-08 | 71 |
| GO:00302164 | Cervix | CC | keratinocyte differentiation | 42/2311 | 139/18723 | 1.74e-08 | 1.28e-06 | 42 |
| GO:00452169 | Cervix | CC | cell-cell junction organization | 53/2311 | 200/18723 | 3.83e-08 | 2.53e-06 | 53 |
| GO:00099137 | Cervix | CC | epidermal cell differentiation | 53/2311 | 202/18723 | 5.48e-08 | 3.25e-06 | 53 |
| GO:005087810 | Cervix | CC | regulation of body fluid levels | 78/2311 | 379/18723 | 3.20e-06 | 8.77e-05 | 78 |
| GO:00456822 | Cervix | CC | regulation of epidermis development | 22/2311 | 65/18723 | 5.56e-06 | 1.38e-04 | 22 |
| GO:00456042 | Cervix | CC | regulation of epidermal cell differentiation | 20/2311 | 58/18723 | 1.07e-05 | 2.33e-04 | 20 |
| GO:00029347 | Cervix | CC | desmosome organization | 7/2311 | 10/18723 | 3.69e-05 | 5.84e-04 | 7 |
| GO:00456163 | Cervix | CC | regulation of keratinocyte differentiation | 14/2311 | 37/18723 | 6.97e-05 | 9.81e-04 | 14 |
| GO:00308563 | Cervix | CC | regulation of epithelial cell differentiation | 36/2311 | 154/18723 | 1.02e-04 | 1.31e-03 | 36 |
| GO:00614362 | Cervix | CC | establishment of skin barrier | 10/2311 | 25/18723 | 4.52e-04 | 4.49e-03 | 10 |
| GO:00335612 | Cervix | CC | regulation of water loss via skin | 10/2311 | 27/18723 | 9.25e-04 | 7.84e-03 | 10 |
| GO:000854413 | Cervix | HSIL_HPV | epidermis development | 38/737 | 324/18723 | 1.92e-09 | 3.23e-07 | 38 |
| GO:003021611 | Cervix | HSIL_HPV | keratinocyte differentiation | 22/737 | 139/18723 | 2.53e-08 | 2.18e-06 | 22 |
| GO:004358813 | Cervix | HSIL_HPV | skin development | 31/737 | 263/18723 | 5.32e-08 | 3.89e-06 | 31 |
| GO:000991313 | Cervix | HSIL_HPV | epidermal cell differentiation | 26/737 | 202/18723 | 1.10e-07 | 7.15e-06 | 26 |
| GO:005087814 | Cervix | HSIL_HPV | regulation of body fluid levels | 37/737 | 379/18723 | 3.81e-07 | 2.06e-05 | 37 |
| GO:004521614 | Cervix | HSIL_HPV | cell-cell junction organization | 23/737 | 200/18723 | 4.21e-06 | 1.69e-04 | 23 |
| GO:004561611 | Cervix | HSIL_HPV | regulation of keratinocyte differentiation | 8/737 | 37/18723 | 7.77e-05 | 1.77e-03 | 8 |
| Page: 1 2 3 |
| Pathway ID | Tissue | Disease Stage | Description | Gene Ratio | Bg Ratio | pvalue | p.adjust | qvalue | Count |
| Page: 1 |
Top |
Cell-cell communication analysis |
| Identification of potential cell-cell interactions between two cell types and their ligand-receptor pairs for different disease states |
| Ligand | Receptor | LRpair | Pathway | Tissue | Disease Stage |
| Page: 1 |
Top |
Single-cell gene regulatory network inference analysis |
| Find out the significant the regulons (TFs) and the target genes of each regulon across cell types for different disease states |
| TF | Cell Type | Tissue | Disease Stage | Target Gene | RSS | Regulon Activity |
| GRHL1 | CLUB | Lung | Healthy | CASP7,SCGB3A2,CP, etc. | 1.84e-01 |  |
| GRHL1 | M1MAC | Prostate | ADJ | CCDC80,FBLN2,COL1A2, etc. | 1.06e-01 |  |
| GRHL1 | PLA | Prostate | ADJ | CCDC80,FBLN2,COL1A2, etc. | 2.44e-02 | |
| GRHL1 | NKT | Prostate | ADJ | CCDC80,FBLN2,COL1A2, etc. | 3.16e-02 | |
| GRHL1 | pDC | Prostate | BPH | CCDC80,FBLN2,COL1A2, etc. | 1.93e-01 |  |
| GRHL1 | MDSC | Prostate | Healthy | CCDC80,FBLN2,COL1A2, etc. | 3.48e-02 |  |
| GRHL1 | BN | Prostate | Healthy | CCDC80,FBLN2,COL1A2, etc. | 3.17e-02 | |
| GRHL1 | M1MAC | Prostate | Tumor | CCDC80,FBLN2,COL1A2, etc. | 2.34e-02 |  |
| GRHL1 | PLA | Prostate | Tumor | CCDC80,FBLN2,COL1A2, etc. | 2.84e-02 | |
| GRHL1 | DIF | Skin | Healthy | GRHL3,LYPD3,KDM2A, etc. | 2.44e-01 |  |
| ∗The dot plots of a searched regulon are shown for all cell subpopulations in each disease state of each tissue based on the regulon specific score inferred using pySCENIC and by calculating the average expression. |
| Page: 1 |
Top |
Somatic mutation of malignant transformation related genes |
| Annotation of somatic variants for genes involved in malignant transformation |
| Hugo Symbol | Variant Class | Variant Classification | dbSNP RS | HGVSc | HGVSp | HGVSp Short | SWISSPROT | BIOTYPE | SIFT | PolyPhen | Tumor Sample Barcode | Tissue | Histology | Sex | Age | Stage | Therapy Types | Drugs | Outcome |
| GRHL1 | SNV | Missense_Mutation | c.211N>G | p.Pro71Ala | p.P71A | Q9NZI5 | protein_coding | deleterious(0) | probably_damaging(0.999) | TCGA-A7-A3IZ-01 | Breast | breast invasive carcinoma | Female | <65 | I/II | Chemotherapy | cytoxan | SD | |
| GRHL1 | SNV | Missense_Mutation | c.1388N>C | p.Phe463Ser | p.F463S | Q9NZI5 | protein_coding | tolerated(0.09) | benign(0.084) | TCGA-A8-A09Z-01 | Breast | breast invasive carcinoma | Female | >=65 | I/II | Unknown | Unknown | SD | |
| GRHL1 | SNV | Missense_Mutation | c.1286N>C | p.Ile429Thr | p.I429T | Q9NZI5 | protein_coding | deleterious(0.04) | probably_damaging(0.992) | TCGA-AR-A251-01 | Breast | breast invasive carcinoma | Female | <65 | III/IV | Chemotherapy | doxorubicin | SD | |
| GRHL1 | SNV | Missense_Mutation | c.1169G>A | p.Gly390Glu | p.G390E | Q9NZI5 | protein_coding | deleterious(0) | probably_damaging(1) | TCGA-EW-A1PB-01 | Breast | breast invasive carcinoma | Female | >=65 | III/IV | Unknown | Unknown | SD | |
| GRHL1 | SNV | Missense_Mutation | novel | c.1796N>T | p.Thr599Ile | p.T599I | Q9NZI5 | protein_coding | deleterious(0) | probably_damaging(0.999) | TCGA-EA-A3HS-01 | Cervix | cervical & endocervical cancer | Female | <65 | I/II | Unknown | Unknown | SD |
| GRHL1 | SNV | Missense_Mutation | rs140008573 | c.1020N>A | p.Asp340Glu | p.D340E | Q9NZI5 | protein_coding | deleterious(0) | probably_damaging(0.998) | TCGA-FU-A3HZ-01 | Cervix | cervical & endocervical cancer | Female | <65 | I/II | Chemotherapy | cisplatin | CR |
| GRHL1 | SNV | Missense_Mutation | novel | c.158N>A | p.Gly53Glu | p.G53E | Q9NZI5 | protein_coding | deleterious(0) | probably_damaging(1) | TCGA-VS-A94X-01 | Cervix | cervical & endocervical cancer | Female | <65 | I/II | Chemotherapy | cisplatin | PD |
| GRHL1 | SNV | Missense_Mutation | rs761869341 | c.1186N>G | p.Gln396Glu | p.Q396E | Q9NZI5 | protein_coding | deleterious(0) | probably_damaging(0.997) | TCGA-AM-5820-01 | Colorectum | colon adenocarcinoma | Female | <65 | I/II | Unknown | Unknown | SD |
| GRHL1 | SNV | Missense_Mutation | novel | c.13N>C | p.Tyr5His | p.Y5H | Q9NZI5 | protein_coding | tolerated(0.58) | benign(0) | TCGA-AZ-4315-01 | Colorectum | colon adenocarcinoma | Male | <65 | I/II | Unknown | Unknown | SD |
| GRHL1 | SNV | Missense_Mutation | novel | c.881N>C | p.His294Pro | p.H294P | Q9NZI5 | protein_coding | tolerated(0.15) | possibly_damaging(0.646) | TCGA-AZ-4315-01 | Colorectum | colon adenocarcinoma | Male | <65 | I/II | Unknown | Unknown | SD |
| Page: 1 2 3 4 5 6 7 8 9 |
Top |
Related drugs of malignant transformation related genes |
| Identification of chemicals and drugs interact with genes involved in malignant transfromation |
| (DGIdb 4.0) |
| Entrez ID | Symbol | Category | Interaction Types | Drug Claim Name | Drug Name | PMIDs |
| Page: 1 |

Copyright 2023-Present -The University of Texas Health Science Center at Houston |