
|
|||||
|
 | |
| |
| |
| |
| |
| |
|
Gene: GREM2 |
Gene summary for GREM2 |
| Gene information | Species | Human | Gene symbol | GREM2 | Gene ID | 64388 |
| Gene name | gremlin 2, DAN family BMP antagonist | |
| Gene Alias | CKTSF1B2 | |
| Cytomap | 1q43 | |
| Gene Type | protein-coding | GO ID | GO:0007154 | UniProtAcc | A0A024R3Y1 |
Top |
Malignant transformation analysis |
| Identification of the aberrant gene expression in precancerous and cancerous lesions by comparing the gene expression of stem-like cells in diseased tissues with normal stem cells |
| Entrez ID | Symbol | Replicates | Species | Organ | Tissue | Adj P-value | Log2FC | Malignancy |
| 64388 | GREM2 | AEH-subject5 | Human | Endometrium | AEH | 3.67e-02 | -9.49e-02 | -0.2953 |
| 64388 | GREM2 | EEC-subject1 | Human | Endometrium | EEC | 1.85e-03 | 4.31e-01 | -0.2682 |
| 64388 | GREM2 | EEC-subject2 | Human | Endometrium | EEC | 3.90e-03 | -1.25e-01 | -0.2607 |
| 64388 | GREM2 | EEC-subject3 | Human | Endometrium | EEC | 2.35e-05 | -9.08e-02 | -0.2525 |
| 64388 | GREM2 | EEC-subject5 | Human | Endometrium | EEC | 4.07e-08 | -1.48e-01 | -0.249 |
| 64388 | GREM2 | GSM5276934 | Human | Endometrium | EEC | 4.06e-07 | -1.44e-01 | -0.0913 |
| 64388 | GREM2 | GSM5276937 | Human | Endometrium | EEC | 3.33e-05 | -1.48e-01 | -0.0897 |
| 64388 | GREM2 | GSM6177620_NYU_UCEC1_lib1_lib1 | Human | Endometrium | EEC | 3.59e-04 | -1.48e-01 | -0.1869 |
| 64388 | GREM2 | GSM6177620_NYU_UCEC1_lib2_lib2 | Human | Endometrium | EEC | 2.04e-03 | -1.48e-01 | -0.1875 |
| 64388 | GREM2 | GSM6177620_NYU_UCEC1_lib3_lib3 | Human | Endometrium | EEC | 5.38e-04 | -1.30e-01 | -0.1883 |
| 64388 | GREM2 | GSM6177621_NYU_UCEC2_lib1_lib1 | Human | Endometrium | EEC | 6.84e-07 | 3.19e-01 | -0.1934 |
| 64388 | GREM2 | GSM6177622_NYU_UCEC3_lib1_lib1 | Human | Endometrium | EEC | 4.06e-07 | -1.48e-01 | -0.1917 |
| 64388 | GREM2 | GSM6177622_NYU_UCEC3_lib2_lib2 | Human | Endometrium | EEC | 1.65e-06 | -1.48e-01 | -0.1916 |
| 64388 | GREM2 | GSM6177623_NYU_UCEC3_Vis | Human | Endometrium | EEC | 8.77e-08 | -1.43e-01 | -0.1269 |
| Page: 1 |
| Tissue | Expression Dynamics | Abbreviation |
| Endometrium | 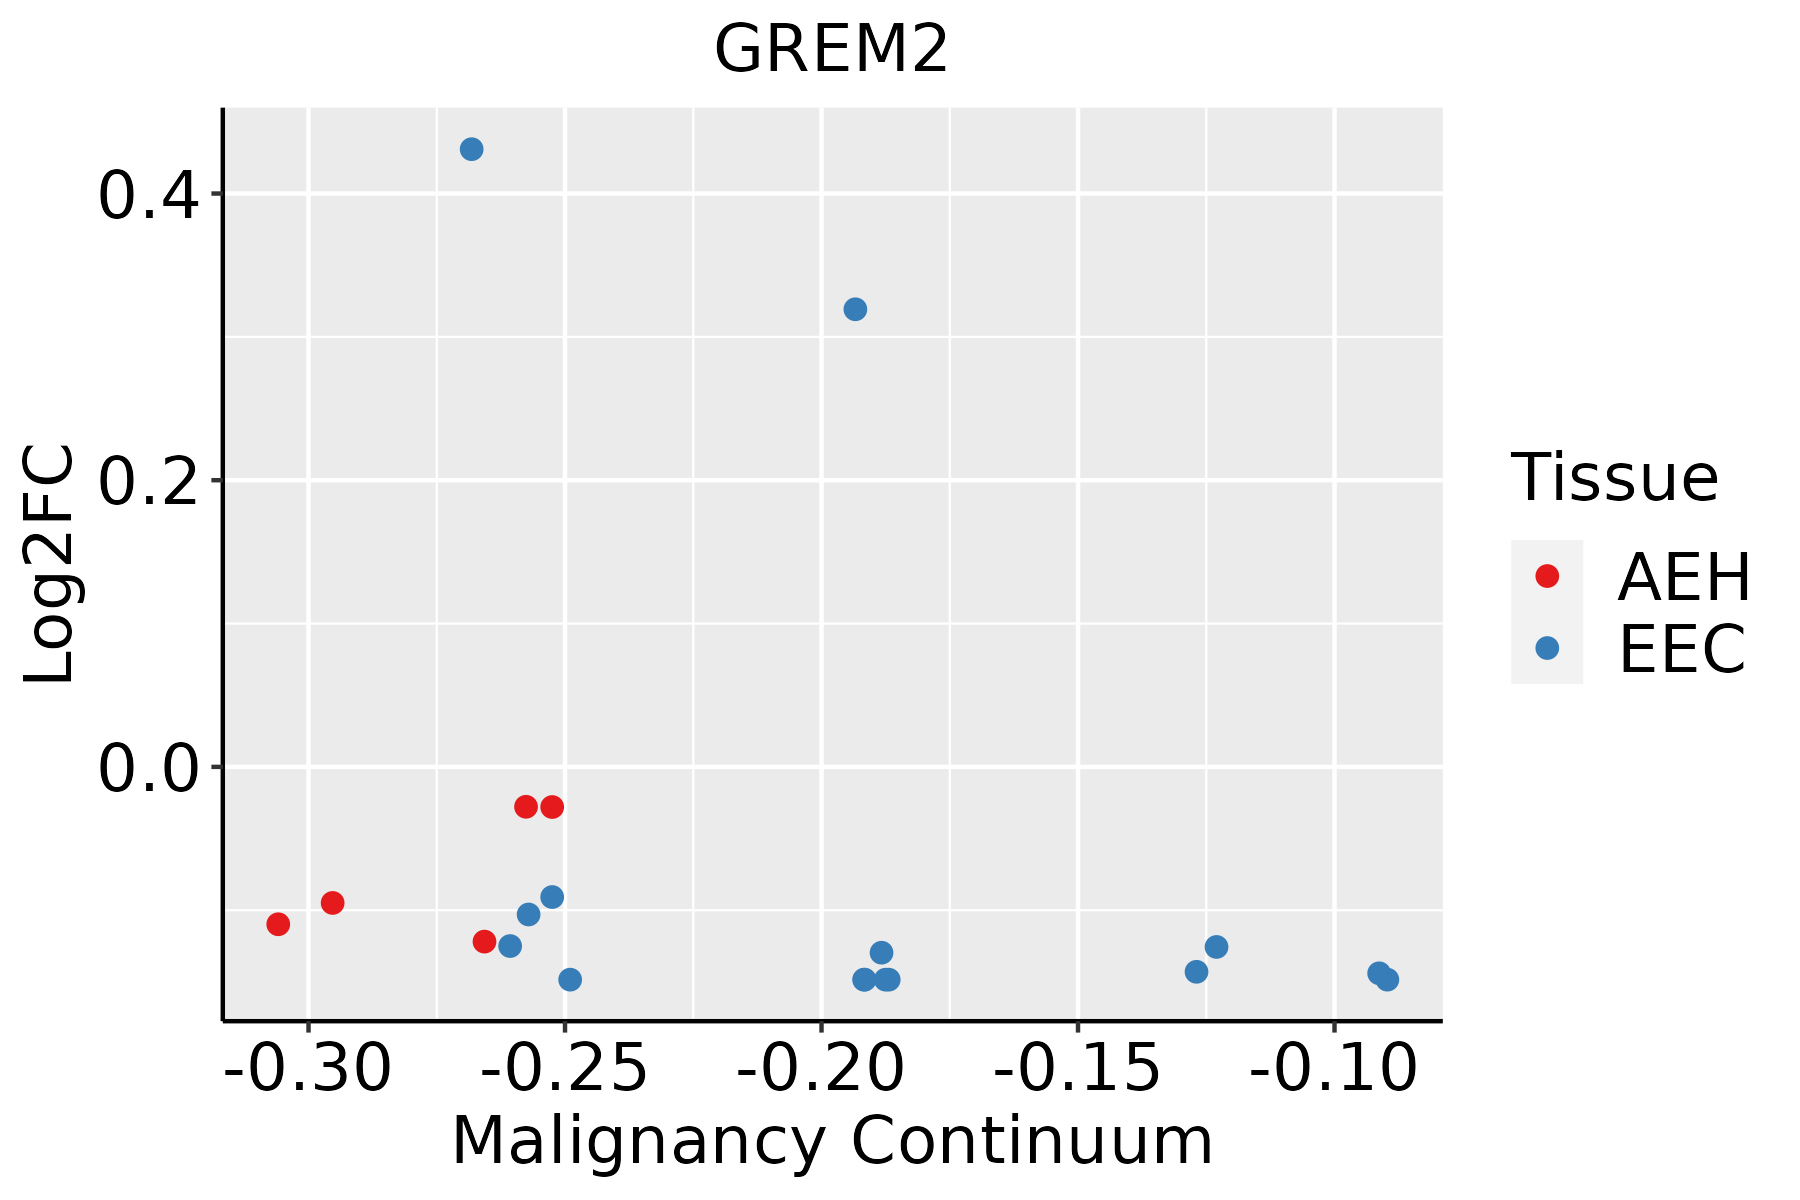 | AEH: Atypical endometrial hyperplasia |
| EEC: Endometrioid Cancer |
| ∗log2FC in expression of this searched gene in stem-like cells from each diseased tissue sample relative to stem-like cells in normal samples in each tissue plotted against the malignancy continuum. Samples are colored based on if they are from different disease stage. |
Top |
Malignant transformation related pathway analysis |
| Find out the enriched GO biological processes and KEGG pathways involved in transition from healthy to precancer to cancer |
| Tissue | Disease Stage | Enriched GO biological Processes |
| Colorectum | AD |  |
| Colorectum | SER |  |
| Colorectum | MSS |  |
| Colorectum | MSI-H |  |
| Colorectum | FAP |  |
| ∗Top 15 enriched GO BP terms are showed in the bar plot of each disease state in each tissue. Each row represents a significant GO biological process which is colored according to the -log10(p.adjust). |
| Page: 1 2 3 4 5 6 7 8 9 |
| GO ID | Tissue | Disease Stage | Description | Gene Ratio | Bg Ratio | pvalue | p.adjust | Count |
| GO:005109816 | Endometrium | AEH | regulation of binding | 77/2100 | 363/18723 | 2.21e-08 | 1.31e-06 | 77 |
| GO:00071787 | Endometrium | AEH | transmembrane receptor protein serine/threonine kinase signaling pathway | 67/2100 | 355/18723 | 1.28e-05 | 2.80e-04 | 67 |
| GO:004339310 | Endometrium | AEH | regulation of protein binding | 42/2100 | 196/18723 | 2.58e-05 | 4.86e-04 | 42 |
| GO:00305092 | Endometrium | AEH | BMP signaling pathway | 32/2100 | 152/18723 | 3.15e-04 | 3.54e-03 | 32 |
| GO:00717722 | Endometrium | AEH | response to BMP | 32/2100 | 165/18723 | 1.38e-03 | 1.16e-02 | 32 |
| GO:00717732 | Endometrium | AEH | cellular response to BMP stimulus | 32/2100 | 165/18723 | 1.38e-03 | 1.16e-02 | 32 |
| GO:00900922 | Endometrium | AEH | regulation of transmembrane receptor protein serine/threonine kinase signaling pathway | 43/2100 | 256/18723 | 4.47e-03 | 2.93e-02 | 43 |
| GO:005109817 | Endometrium | EEC | regulation of binding | 83/2168 | 363/18723 | 6.72e-10 | 6.61e-08 | 83 |
| GO:004339315 | Endometrium | EEC | regulation of protein binding | 46/2168 | 196/18723 | 1.94e-06 | 5.80e-05 | 46 |
| GO:000717814 | Endometrium | EEC | transmembrane receptor protein serine/threonine kinase signaling pathway | 68/2168 | 355/18723 | 1.90e-05 | 3.50e-04 | 68 |
| GO:003050911 | Endometrium | EEC | BMP signaling pathway | 32/2168 | 152/18723 | 5.52e-04 | 5.52e-03 | 32 |
| GO:007177211 | Endometrium | EEC | response to BMP | 33/2168 | 165/18723 | 1.16e-03 | 9.90e-03 | 33 |
| GO:007177311 | Endometrium | EEC | cellular response to BMP stimulus | 33/2168 | 165/18723 | 1.16e-03 | 9.90e-03 | 33 |
| GO:009009211 | Endometrium | EEC | regulation of transmembrane receptor protein serine/threonine kinase signaling pathway | 44/2168 | 256/18723 | 4.72e-03 | 3.00e-02 | 44 |
| Page: 1 |
| Pathway ID | Tissue | Disease Stage | Description | Gene Ratio | Bg Ratio | pvalue | p.adjust | qvalue | Count |
| hsa043504 | Endometrium | AEH | TGF-beta signaling pathway | 26/1197 | 108/8465 | 3.82e-03 | 2.18e-02 | 1.59e-02 | 26 |
| hsa0435011 | Endometrium | AEH | TGF-beta signaling pathway | 26/1197 | 108/8465 | 3.82e-03 | 2.18e-02 | 1.59e-02 | 26 |
| hsa043502 | Endometrium | EEC | TGF-beta signaling pathway | 26/1237 | 108/8465 | 5.95e-03 | 3.12e-02 | 2.33e-02 | 26 |
| hsa043503 | Endometrium | EEC | TGF-beta signaling pathway | 26/1237 | 108/8465 | 5.95e-03 | 3.12e-02 | 2.33e-02 | 26 |
| Page: 1 |
Top |
Cell-cell communication analysis |
| Identification of potential cell-cell interactions between two cell types and their ligand-receptor pairs for different disease states |
| Ligand | Receptor | LRpair | Pathway | Tissue | Disease Stage |
| Page: 1 |
Top |
Single-cell gene regulatory network inference analysis |
| Find out the significant the regulons (TFs) and the target genes of each regulon across cell types for different disease states |
| TF | Cell Type | Tissue | Disease Stage | Target Gene | RSS | Regulon Activity |
| ∗The dot plots of a searched regulon are shown for all cell subpopulations in each disease state of each tissue based on the regulon specific score inferred using pySCENIC and by calculating the average expression. |
| Page: 1 |
Top |
Somatic mutation of malignant transformation related genes |
| Annotation of somatic variants for genes involved in malignant transformation |
| Hugo Symbol | Variant Class | Variant Classification | dbSNP RS | HGVSc | HGVSp | HGVSp Short | SWISSPROT | BIOTYPE | SIFT | PolyPhen | Tumor Sample Barcode | Tissue | Histology | Sex | Age | Stage | Therapy Types | Drugs | Outcome |
| GREM2 | SNV | Missense_Mutation | c.80N>T | p.Ala27Val | p.A27V | Q9H772 | protein_coding | tolerated(0.23) | benign(0.09) | TCGA-AR-A255-01 | Breast | breast invasive carcinoma | Female | <65 | I/II | Targeted Molecular therapy | trastuzumab | SD | |
| GREM2 | SNV | Missense_Mutation | c.361N>A | p.Ala121Thr | p.A121T | Q9H772 | protein_coding | tolerated(0.11) | probably_damaging(0.914) | TCGA-C8-A1HL-01 | Breast | breast invasive carcinoma | Female | <65 | III/IV | Unknown | Unknown | SD | |
| GREM2 | SNV | Missense_Mutation | rs34188522 | c.391N>A | p.Val131Ile | p.V131I | Q9H772 | protein_coding | tolerated(0.69) | benign(0.027) | TCGA-D8-A1XJ-01 | Breast | breast invasive carcinoma | Female | >=65 | III/IV | Hormone Therapy | tamoxiphen | SD |
| GREM2 | SNV | Missense_Mutation | novel | c.169N>A | p.Gln57Lys | p.Q57K | Q9H772 | protein_coding | tolerated(0.16) | benign(0.079) | TCGA-D8-A1XL-01 | Breast | breast invasive carcinoma | Female | <65 | I/II | Chemotherapy | doxorubicine+cyclophosphamide+tamoxifen | SD |
| GREM2 | SNV | Missense_Mutation | c.337G>A | p.Glu113Lys | p.E113K | Q9H772 | protein_coding | tolerated(0.17) | benign(0.063) | TCGA-A6-2686-01 | Colorectum | colon adenocarcinoma | Female | >=65 | I/II | Unknown | Unknown | SD | |
| GREM2 | SNV | Missense_Mutation | c.85N>A | p.Ala29Thr | p.A29T | Q9H772 | protein_coding | tolerated(0.15) | possibly_damaging(0.536) | TCGA-AA-3950-01 | Colorectum | colon adenocarcinoma | Female | >=65 | I/II | Unknown | Unknown | SD | |
| GREM2 | SNV | Missense_Mutation | c.337N>A | p.Glu113Lys | p.E113K | Q9H772 | protein_coding | tolerated(0.17) | benign(0.063) | TCGA-AZ-4313-01 | Colorectum | colon adenocarcinoma | Female | <65 | I/II | Unknown | Unknown | SD | |
| GREM2 | SNV | Missense_Mutation | c.85G>A | p.Ala29Thr | p.A29T | Q9H772 | protein_coding | tolerated(0.15) | possibly_damaging(0.536) | TCGA-AZ-6601-01 | Colorectum | colon adenocarcinoma | Male | >=65 | I/II | Unknown | Unknown | PD | |
| GREM2 | SNV | Missense_Mutation | c.361N>A | p.Ala121Thr | p.A121T | Q9H772 | protein_coding | tolerated(0.11) | probably_damaging(0.914) | TCGA-D5-6540-01 | Colorectum | colon adenocarcinoma | Male | >=65 | I/II | Unknown | Unknown | SD | |
| GREM2 | SNV | Missense_Mutation | c.361N>A | p.Ala121Thr | p.A121T | Q9H772 | protein_coding | tolerated(0.11) | probably_damaging(0.914) | TCGA-D5-6928-01 | Colorectum | colon adenocarcinoma | Male | >=65 | I/II | Unknown | Unknown | SD |
| Page: 1 2 3 4 5 |
Top |
Related drugs of malignant transformation related genes |
| Identification of chemicals and drugs interact with genes involved in malignant transfromation |
| (DGIdb 4.0) |
| Entrez ID | Symbol | Category | Interaction Types | Drug Claim Name | Drug Name | PMIDs |
| 64388 | GREM2 | DRUGGABLE GENOME | allopurinol | ALLOPURINOL | 30924126 |
| Page: 1 |

Copyright 2023-Present -The University of Texas Health Science Center at Houston |