
|
|||||
|
 | |
| |
| |
| |
| |
| |
|
Gene: GREM1 |
Gene summary for GREM1 |
| Gene information | Species | Human | Gene symbol | GREM1 | Gene ID | 26585 |
| Gene name | gremlin 1, DAN family BMP antagonist | |
| Gene Alias | C15DUPq | |
| Cytomap | 15q13.3 | |
| Gene Type | protein-coding | GO ID | GO:0000902 | UniProtAcc | B3KTR9 |
Top |
Malignant transformation analysis |
| Identification of the aberrant gene expression in precancerous and cancerous lesions by comparing the gene expression of stem-like cells in diseased tissues with normal stem cells |
| Entrez ID | Symbol | Replicates | Species | Organ | Tissue | Adj P-value | Log2FC | Malignancy |
| 26585 | GREM1 | P4T-E | Human | Esophagus | ESCC | 1.06e-03 | 6.21e-01 | 0.1323 |
| 26585 | GREM1 | P26T-E | Human | Esophagus | ESCC | 2.00e-03 | 1.23e-02 | 0.1276 |
| 26585 | GREM1 | P44T-E | Human | Esophagus | ESCC | 6.70e-04 | 8.67e-01 | 0.1096 |
| 26585 | GREM1 | P49T-E | Human | Esophagus | ESCC | 1.34e-04 | 1.49e+00 | 0.1768 |
| 26585 | GREM1 | NEOLP-1 | Human | Oral cavity | NEOLP | 2.68e-04 | 2.30e-01 | -0.0194 |
| 26585 | GREM1 | male-WTA | Human | Thyroid | PTC | 1.68e-15 | 2.33e-01 | 0.1037 |
| 26585 | GREM1 | ATC12 | Human | Thyroid | ATC | 6.99e-29 | 7.59e-01 | 0.34 |
| 26585 | GREM1 | ATC13 | Human | Thyroid | ATC | 2.43e-03 | 1.04e-01 | 0.34 |
| 26585 | GREM1 | ATC4 | Human | Thyroid | ATC | 4.66e-35 | 9.71e-01 | 0.34 |
| 26585 | GREM1 | ATC5 | Human | Thyroid | ATC | 2.56e-04 | 1.24e-01 | 0.34 |
| Page: 1 |
| Tissue | Expression Dynamics | Abbreviation |
| Esophagus | 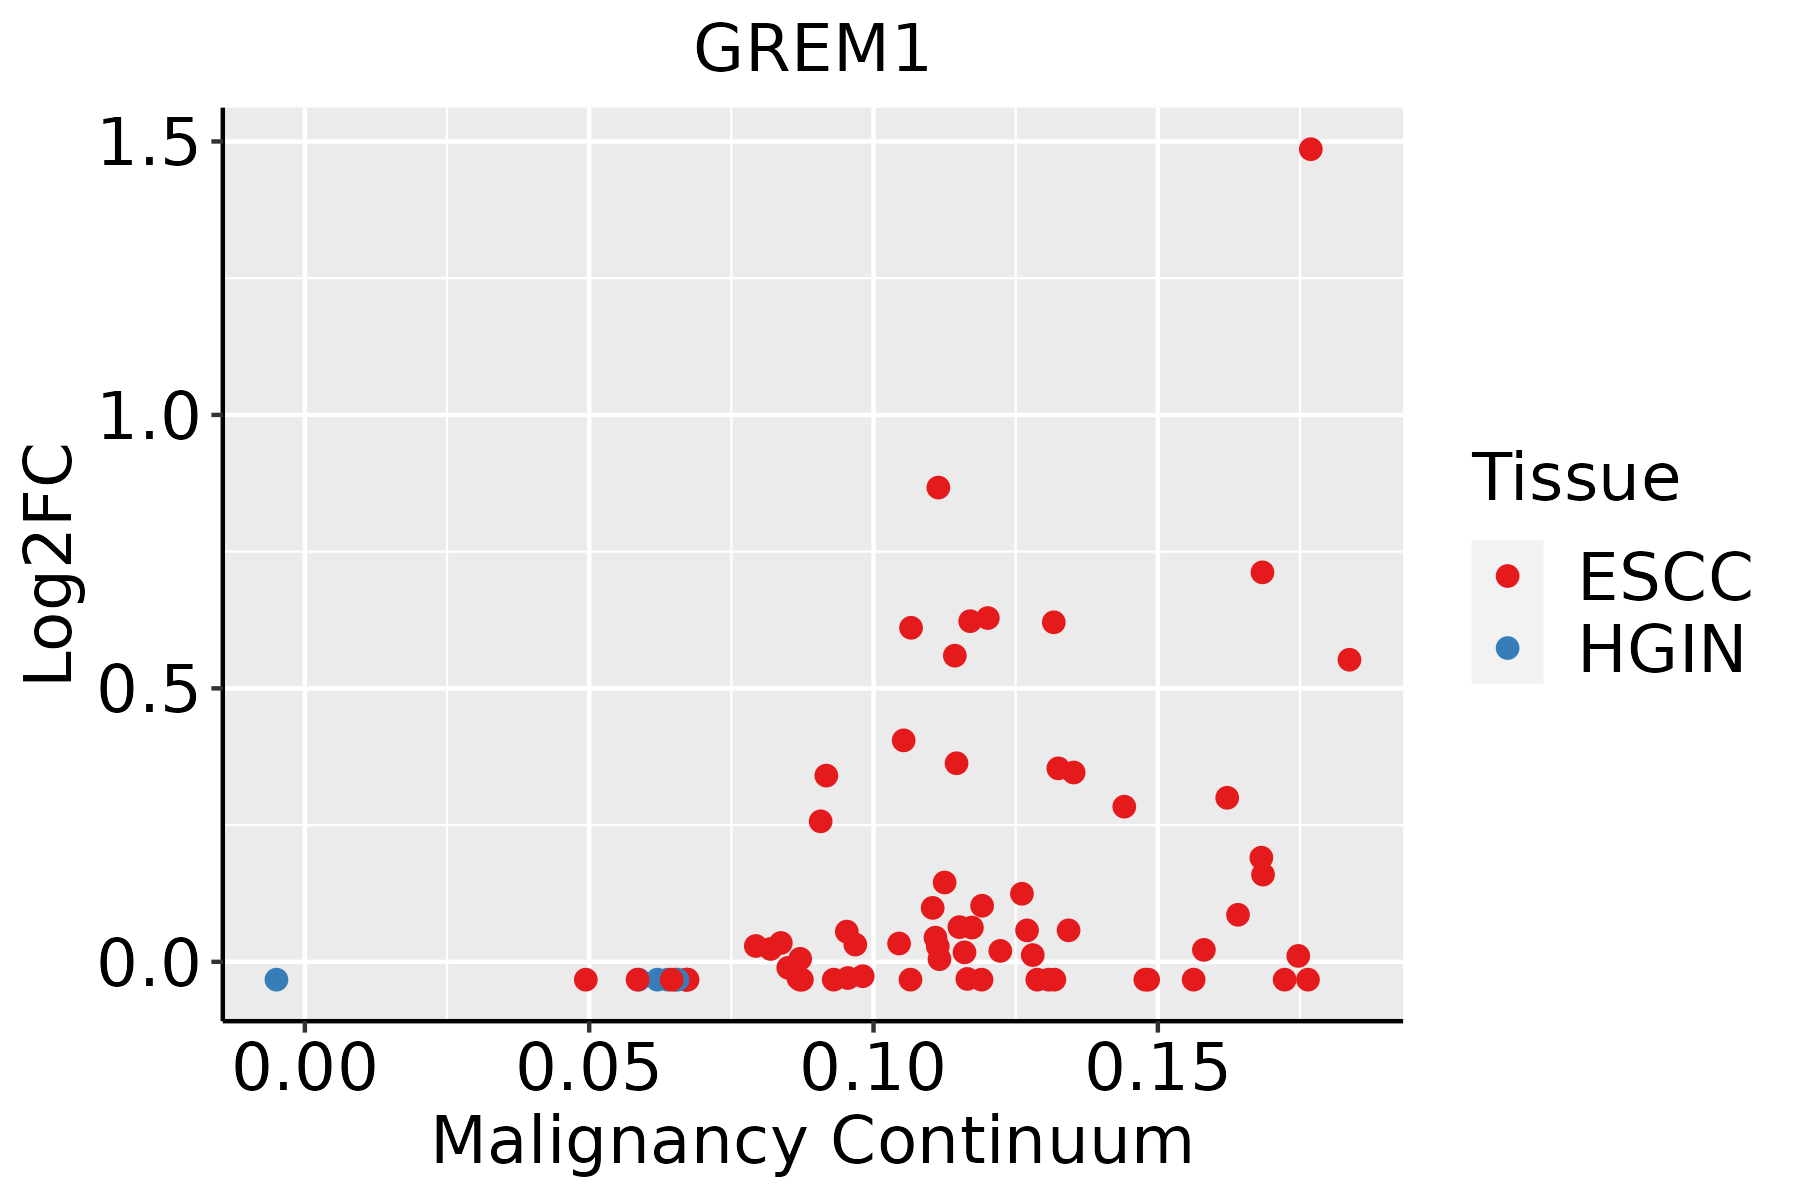 | ESCC: Esophageal squamous cell carcinoma |
| HGIN: High-grade intraepithelial neoplasias | ||
| LGIN: Low-grade intraepithelial neoplasias | ||
| Oral Cavity | 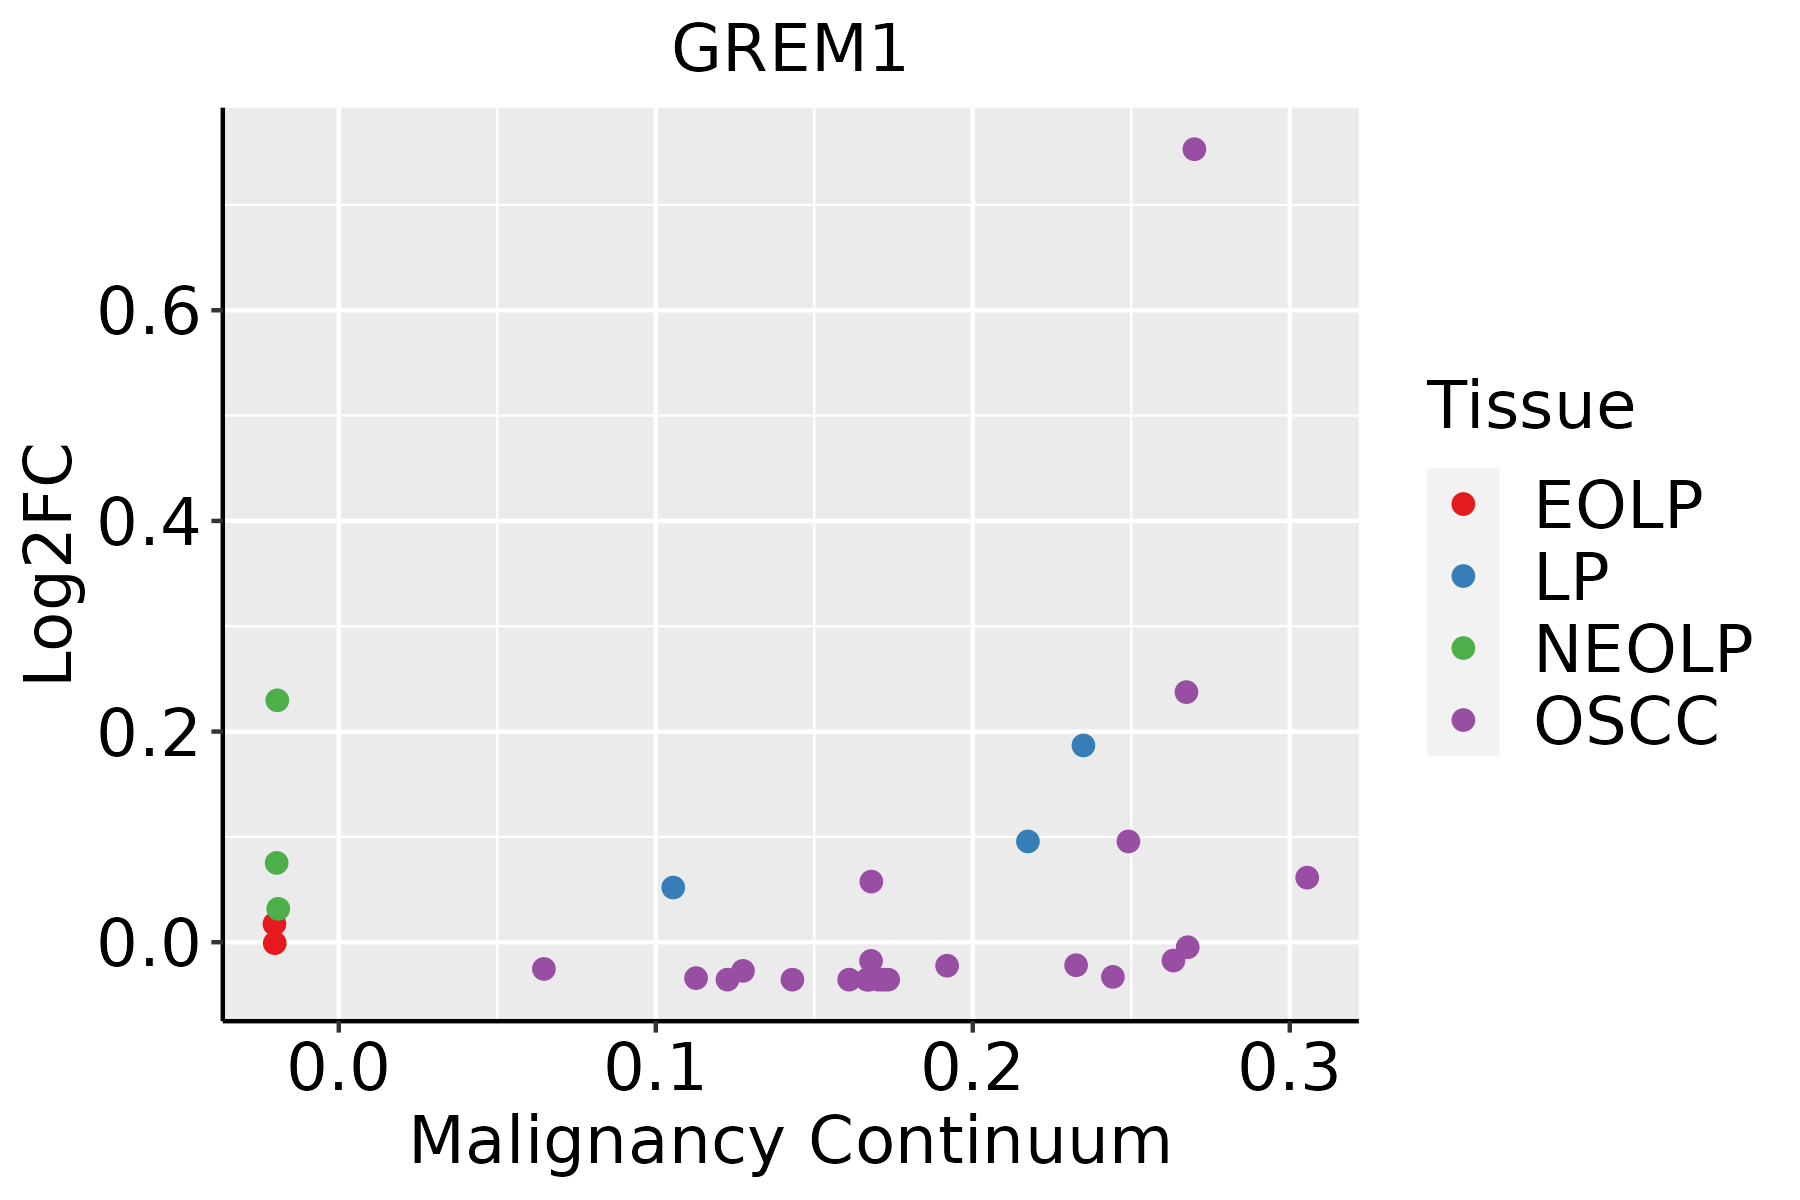 | EOLP: Erosive Oral lichen planus |
| LP: leukoplakia | ||
| NEOLP: Non-erosive oral lichen planus | ||
| OSCC: Oral squamous cell carcinoma | ||
| Thyroid | 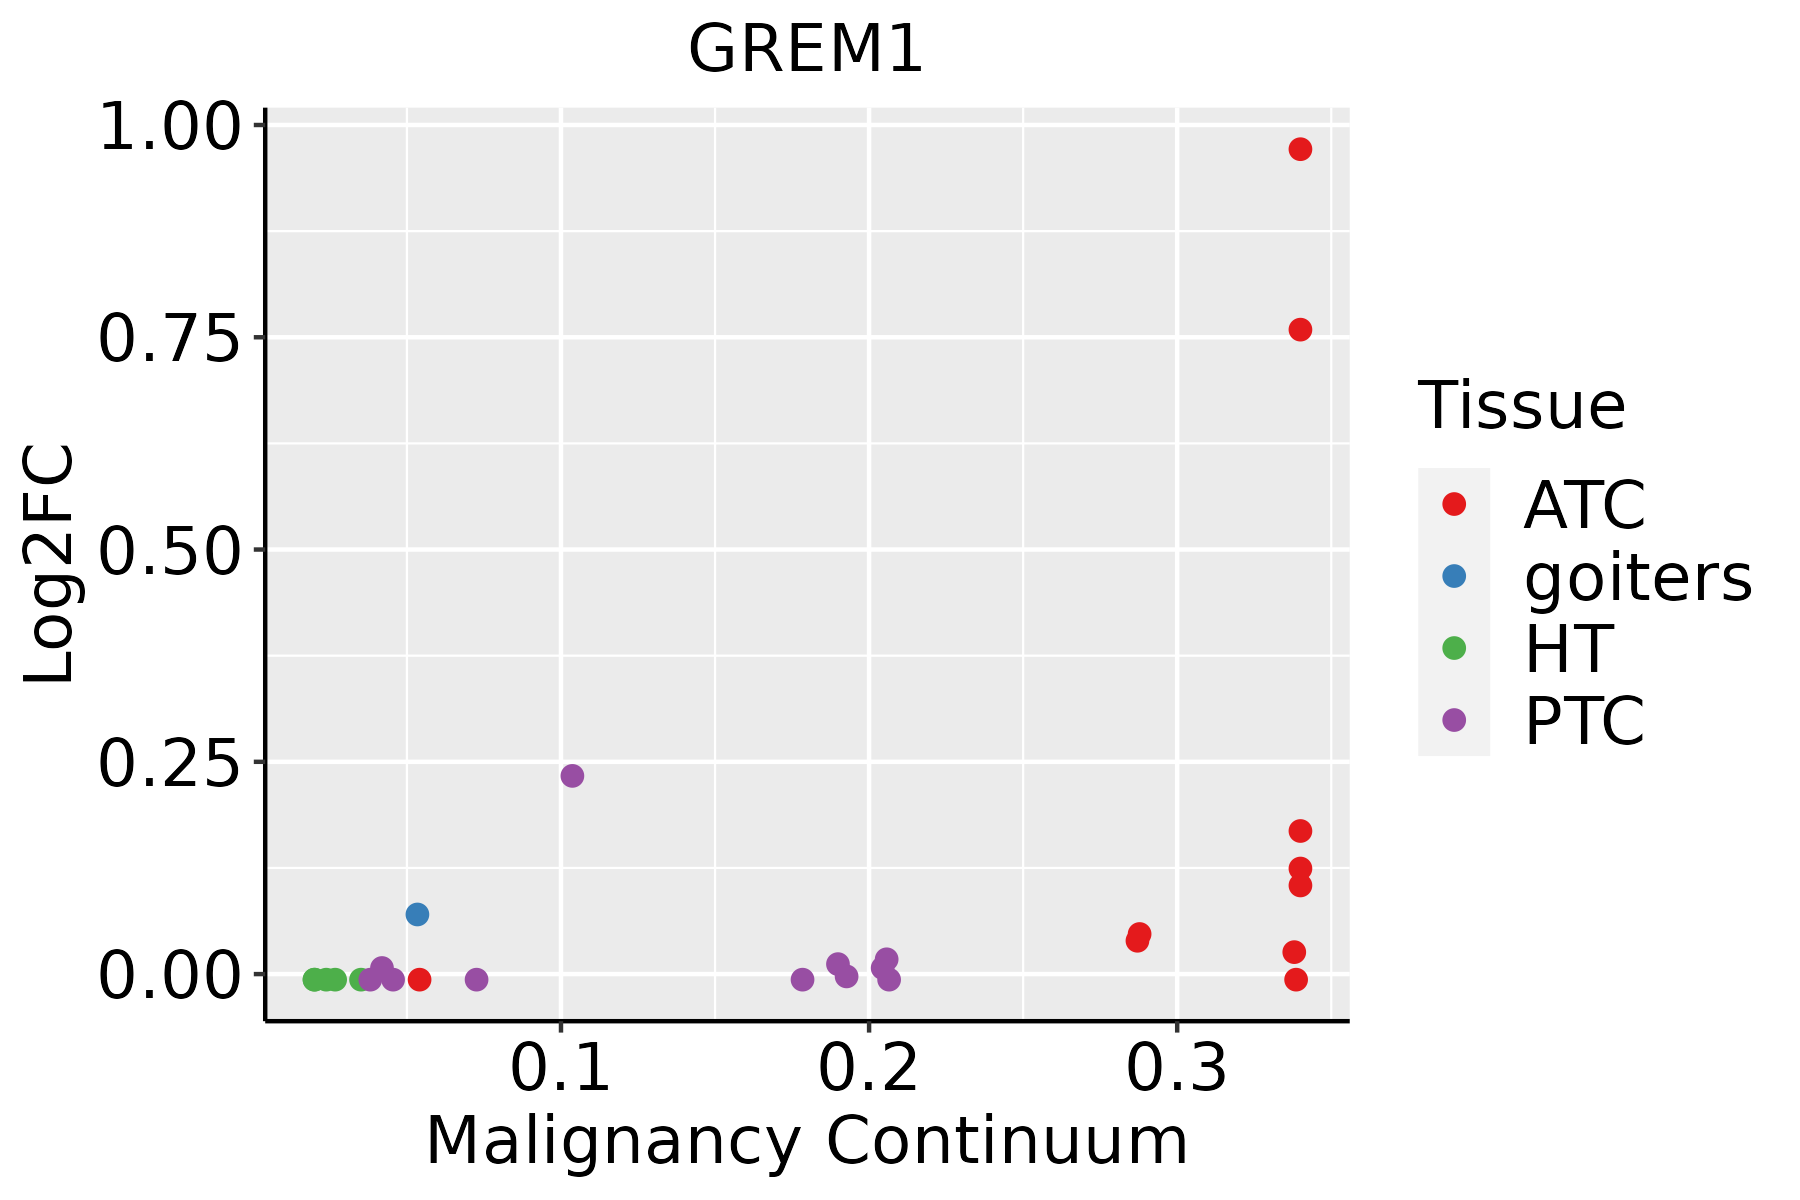 | ATC: Anaplastic thyroid cancer |
| HT: Hashimoto's thyroiditis | ||
| PTC: Papillary thyroid cancer |
| ∗log2FC in expression of this searched gene in stem-like cells from each diseased tissue sample relative to stem-like cells in normal samples in each tissue plotted against the malignancy continuum. Samples are colored based on if they are from different disease stage. |
Top |
Malignant transformation related pathway analysis |
| Find out the enriched GO biological processes and KEGG pathways involved in transition from healthy to precancer to cancer |
| Tissue | Disease Stage | Enriched GO biological Processes |
| Colorectum | AD |  |
| Colorectum | SER |  |
| Colorectum | MSS |  |
| Colorectum | MSI-H |  |
| Colorectum | FAP |  |
| ∗Top 15 enriched GO BP terms are showed in the bar plot of each disease state in each tissue. Each row represents a significant GO biological process which is colored according to the -log10(p.adjust). |
| Page: 1 2 3 4 5 6 7 8 9 |
| GO ID | Tissue | Disease Stage | Description | Gene Ratio | Bg Ratio | pvalue | p.adjust | Count |
| GO:005105215 | Esophagus | ESCC | regulation of DNA metabolic process | 232/8552 | 359/18723 | 2.40e-13 | 1.13e-11 | 232 |
| GO:0010563111 | Esophagus | ESCC | negative regulation of phosphorus metabolic process | 274/8552 | 442/18723 | 2.32e-12 | 9.41e-11 | 274 |
| GO:0045936111 | Esophagus | ESCC | negative regulation of phosphate metabolic process | 273/8552 | 441/18723 | 3.18e-12 | 1.25e-10 | 273 |
| GO:007189716 | Esophagus | ESCC | DNA biosynthetic process | 127/8552 | 180/18723 | 1.04e-11 | 3.85e-10 | 127 |
| GO:005105417 | Esophagus | ESCC | positive regulation of DNA metabolic process | 139/8552 | 201/18723 | 1.20e-11 | 4.33e-10 | 139 |
| GO:200057319 | Esophagus | ESCC | positive regulation of DNA biosynthetic process | 56/8552 | 66/18723 | 4.51e-11 | 1.45e-09 | 56 |
| GO:2000278110 | Esophagus | ESCC | regulation of DNA biosynthetic process | 81/8552 | 106/18723 | 9.81e-11 | 2.96e-09 | 81 |
| GO:0016049110 | Esophagus | ESCC | cell growth | 289/8552 | 482/18723 | 1.29e-10 | 3.77e-09 | 289 |
| GO:0042326111 | Esophagus | ESCC | negative regulation of phosphorylation | 237/8552 | 385/18723 | 1.86e-10 | 5.33e-09 | 237 |
| GO:001605517 | Esophagus | ESCC | Wnt signaling pathway | 268/8552 | 444/18723 | 2.32e-10 | 6.58e-09 | 268 |
| GO:019873817 | Esophagus | ESCC | cell-cell signaling by wnt | 269/8552 | 446/18723 | 2.41e-10 | 6.79e-09 | 269 |
| GO:0150115110 | Esophagus | ESCC | cell-substrate junction organization | 77/8552 | 101/18723 | 3.46e-10 | 9.57e-09 | 77 |
| GO:0001933111 | Esophagus | ESCC | negative regulation of protein phosphorylation | 213/8552 | 342/18723 | 3.54e-10 | 9.76e-09 | 213 |
| GO:000704418 | Esophagus | ESCC | cell-substrate junction assembly | 73/8552 | 95/18723 | 5.27e-10 | 1.35e-08 | 73 |
| GO:000155819 | Esophagus | ESCC | regulation of cell growth | 248/8552 | 414/18723 | 2.97e-09 | 6.45e-08 | 248 |
| GO:003158919 | Esophagus | ESCC | cell-substrate adhesion | 221/8552 | 363/18723 | 3.06e-09 | 6.62e-08 | 221 |
| GO:001081020 | Esophagus | ESCC | regulation of cell-substrate adhesion | 144/8552 | 221/18723 | 3.55e-09 | 7.45e-08 | 144 |
| GO:004804116 | Esophagus | ESCC | focal adhesion assembly | 65/8552 | 87/18723 | 3.28e-08 | 6.08e-07 | 65 |
| GO:003010018 | Esophagus | ESCC | regulation of endocytosis | 135/8552 | 211/18723 | 5.75e-08 | 1.02e-06 | 135 |
| GO:005197217 | Esophagus | ESCC | regulation of telomerase activity | 39/8552 | 47/18723 | 1.48e-07 | 2.35e-06 | 39 |
| Page: 1 2 3 4 5 6 7 8 9 10 11 12 13 14 15 16 17 18 19 20 21 22 23 |
| Pathway ID | Tissue | Disease Stage | Description | Gene Ratio | Bg Ratio | pvalue | p.adjust | qvalue | Count |
| hsa043507 | Esophagus | ESCC | TGF-beta signaling pathway | 69/4205 | 108/8465 | 1.92e-03 | 5.54e-03 | 2.84e-03 | 69 |
| hsa0435014 | Esophagus | ESCC | TGF-beta signaling pathway | 69/4205 | 108/8465 | 1.92e-03 | 5.54e-03 | 2.84e-03 | 69 |
| hsa0435041 | Oral cavity | NEOLP | TGF-beta signaling pathway | 28/1112 | 108/8465 | 2.46e-04 | 1.62e-03 | 1.02e-03 | 28 |
| hsa0435051 | Oral cavity | NEOLP | TGF-beta signaling pathway | 28/1112 | 108/8465 | 2.46e-04 | 1.62e-03 | 1.02e-03 | 28 |
| Page: 1 |
Top |
Cell-cell communication analysis |
| Identification of potential cell-cell interactions between two cell types and their ligand-receptor pairs for different disease states |
| Ligand | Receptor | LRpair | Pathway | Tissue | Disease Stage |
| Page: 1 |
Top |
Single-cell gene regulatory network inference analysis |
| Find out the significant the regulons (TFs) and the target genes of each regulon across cell types for different disease states |
| TF | Cell Type | Tissue | Disease Stage | Target Gene | RSS | Regulon Activity |
| ∗The dot plots of a searched regulon are shown for all cell subpopulations in each disease state of each tissue based on the regulon specific score inferred using pySCENIC and by calculating the average expression. |
| Page: 1 |
Top |
Somatic mutation of malignant transformation related genes |
| Annotation of somatic variants for genes involved in malignant transformation |
| Hugo Symbol | Variant Class | Variant Classification | dbSNP RS | HGVSc | HGVSp | HGVSp Short | SWISSPROT | BIOTYPE | SIFT | PolyPhen | Tumor Sample Barcode | Tissue | Histology | Sex | Age | Stage | Therapy Types | Drugs | Outcome |
| GREM1 | SNV | Missense_Mutation | c.332G>C | p.Arg111Pro | p.R111P | O60565 | protein_coding | deleterious(0) | probably_damaging(0.931) | TCGA-A2-A0YC-01 | Breast | breast invasive carcinoma | Female | <65 | I/II | Hormone Therapy | arimidex | PD | |
| GREM1 | insertion | Frame_Shift_Ins | novel | c.527_528insT | p.Arg177SerfsTer81 | p.R177Sfs*81 | O60565 | protein_coding | TCGA-B6-A0IK-01 | Breast | breast invasive carcinoma | Female | <65 | III/IV | Unknown | Unknown | PD | ||
| GREM1 | insertion | In_Frame_Ins | novel | c.529_530insATAAGCATTCACAGCTCAGGAAGCCTCAGGCTA | p.Arg177delinsHisLysHisSerGlnLeuArgLysProGlnAlaSer | p.R177delinsHKHSQLRKPQAS | O60565 | protein_coding | TCGA-B6-A0IK-01 | Breast | breast invasive carcinoma | Female | <65 | III/IV | Unknown | Unknown | PD | ||
| GREM1 | SNV | Missense_Mutation | novel | c.529N>T | p.Arg177Cys | p.R177C | O60565 | protein_coding | deleterious(0) | probably_damaging(0.991) | TCGA-A6-6141-01 | Colorectum | colon adenocarcinoma | Male | <65 | I/II | Chemotherapy | 5-fu | SD |
| GREM1 | SNV | Missense_Mutation | c.461N>C | p.Val154Ala | p.V154A | O60565 | protein_coding | deleterious(0) | possibly_damaging(0.856) | TCGA-AU-6004-01 | Colorectum | colon adenocarcinoma | Female | >=65 | I/II | Unknown | Unknown | SD | |
| GREM1 | SNV | Missense_Mutation | c.346N>A | p.Arg116Ser | p.R116S | O60565 | protein_coding | deleterious(0.03) | probably_damaging(0.991) | TCGA-AF-3911-01 | Colorectum | rectum adenocarcinoma | Male | <65 | III/IV | Chemotherapy | 5-fu | PD | |
| GREM1 | SNV | Missense_Mutation | rs756849803 | c.347N>A | p.Arg116His | p.R116H | O60565 | protein_coding | deleterious(0.03) | probably_damaging(0.99) | TCGA-AG-A002-01 | Colorectum | rectum adenocarcinoma | Male | <65 | I/II | Unknown | Unknown | SD |
| GREM1 | deletion | Frame_Shift_Del | c.99delN | p.Pro35ArgfsTer49 | p.P35Rfs*49 | O60565 | protein_coding | TCGA-F4-6856-01 | Colorectum | colon adenocarcinoma | Male | <65 | I/II | Ancillary | leucovorin | CR | |||
| GREM1 | SNV | Missense_Mutation | novel | c.135N>T | p.Glu45Asp | p.E45D | O60565 | protein_coding | tolerated(0.29) | benign(0.005) | TCGA-A5-A1OF-01 | Endometrium | uterine corpus endometrioid carcinoma | Female | <65 | I/II | Unknown | Unknown | SD |
| GREM1 | SNV | Missense_Mutation | novel | c.398N>C | p.Lys133Thr | p.K133T | O60565 | protein_coding | tolerated(0.08) | benign(0.076) | TCGA-A5-A1OF-01 | Endometrium | uterine corpus endometrioid carcinoma | Female | <65 | I/II | Unknown | Unknown | SD |
| Page: 1 2 3 |
Top |
Related drugs of malignant transformation related genes |
| Identification of chemicals and drugs interact with genes involved in malignant transfromation |
| (DGIdb 4.0) |
| Entrez ID | Symbol | Category | Interaction Types | Drug Claim Name | Drug Name | PMIDs |
| Page: 1 |

Copyright 2023-Present -The University of Texas Health Science Center at Houston |