
|
|||||
|
 | |
| |
| |
| |
| |
| |
|
Gene: GREB1L |
Gene summary for GREB1L |
| Gene information | Species | Human | Gene symbol | GREB1L | Gene ID | 80000 |
| Gene name | GREB1 like retinoic acid receptor coactivator | |
| Gene Alias | C18orf6 | |
| Cytomap | 18q11.1-q11.2 | |
| Gene Type | protein-coding | GO ID | GO:0000003 | UniProtAcc | Q9C091 |
Top |
Malignant transformation analysis |
| Identification of the aberrant gene expression in precancerous and cancerous lesions by comparing the gene expression of stem-like cells in diseased tissues with normal stem cells |
| Entrez ID | Symbol | Replicates | Species | Organ | Tissue | Adj P-value | Log2FC | Malignancy |
| 80000 | GREB1L | NAFLD1 | Human | Liver | NAFLD | 3.67e-12 | 8.77e-01 | -0.04 |
| 80000 | GREB1L | HCC1_Meng | Human | Liver | HCC | 1.25e-02 | -7.84e-02 | 0.0246 |
| 80000 | GREB1L | HCC2_Meng | Human | Liver | HCC | 2.38e-03 | -3.72e-02 | 0.0107 |
| 80000 | GREB1L | HCC1 | Human | Liver | HCC | 5.63e-13 | 1.32e+00 | 0.5336 |
| 80000 | GREB1L | Pt13.a | Human | Liver | HCC | 4.06e-02 | -8.79e-02 | 0.021 |
| Page: 1 |
| Tissue | Expression Dynamics | Abbreviation |
| Liver | 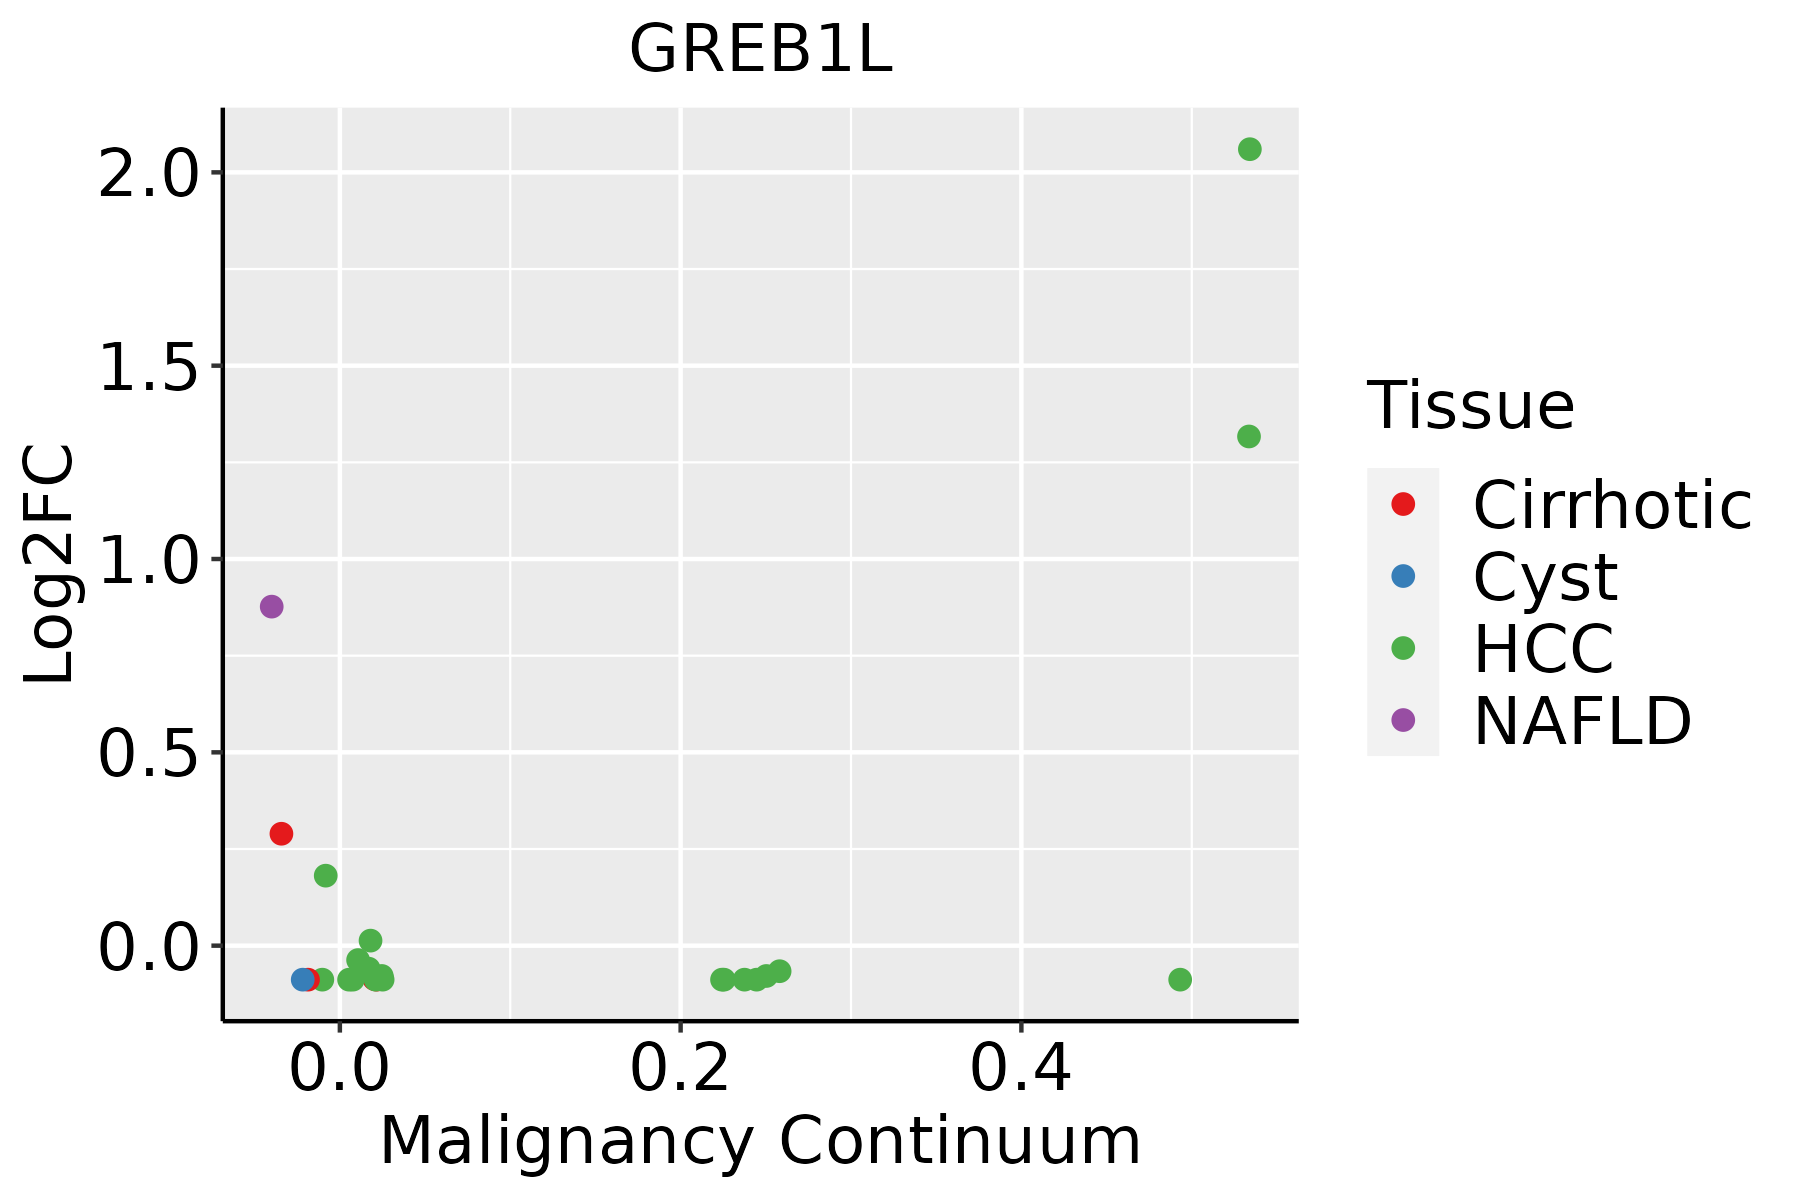 | HCC: Hepatocellular carcinoma |
| NAFLD: Non-alcoholic fatty liver disease |
| ∗log2FC in expression of this searched gene in stem-like cells from each diseased tissue sample relative to stem-like cells in normal samples in each tissue plotted against the malignancy continuum. Samples are colored based on if they are from different disease stage. |
Top |
Malignant transformation related pathway analysis |
| Find out the enriched GO biological processes and KEGG pathways involved in transition from healthy to precancer to cancer |
| Tissue | Disease Stage | Enriched GO biological Processes |
| Colorectum | AD |  |
| Colorectum | SER |  |
| Colorectum | MSS |  |
| Colorectum | MSI-H |  |
| Colorectum | FAP |  |
| ∗Top 15 enriched GO BP terms are showed in the bar plot of each disease state in each tissue. Each row represents a significant GO biological process which is colored according to the -log10(p.adjust). |
| Page: 1 2 3 4 5 6 7 8 9 |
| GO ID | Tissue | Disease Stage | Description | Gene Ratio | Bg Ratio | pvalue | p.adjust | Count |
| GO:00016553 | Liver | HCC | urogenital system development | 170/7958 | 338/18723 | 2.15e-03 | 1.08e-02 | 170 |
| GO:00018222 | Liver | HCC | kidney development | 148/7958 | 293/18723 | 3.25e-03 | 1.49e-02 | 148 |
| GO:00720012 | Liver | HCC | renal system development | 152/7958 | 302/18723 | 3.45e-03 | 1.56e-02 | 152 |
| GO:006145811 | Liver | HCC | reproductive system development | 205/7958 | 427/18723 | 1.16e-02 | 4.27e-02 | 205 |
| Page: 1 |
| Pathway ID | Tissue | Disease Stage | Description | Gene Ratio | Bg Ratio | pvalue | p.adjust | qvalue | Count |
| Page: 1 |
Top |
Cell-cell communication analysis |
| Identification of potential cell-cell interactions between two cell types and their ligand-receptor pairs for different disease states |
| Ligand | Receptor | LRpair | Pathway | Tissue | Disease Stage |
| Page: 1 |
Top |
Single-cell gene regulatory network inference analysis |
| Find out the significant the regulons (TFs) and the target genes of each regulon across cell types for different disease states |
| TF | Cell Type | Tissue | Disease Stage | Target Gene | RSS | Regulon Activity |
| ∗The dot plots of a searched regulon are shown for all cell subpopulations in each disease state of each tissue based on the regulon specific score inferred using pySCENIC and by calculating the average expression. |
| Page: 1 |
Top |
Somatic mutation of malignant transformation related genes |
| Annotation of somatic variants for genes involved in malignant transformation |
| Hugo Symbol | Variant Class | Variant Classification | dbSNP RS | HGVSc | HGVSp | HGVSp Short | SWISSPROT | BIOTYPE | SIFT | PolyPhen | Tumor Sample Barcode | Tissue | Histology | Sex | Age | Stage | Therapy Types | Drugs | Outcome |
| GREB1L | SNV | Missense_Mutation | novel | c.558N>G | p.Cys186Trp | p.C186W | Q9C091 | protein_coding | deleterious(0) | probably_damaging(0.998) | TCGA-A2-A04Q-01 | Breast | breast invasive carcinoma | Female | <65 | I/II | Chemotherapy | adriamycin | SD |
| GREB1L | SNV | Missense_Mutation | novel | c.4623N>G | p.Ile1541Met | p.I1541M | Q9C091 | protein_coding | deleterious(0.01) | benign(0.444) | TCGA-A2-A0CR-01 | Breast | breast invasive carcinoma | Female | <65 | I/II | Chemotherapy | adriamycin | CR |
| GREB1L | SNV | Missense_Mutation | rs766932039 | c.5736N>A | p.Asp1912Glu | p.D1912E | Q9C091 | protein_coding | tolerated(0.05) | probably_damaging(0.996) | TCGA-A2-A0CS-01 | Breast | breast invasive carcinoma | Female | >=65 | III/IV | Hormone Therapy | anastrozole | SD |
| GREB1L | SNV | Missense_Mutation | c.5303N>A | p.Leu1768His | p.L1768H | Q9C091 | protein_coding | tolerated(0.53) | possibly_damaging(0.794) | TCGA-A2-A0ET-01 | Breast | breast invasive carcinoma | Female | <65 | III/IV | Chemotherapy | cytoxan | SD | |
| GREB1L | SNV | Missense_Mutation | novel | c.558N>G | p.Cys186Trp | p.C186W | Q9C091 | protein_coding | deleterious(0) | probably_damaging(0.998) | TCGA-A2-A0T2-01 | Breast | breast invasive carcinoma | Female | >=65 | III/IV | Chemotherapy | xeloda | PD |
| GREB1L | SNV | Missense_Mutation | c.1468G>A | p.Glu490Lys | p.E490K | Q9C091 | protein_coding | deleterious(0) | benign(0.217) | TCGA-A2-A0YK-01 | Breast | breast invasive carcinoma | Female | <65 | I/II | Chemotherapy | cytoxan | SD | |
| GREB1L | SNV | Missense_Mutation | c.630G>C | p.Lys210Asn | p.K210N | Q9C091 | protein_coding | deleterious(0) | probably_damaging(0.997) | TCGA-AC-A23H-01 | Breast | breast invasive carcinoma | Female | >=65 | I/II | Unknown | Unknown | PD | |
| GREB1L | SNV | Missense_Mutation | novel | c.5162N>T | p.Arg1721Ile | p.R1721I | Q9C091 | protein_coding | deleterious(0) | probably_damaging(0.997) | TCGA-AN-A046-01 | Breast | breast invasive carcinoma | Female | >=65 | I/II | Unknown | Unknown | SD |
| GREB1L | SNV | Missense_Mutation | novel | c.2079N>G | p.Ser693Arg | p.S693R | Q9C091 | protein_coding | deleterious(0) | benign(0.232) | TCGA-AN-A04A-01 | Breast | breast invasive carcinoma | Female | <65 | III/IV | Unknown | Unknown | SD |
| GREB1L | SNV | Missense_Mutation | c.5665N>T | p.Arg1889Cys | p.R1889C | Q9C091 | protein_coding | deleterious(0) | probably_damaging(0.998) | TCGA-AR-A1AQ-01 | Breast | breast invasive carcinoma | Female | <65 | I/II | Chemotherapy | doxorubicin | SD |
| Page: 1 2 3 4 5 6 7 8 9 10 11 12 13 14 |
Top |
Related drugs of malignant transformation related genes |
| Identification of chemicals and drugs interact with genes involved in malignant transfromation |
| (DGIdb 4.0) |
| Entrez ID | Symbol | Category | Interaction Types | Drug Claim Name | Drug Name | PMIDs |
| Page: 1 |

Copyright 2023-Present -The University of Texas Health Science Center at Houston |