
|
|||||
|
 | |
| |
| |
| |
| |
| |
|
Gene: GREB1 |
Gene summary for GREB1 |
| Gene information | Species | Human | Gene symbol | GREB1 | Gene ID | 9687 |
| Gene name | growth regulating estrogen receptor binding 1 | |
| Gene Alias | GREB1 | |
| Cytomap | 2p25.1 | |
| Gene Type | protein-coding | GO ID | GO:0007275 | UniProtAcc | Q4ZG55 |
Top |
Malignant transformation analysis |
| Identification of the aberrant gene expression in precancerous and cancerous lesions by comparing the gene expression of stem-like cells in diseased tissues with normal stem cells |
| Entrez ID | Symbol | Replicates | Species | Organ | Tissue | Adj P-value | Log2FC | Malignancy |
| 9687 | GREB1 | AEH-subject2 | Human | Endometrium | AEH | 1.39e-02 | -1.43e-01 | -0.2525 |
| 9687 | GREB1 | AEH-subject3 | Human | Endometrium | AEH | 1.10e-03 | 1.87e-01 | -0.2576 |
| 9687 | GREB1 | AEH-subject5 | Human | Endometrium | AEH | 2.67e-25 | 6.79e-01 | -0.2953 |
| 9687 | GREB1 | EEC-subject1 | Human | Endometrium | EEC | 2.31e-04 | 1.70e-01 | -0.2682 |
| 9687 | GREB1 | EEC-subject3 | Human | Endometrium | EEC | 2.84e-03 | -9.50e-03 | -0.2525 |
| 9687 | GREB1 | GSM5276934 | Human | Endometrium | EEC | 1.64e-04 | -2.03e-01 | -0.0913 |
| 9687 | GREB1 | GSM6177620_NYU_UCEC1_lib1_lib1 | Human | Endometrium | EEC | 1.15e-12 | -2.44e-01 | -0.1869 |
| 9687 | GREB1 | GSM6177620_NYU_UCEC1_lib2_lib2 | Human | Endometrium | EEC | 8.96e-08 | -2.83e-01 | -0.1875 |
| 9687 | GREB1 | GSM6177620_NYU_UCEC1_lib3_lib3 | Human | Endometrium | EEC | 5.39e-11 | -2.37e-01 | -0.1883 |
| 9687 | GREB1 | GSM6177621_NYU_UCEC2_lib1_lib1 | Human | Endometrium | EEC | 7.35e-09 | -3.29e-03 | -0.1934 |
| 9687 | GREB1 | GSM6177622_NYU_UCEC3_lib1_lib1 | Human | Endometrium | EEC | 1.00e-13 | -2.08e-01 | -0.1917 |
| 9687 | GREB1 | GSM6177622_NYU_UCEC3_lib2_lib2 | Human | Endometrium | EEC | 4.99e-12 | -2.61e-01 | -0.1916 |
| 9687 | GREB1 | HCC1_Meng | Human | Liver | HCC | 2.67e-23 | 4.76e-02 | 0.0246 |
| 9687 | GREB1 | HCC1 | Human | Liver | HCC | 8.64e-03 | 2.13e+00 | 0.5336 |
| 9687 | GREB1 | HCC2 | Human | Liver | HCC | 2.18e-03 | 4.28e-01 | 0.5341 |
| 9687 | GREB1 | HCC5 | Human | Liver | HCC | 9.03e-06 | 1.25e+00 | 0.4932 |
| 9687 | GREB1 | S014 | Human | Liver | HCC | 4.16e-16 | 6.18e-01 | 0.2254 |
| 9687 | GREB1 | S015 | Human | Liver | HCC | 8.63e-27 | 1.06e+00 | 0.2375 |
| 9687 | GREB1 | S016 | Human | Liver | HCC | 3.38e-23 | 6.96e-01 | 0.2243 |
| 9687 | GREB1 | HTA12-23-1 | Human | Pancreas | PDAC | 4.03e-05 | 7.35e-01 | 0.3405 |
| Page: 1 2 |
| Tissue | Expression Dynamics | Abbreviation |
| Endometrium | 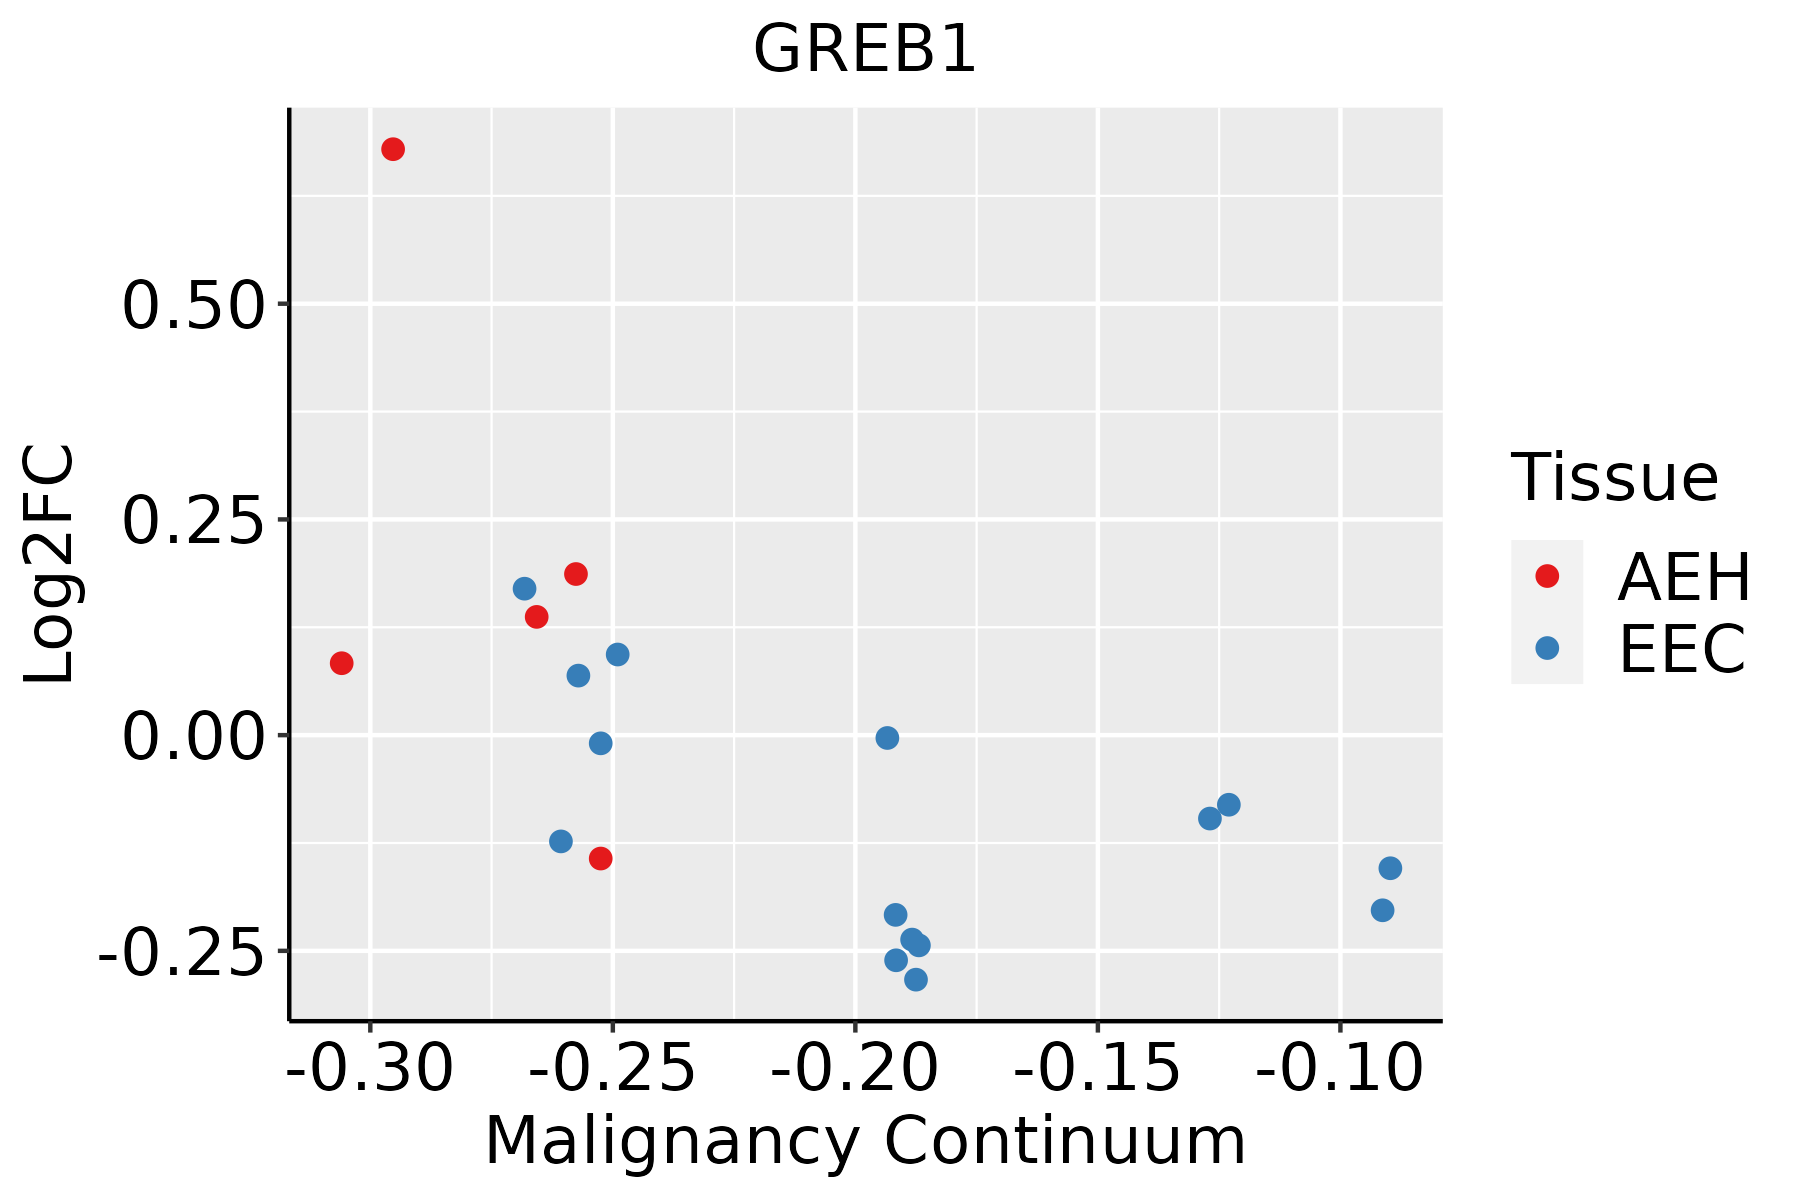 | AEH: Atypical endometrial hyperplasia |
| EEC: Endometrioid Cancer | ||
| Liver | 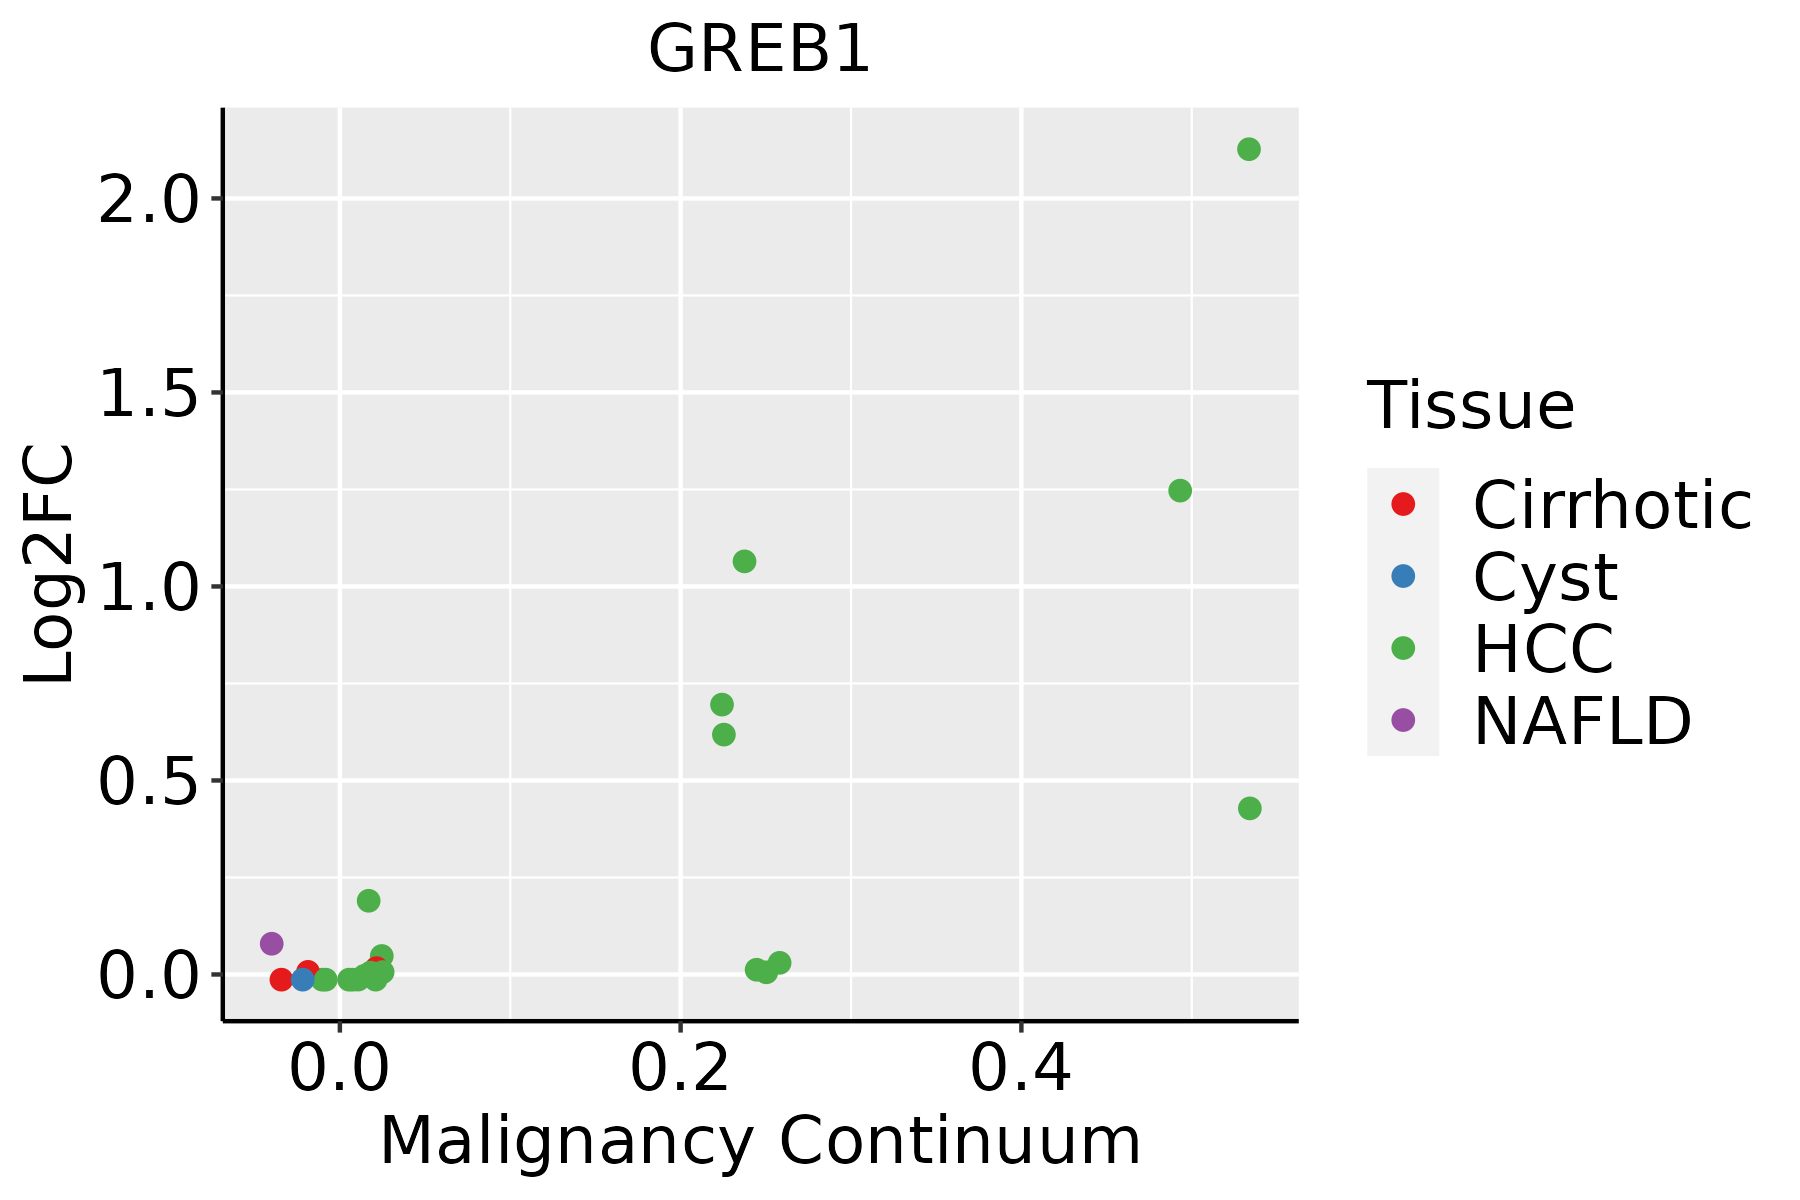 | HCC: Hepatocellular carcinoma |
| NAFLD: Non-alcoholic fatty liver disease |
| ∗log2FC in expression of this searched gene in stem-like cells from each diseased tissue sample relative to stem-like cells in normal samples in each tissue plotted against the malignancy continuum. Samples are colored based on if they are from different disease stage. |
Top |
Malignant transformation related pathway analysis |
| Find out the enriched GO biological processes and KEGG pathways involved in transition from healthy to precancer to cancer |
| Tissue | Disease Stage | Enriched GO biological Processes |
| Colorectum | AD |  |
| Colorectum | SER |  |
| Colorectum | MSS |  |
| Colorectum | MSI-H |  |
| Colorectum | FAP |  |
| ∗Top 15 enriched GO BP terms are showed in the bar plot of each disease state in each tissue. Each row represents a significant GO biological process which is colored according to the -log10(p.adjust). |
| Page: 1 2 3 4 5 6 7 8 9 |
| GO ID | Tissue | Disease Stage | Description | Gene Ratio | Bg Ratio | pvalue | p.adjust | Count |
| GO:00016553 | Liver | HCC | urogenital system development | 170/7958 | 338/18723 | 2.15e-03 | 1.08e-02 | 170 |
| GO:00018222 | Liver | HCC | kidney development | 148/7958 | 293/18723 | 3.25e-03 | 1.49e-02 | 148 |
| GO:00720012 | Liver | HCC | renal system development | 152/7958 | 302/18723 | 3.45e-03 | 1.56e-02 | 152 |
| GO:006145811 | Liver | HCC | reproductive system development | 205/7958 | 427/18723 | 1.16e-02 | 4.27e-02 | 205 |
| Page: 1 |
| Pathway ID | Tissue | Disease Stage | Description | Gene Ratio | Bg Ratio | pvalue | p.adjust | qvalue | Count |
| Page: 1 |
Top |
Cell-cell communication analysis |
| Identification of potential cell-cell interactions between two cell types and their ligand-receptor pairs for different disease states |
| Ligand | Receptor | LRpair | Pathway | Tissue | Disease Stage |
| Page: 1 |
Top |
Single-cell gene regulatory network inference analysis |
| Find out the significant the regulons (TFs) and the target genes of each regulon across cell types for different disease states |
| TF | Cell Type | Tissue | Disease Stage | Target Gene | RSS | Regulon Activity |
| ∗The dot plots of a searched regulon are shown for all cell subpopulations in each disease state of each tissue based on the regulon specific score inferred using pySCENIC and by calculating the average expression. |
| Page: 1 |
Top |
Somatic mutation of malignant transformation related genes |
| Annotation of somatic variants for genes involved in malignant transformation |
| Hugo Symbol | Variant Class | Variant Classification | dbSNP RS | HGVSc | HGVSp | HGVSp Short | SWISSPROT | BIOTYPE | SIFT | PolyPhen | Tumor Sample Barcode | Tissue | Histology | Sex | Age | Stage | Therapy Types | Drugs | Outcome |
| GREB1 | SNV | Missense_Mutation | novel | c.869N>C | p.Asn290Thr | p.N290T | Q4ZG55 | protein_coding | tolerated(0.18) | benign(0.003) | TCGA-A2-A0CS-01 | Breast | breast invasive carcinoma | Female | >=65 | III/IV | Hormone Therapy | anastrozole | SD |
| GREB1 | SNV | Missense_Mutation | c.4966N>A | p.Val1656Ile | p.V1656I | Q4ZG55 | protein_coding | tolerated(0.11) | benign(0.007) | TCGA-A2-A0D0-01 | Breast | breast invasive carcinoma | Female | <65 | I/II | Chemotherapy | cytoxan | SD | |
| GREB1 | SNV | Missense_Mutation | rs775859147 | c.3590N>T | p.Thr1197Met | p.T1197M | Q4ZG55 | protein_coding | deleterious(0.04) | benign(0.131) | TCGA-AC-A3EH-01 | Breast | breast invasive carcinoma | Female | >=65 | III/IV | Unknown | Unknown | SD |
| GREB1 | SNV | Missense_Mutation | novel | c.5318G>T | p.Gly1773Val | p.G1773V | Q4ZG55 | protein_coding | deleterious(0) | probably_damaging(0.927) | TCGA-D8-A1JG-01 | Breast | breast invasive carcinoma | Female | <65 | I/II | Chemotherapy | doxorubicin | SD |
| GREB1 | SNV | Missense_Mutation | c.1202N>G | p.Val401Gly | p.V401G | Q4ZG55 | protein_coding | deleterious(0) | possibly_damaging(0.76) | TCGA-D8-A1XQ-01 | Breast | breast invasive carcinoma | Female | >=65 | I/II | Unknown | Unknown | SD | |
| GREB1 | SNV | Missense_Mutation | c.237C>A | p.Phe79Leu | p.F79L | Q4ZG55 | protein_coding | deleterious(0) | benign(0.013) | TCGA-E2-A159-01 | Breast | breast invasive carcinoma | Female | <65 | I/II | Chemotherapy | cyclophosphamide | SD | |
| GREB1 | SNV | Missense_Mutation | novel | c.5318G>T | p.Gly1773Val | p.G1773V | Q4ZG55 | protein_coding | deleterious(0) | probably_damaging(0.927) | TCGA-E9-A295-01 | Breast | breast invasive carcinoma | Female | >=65 | I/II | Hormone Therapy | tamoxiphen | SD |
| GREB1 | SNV | Missense_Mutation | rs770801145 | c.2146C>T | p.His716Tyr | p.H716Y | Q4ZG55 | protein_coding | deleterious(0) | benign(0.341) | TCGA-GI-A2C8-01 | Breast | breast invasive carcinoma | Female | <65 | III/IV | Unspecific | Adriamycin | SD |
| GREB1 | insertion | Nonsense_Mutation | novel | c.2504_2505insGTAAGGAGATAAGTACACAATCAGATGGGG | p.Ile835delinsMetTerGlyAspLysTyrThrIleArgTrpGly | p.I835delinsM*GDKYTIRWG | Q4ZG55 | protein_coding | TCGA-AN-A0FK-01 | Breast | breast invasive carcinoma | Female | >=65 | III/IV | Unknown | Unknown | SD | ||
| GREB1 | insertion | Nonsense_Mutation | novel | c.109_110insGGAGGTGCCCAGAGAATAACGTATAGCCTTAAATGTCTTCG | p.Phe37TrpfsTer9 | p.F37Wfs*9 | Q4ZG55 | protein_coding | TCGA-AR-A0TY-01 | Breast | breast invasive carcinoma | Female | <65 | I/II | Unspecific | Paclitaxel | PD |
| Page: 1 2 3 4 5 6 7 8 9 10 11 12 13 14 15 16 17 18 19 20 21 22 23 |
Top |
Related drugs of malignant transformation related genes |
| Identification of chemicals and drugs interact with genes involved in malignant transfromation |
| (DGIdb 4.0) |
| Entrez ID | Symbol | Category | Interaction Types | Drug Claim Name | Drug Name | PMIDs |
| Page: 1 |

Copyright 2023-Present -The University of Texas Health Science Center at Houston |