
|
|||||
|
 | |
| |
| |
| |
| |
| |
|
Gene: GRB2 |
Gene summary for GRB2 |
| Gene information | Species | Human | Gene symbol | GRB2 | Gene ID | 2885 |
| Gene name | growth factor receptor bound protein 2 | |
| Gene Alias | ASH | |
| Cytomap | 17q25.1 | |
| Gene Type | protein-coding | GO ID | GO:0000003 | UniProtAcc | B0LPF3 |
Top |
Malignant transformation analysis |
| Identification of the aberrant gene expression in precancerous and cancerous lesions by comparing the gene expression of stem-like cells in diseased tissues with normal stem cells |
| Entrez ID | Symbol | Replicates | Species | Organ | Tissue | Adj P-value | Log2FC | Malignancy |
| 2885 | GRB2 | GSM4909293 | Human | Breast | IDC | 1.90e-16 | 4.87e-01 | 0.1581 |
| 2885 | GRB2 | GSM4909296 | Human | Breast | IDC | 8.66e-06 | -1.28e-01 | 0.1524 |
| 2885 | GRB2 | GSM4909297 | Human | Breast | IDC | 4.33e-05 | 7.64e-02 | 0.1517 |
| 2885 | GRB2 | GSM4909309 | Human | Breast | IDC | 4.16e-03 | -7.94e-02 | 0.0483 |
| 2885 | GRB2 | GSM4909311 | Human | Breast | IDC | 8.04e-13 | -1.27e-01 | 0.1534 |
| 2885 | GRB2 | GSM4909312 | Human | Breast | IDC | 5.03e-03 | 3.02e-02 | 0.1552 |
| 2885 | GRB2 | GSM4909313 | Human | Breast | IDC | 2.86e-03 | -4.66e-02 | 0.0391 |
| 2885 | GRB2 | GSM4909319 | Human | Breast | IDC | 4.37e-23 | -2.56e-02 | 0.1563 |
| 2885 | GRB2 | GSM4909321 | Human | Breast | IDC | 4.93e-03 | -1.04e-02 | 0.1559 |
| 2885 | GRB2 | NCCBC14 | Human | Breast | DCIS | 1.35e-10 | 3.74e-01 | 0.2021 |
| 2885 | GRB2 | NCCBC2 | Human | Breast | DCIS | 6.75e-07 | 9.97e-02 | 0.1554 |
| 2885 | GRB2 | NCCBC5 | Human | Breast | DCIS | 2.97e-10 | 2.18e-01 | 0.2046 |
| 2885 | GRB2 | P1 | Human | Breast | IDC | 1.76e-06 | -4.22e-02 | 0.1527 |
| 2885 | GRB2 | DCIS2 | Human | Breast | DCIS | 2.28e-39 | 1.38e-01 | 0.0085 |
| 2885 | GRB2 | LZE2T | Human | Esophagus | ESCC | 1.21e-03 | 5.66e-01 | 0.082 |
| 2885 | GRB2 | LZE4T | Human | Esophagus | ESCC | 1.30e-25 | 7.82e-01 | 0.0811 |
| 2885 | GRB2 | LZE7T | Human | Esophagus | ESCC | 2.26e-07 | 6.22e-01 | 0.0667 |
| 2885 | GRB2 | LZE8T | Human | Esophagus | ESCC | 8.60e-04 | 5.33e-02 | 0.067 |
| 2885 | GRB2 | LZE20T | Human | Esophagus | ESCC | 4.74e-02 | 2.88e-01 | 0.0662 |
| 2885 | GRB2 | LZE22D1 | Human | Esophagus | HGIN | 1.24e-03 | 7.96e-02 | 0.0595 |
| Page: 1 2 3 4 5 6 7 8 |
| Tissue | Expression Dynamics | Abbreviation |
| Breast | 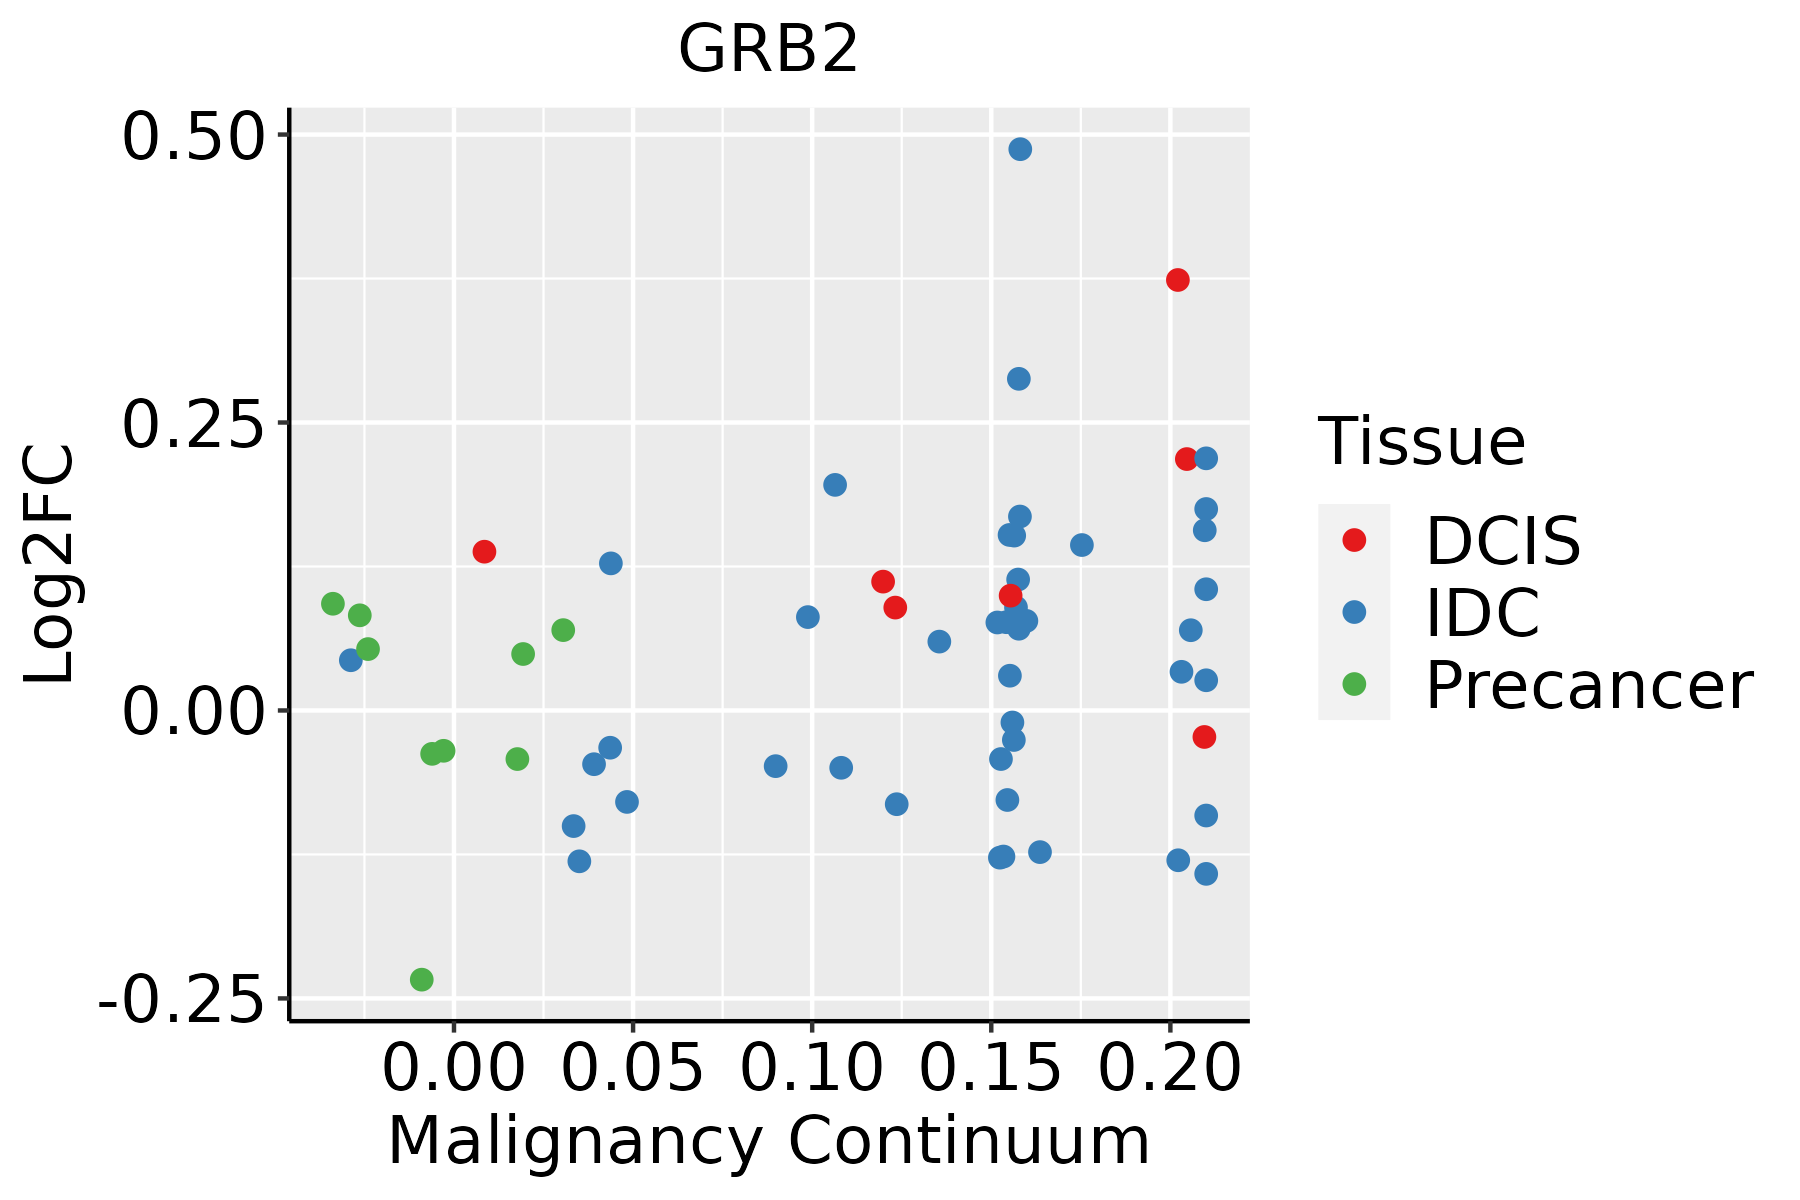 | IDC: Invasive ductal carcinoma |
| DCIS: Ductal carcinoma in situ | ||
| Precancer(BRCA1-mut): Precancerous lesion from BRCA1 mutation carriers | ||
| Esophagus | 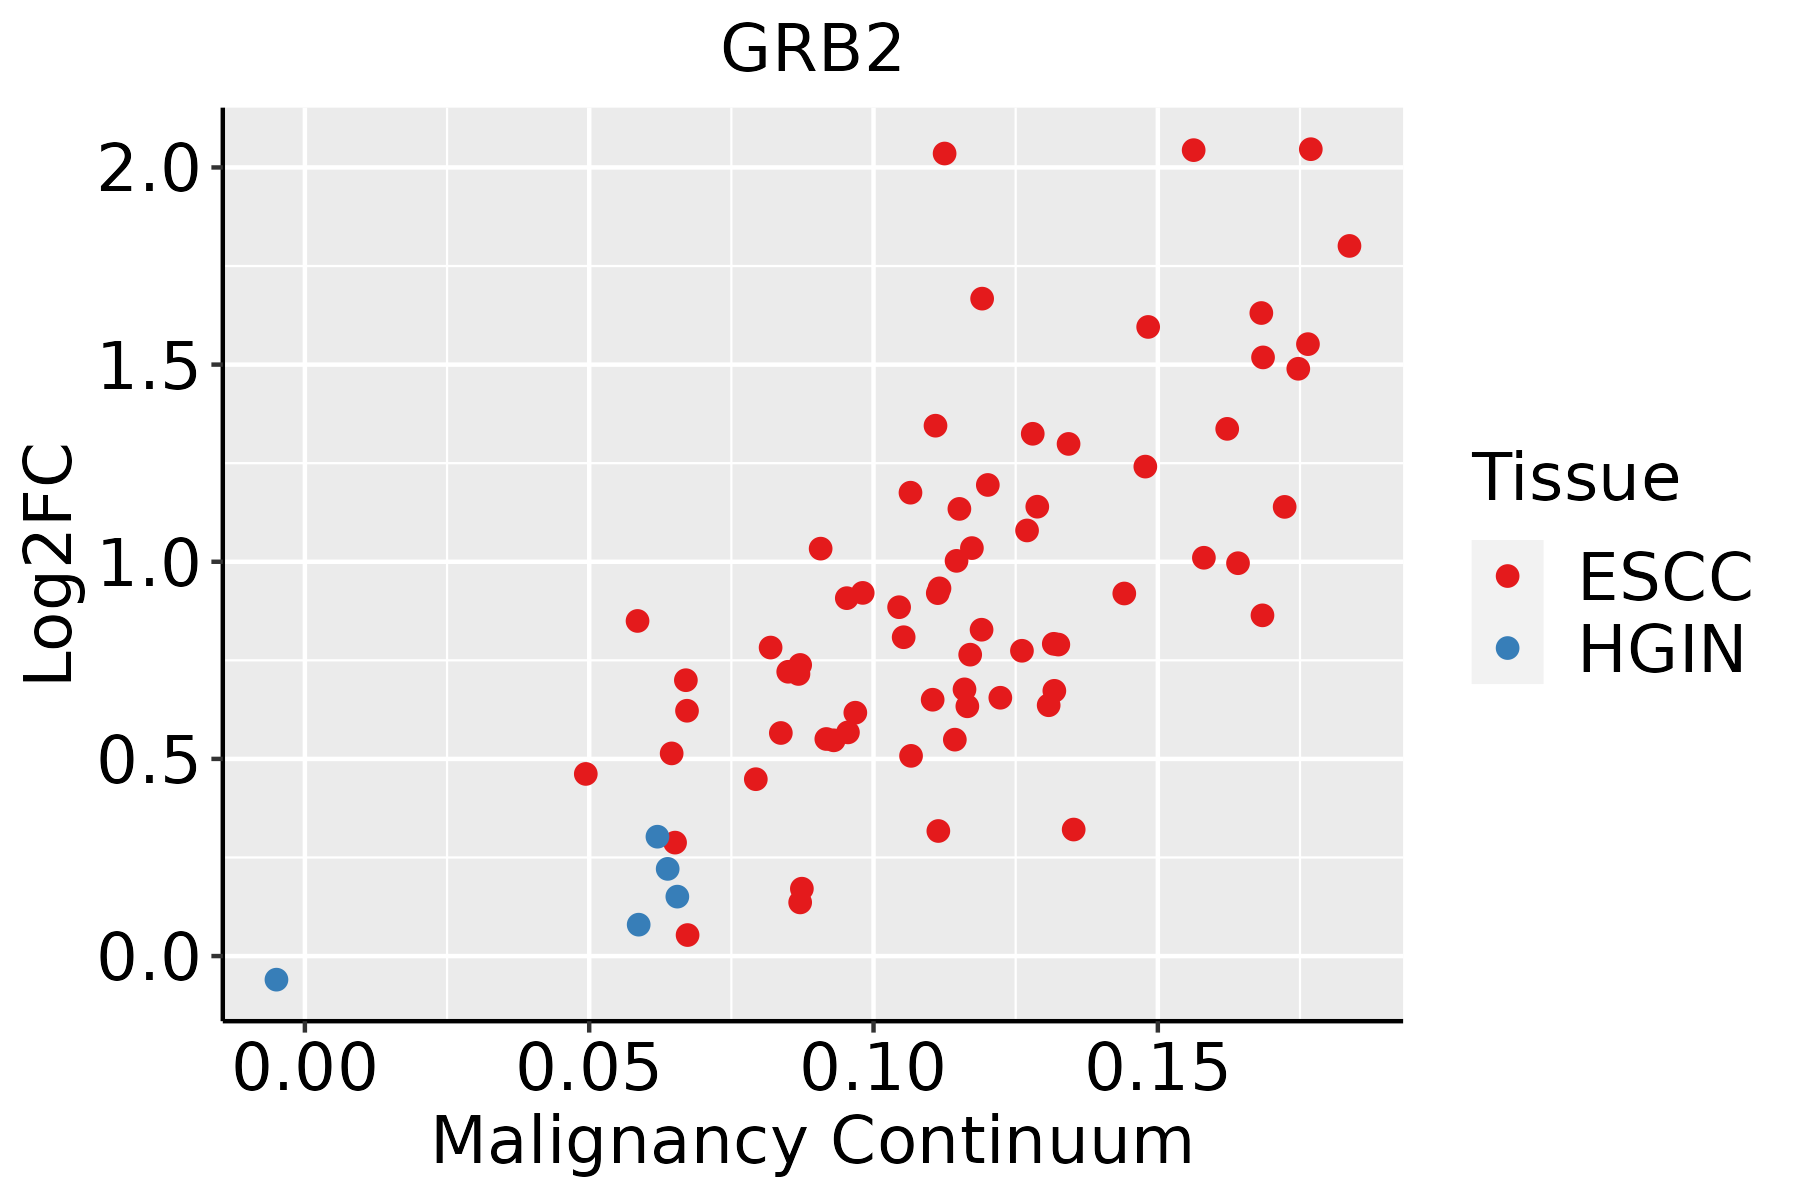 | ESCC: Esophageal squamous cell carcinoma |
| HGIN: High-grade intraepithelial neoplasias | ||
| LGIN: Low-grade intraepithelial neoplasias | ||
| Liver | 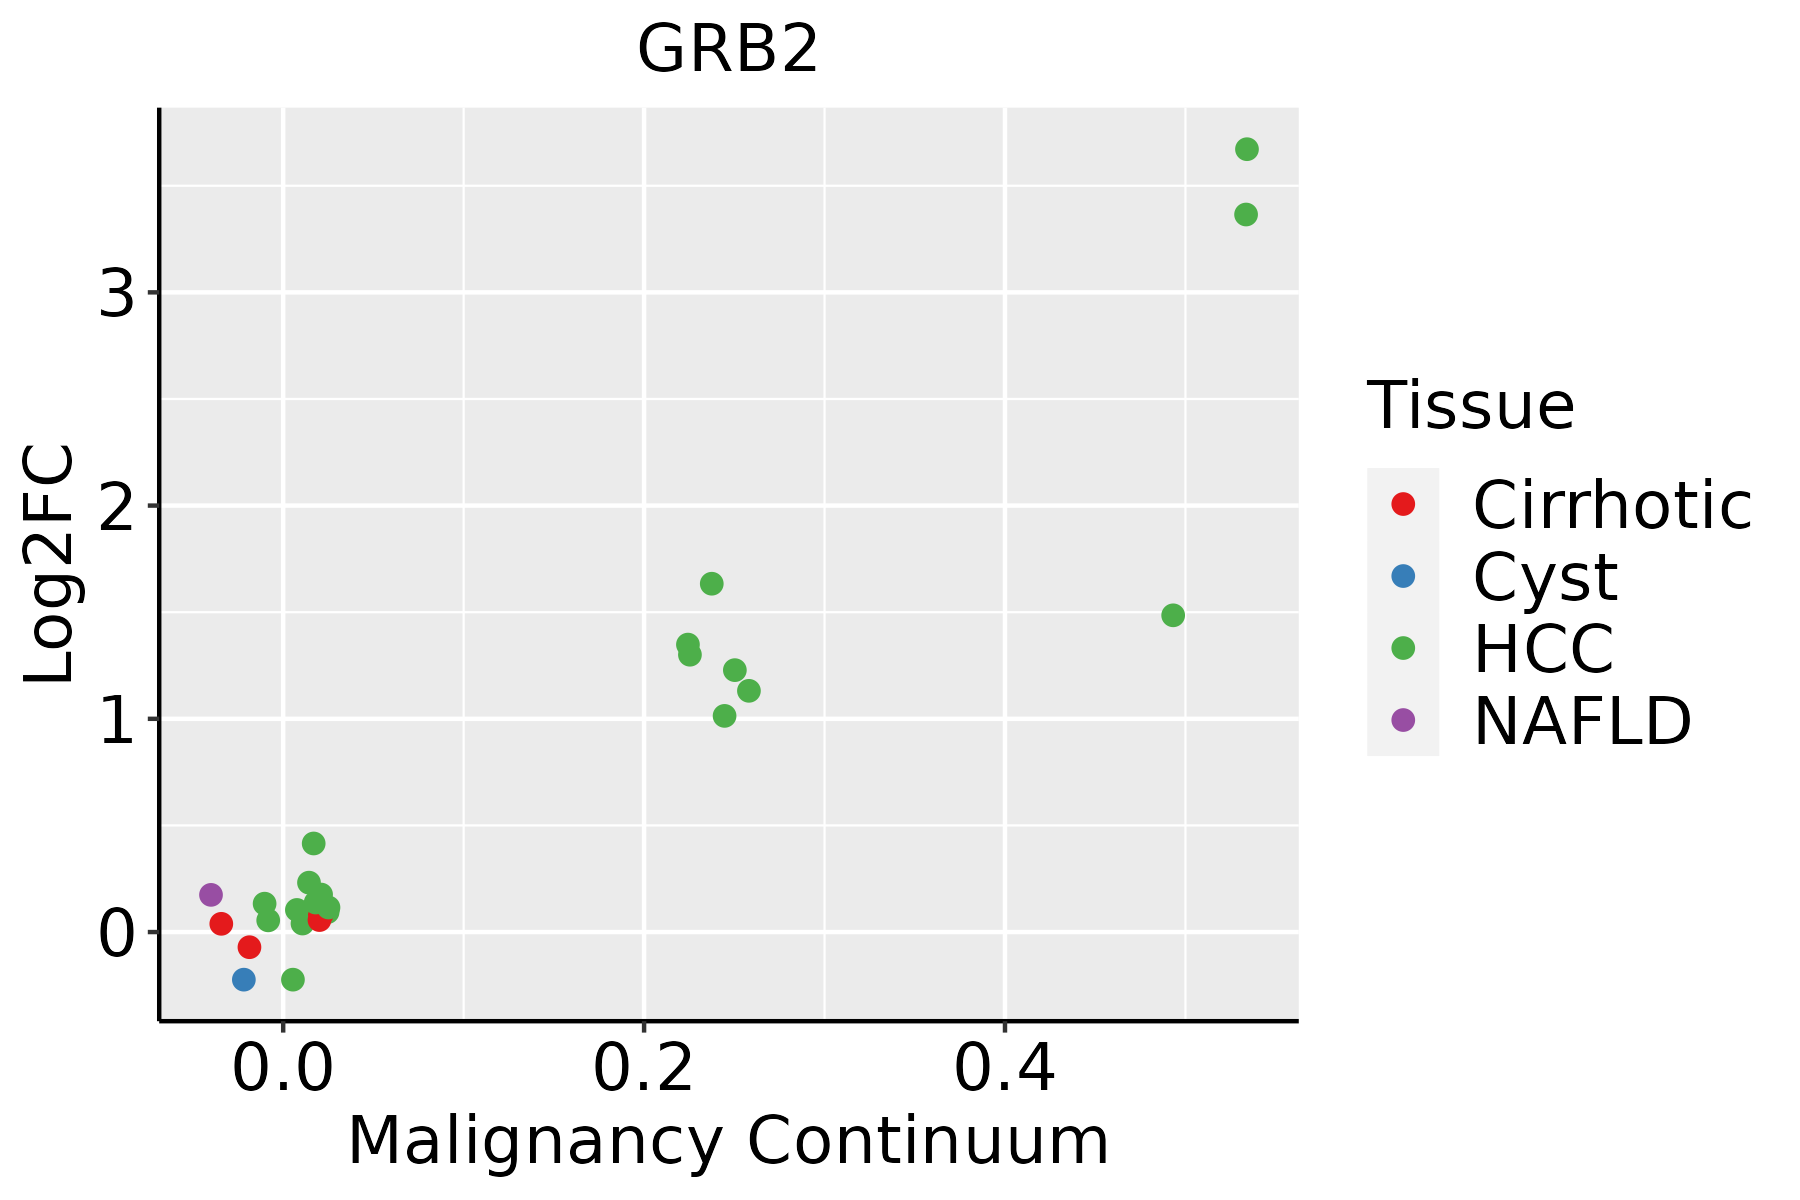 | HCC: Hepatocellular carcinoma |
| NAFLD: Non-alcoholic fatty liver disease | ||
| Oral Cavity |  | EOLP: Erosive Oral lichen planus |
| LP: leukoplakia | ||
| NEOLP: Non-erosive oral lichen planus | ||
| OSCC: Oral squamous cell carcinoma | ||
| Prostate | 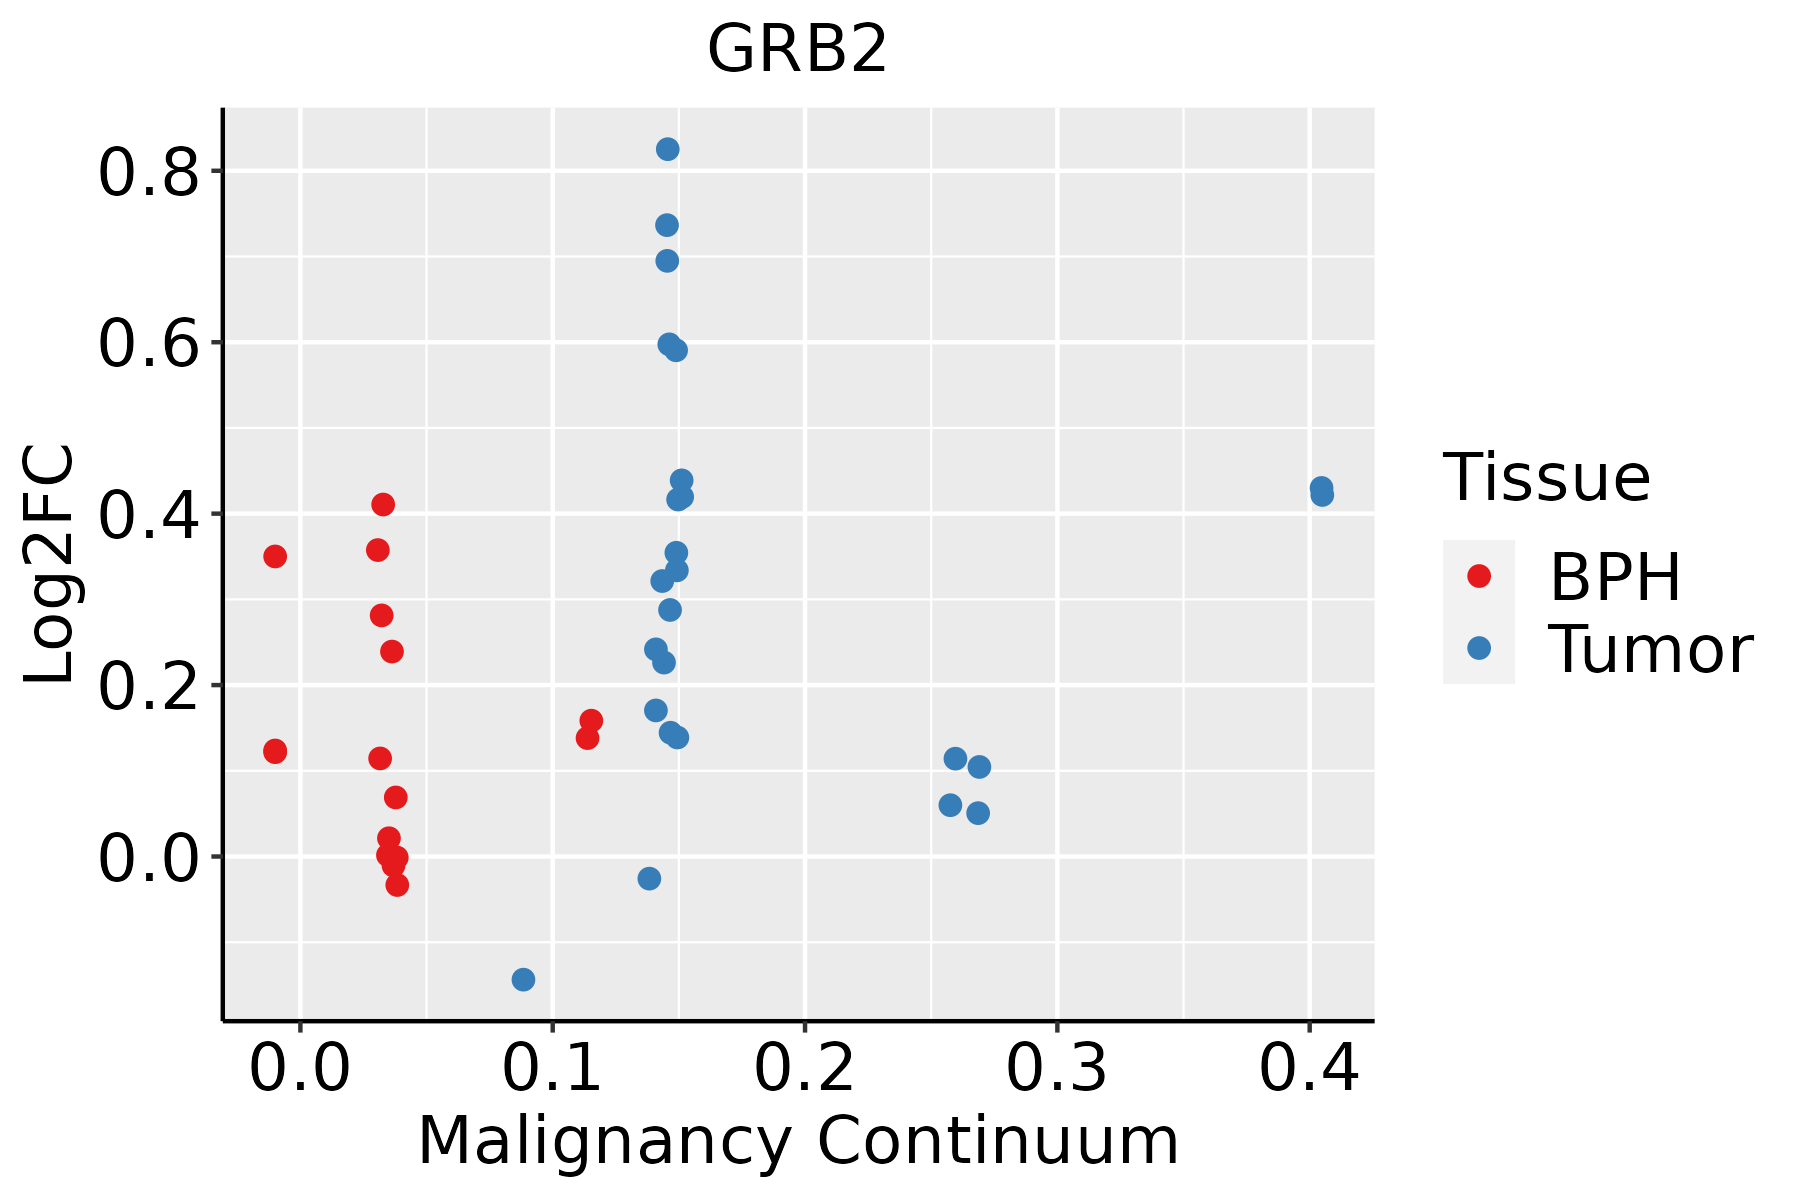 | BPH: Benign Prostatic Hyperplasia |
| Skin |  | AK: Actinic keratosis |
| cSCC: Cutaneous squamous cell carcinoma | ||
| SCCIS:squamous cell carcinoma in situ | ||
| Thyroid | 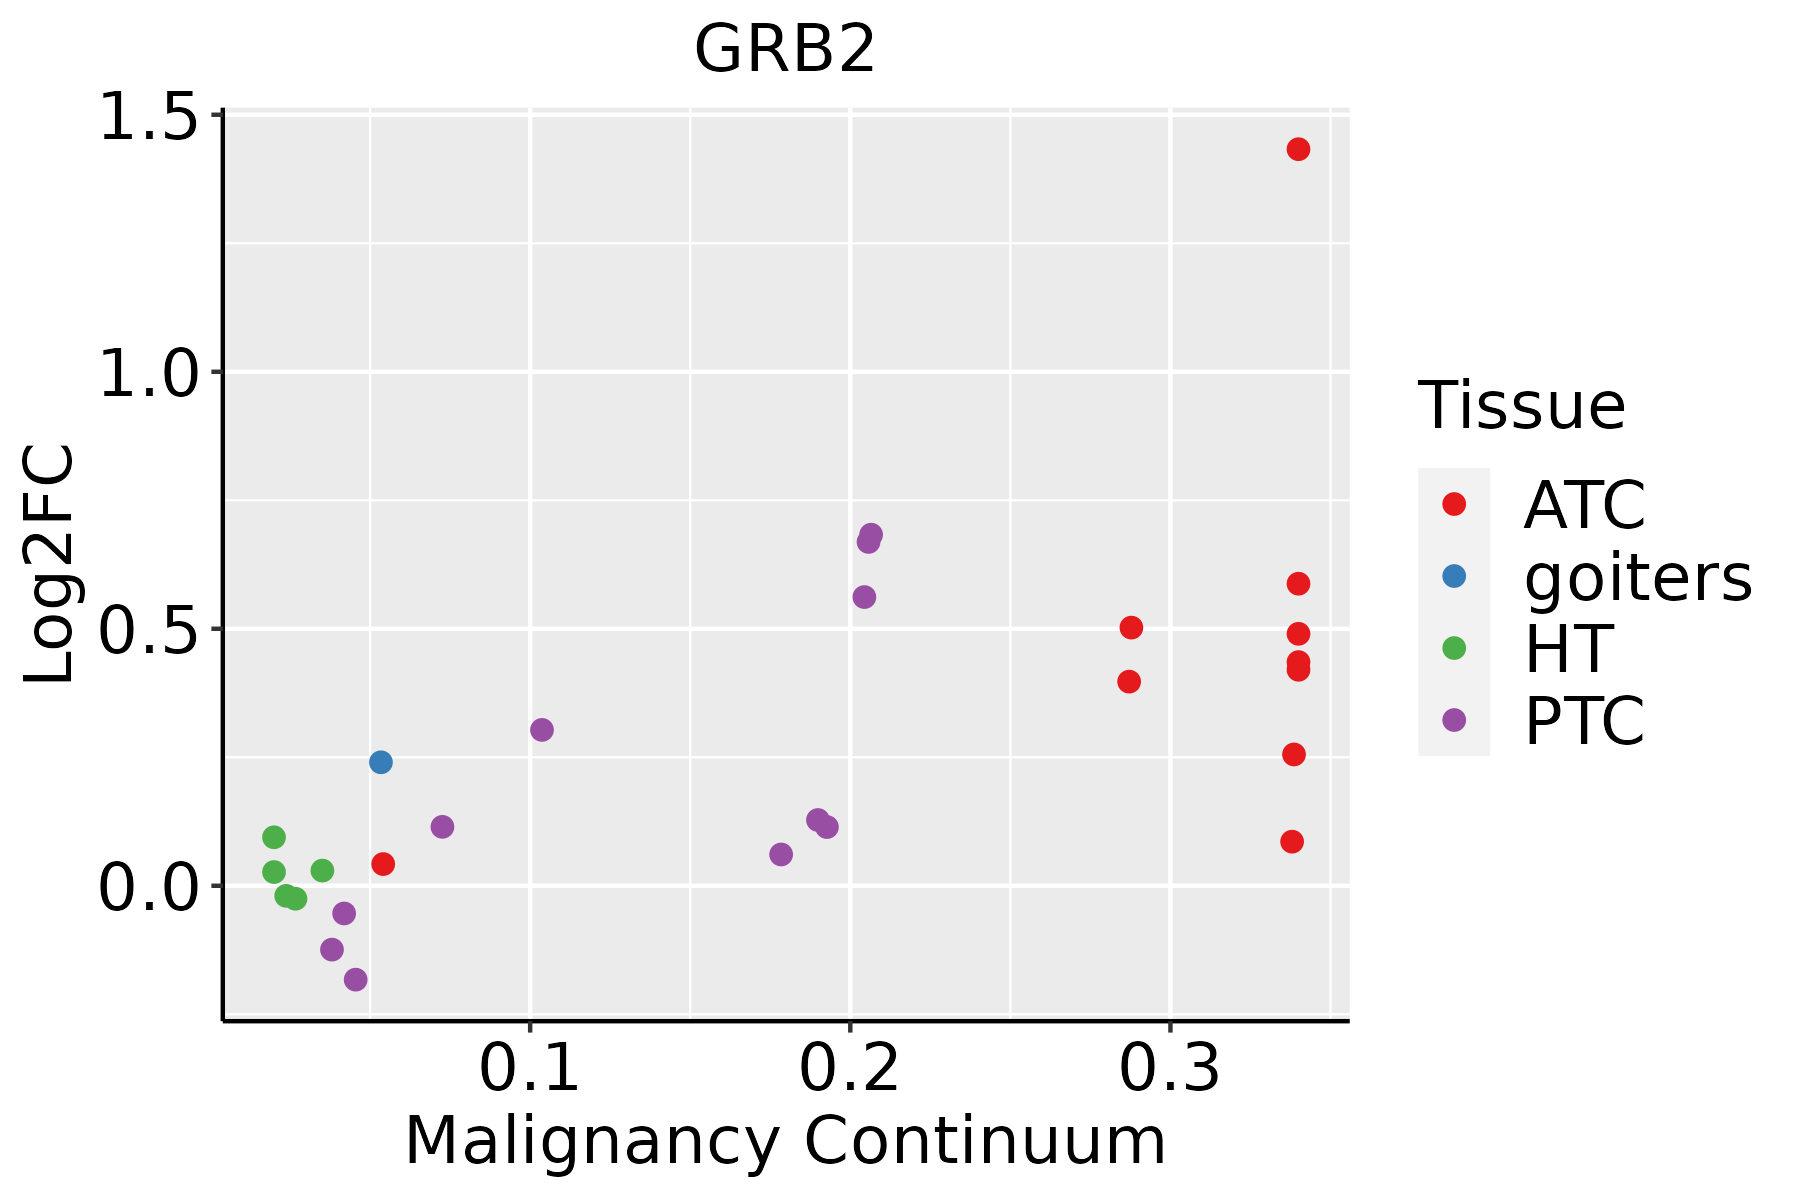 | ATC: Anaplastic thyroid cancer |
| HT: Hashimoto's thyroiditis | ||
| PTC: Papillary thyroid cancer |
| ∗log2FC in expression of this searched gene in stem-like cells from each diseased tissue sample relative to stem-like cells in normal samples in each tissue plotted against the malignancy continuum. Samples are colored based on if they are from different disease stage. |
Top |
Malignant transformation related pathway analysis |
| Find out the enriched GO biological processes and KEGG pathways involved in transition from healthy to precancer to cancer |
| Tissue | Disease Stage | Enriched GO biological Processes |
| Colorectum | AD |  |
| Colorectum | SER |  |
| Colorectum | MSS |  |
| Colorectum | MSI-H |  |
| Colorectum | FAP |  |
| ∗Top 15 enriched GO BP terms are showed in the bar plot of each disease state in each tissue. Each row represents a significant GO biological process which is colored according to the -log10(p.adjust). |
| Page: 1 2 3 4 5 6 7 8 9 |
| GO ID | Tissue | Disease Stage | Description | Gene Ratio | Bg Ratio | pvalue | p.adjust | Count |
| GO:000756813 | Breast | IDC | aging | 52/1434 | 339/18723 | 1.14e-06 | 5.10e-05 | 52 |
| GO:190290514 | Breast | IDC | positive regulation of supramolecular fiber organization | 37/1434 | 209/18723 | 1.33e-06 | 5.75e-05 | 37 |
| GO:004325414 | Breast | IDC | regulation of protein-containing complex assembly | 61/1434 | 428/18723 | 1.77e-06 | 7.31e-05 | 61 |
| GO:003133414 | Breast | IDC | positive regulation of protein-containing complex assembly | 40/1434 | 237/18723 | 1.77e-06 | 7.31e-05 | 40 |
| GO:004860812 | Breast | IDC | reproductive structure development | 60/1434 | 424/18723 | 2.71e-06 | 1.03e-04 | 60 |
| GO:006145813 | Breast | IDC | reproductive system development | 60/1434 | 427/18723 | 3.41e-06 | 1.24e-04 | 60 |
| GO:007147913 | Breast | IDC | cellular response to ionizing radiation | 18/1434 | 72/18723 | 5.67e-06 | 1.85e-04 | 18 |
| GO:003297014 | Breast | IDC | regulation of actin filament-based process | 56/1434 | 397/18723 | 6.37e-06 | 1.99e-04 | 56 |
| GO:001021213 | Breast | IDC | response to ionizing radiation | 28/1434 | 148/18723 | 6.85e-06 | 2.09e-04 | 28 |
| GO:000931412 | Breast | IDC | response to radiation | 62/1434 | 456/18723 | 6.91e-06 | 2.10e-04 | 62 |
| GO:190290314 | Breast | IDC | regulation of supramolecular fiber organization | 54/1434 | 383/18723 | 9.40e-06 | 2.66e-04 | 54 |
| GO:007121413 | Breast | IDC | cellular response to abiotic stimulus | 48/1434 | 331/18723 | 1.37e-05 | 3.53e-04 | 48 |
| GO:010400413 | Breast | IDC | cellular response to environmental stimulus | 48/1434 | 331/18723 | 1.37e-05 | 3.53e-04 | 48 |
| GO:003227314 | Breast | IDC | positive regulation of protein polymerization | 25/1434 | 138/18723 | 4.46e-05 | 1.01e-03 | 25 |
| GO:005149513 | Breast | IDC | positive regulation of cytoskeleton organization | 35/1434 | 226/18723 | 5.04e-05 | 1.09e-03 | 35 |
| GO:007259313 | Breast | IDC | reactive oxygen species metabolic process | 36/1434 | 239/18723 | 7.16e-05 | 1.43e-03 | 36 |
| GO:00434348 | Breast | IDC | response to peptide hormone | 54/1434 | 414/18723 | 8.25e-05 | 1.61e-03 | 54 |
| GO:000189013 | Breast | IDC | placenta development | 25/1434 | 144/18723 | 9.19e-05 | 1.78e-03 | 25 |
| GO:003295614 | Breast | IDC | regulation of actin cytoskeleton organization | 48/1434 | 358/18723 | 1.03e-04 | 1.96e-03 | 48 |
| GO:007147813 | Breast | IDC | cellular response to radiation | 29/1434 | 186/18723 | 1.91e-04 | 3.15e-03 | 29 |
| Page: 1 2 3 4 5 6 7 8 9 10 11 12 13 14 15 16 17 18 19 20 21 22 23 24 25 26 27 28 29 30 31 32 33 34 35 36 |
| Pathway ID | Tissue | Disease Stage | Description | Gene Ratio | Bg Ratio | pvalue | p.adjust | qvalue | Count |
| hsa0471424 | Breast | IDC | Thermogenesis | 75/867 | 232/8465 | 8.41e-21 | 3.04e-19 | 2.27e-19 | 75 |
| hsa0520824 | Breast | IDC | Chemical carcinogenesis - reactive oxygen species | 71/867 | 223/8465 | 2.55e-19 | 7.53e-18 | 5.63e-18 | 71 |
| hsa0491523 | Breast | IDC | Estrogen signaling pathway | 35/867 | 138/8465 | 2.55e-07 | 5.18e-06 | 3.88e-06 | 35 |
| hsa0520523 | Breast | IDC | Proteoglycans in cancer | 42/867 | 205/8465 | 7.69e-06 | 9.99e-05 | 7.48e-05 | 42 |
| hsa0516324 | Breast | IDC | Human cytomegalovirus infection | 39/867 | 225/8465 | 6.66e-04 | 5.41e-03 | 4.05e-03 | 39 |
| hsa0520322 | Breast | IDC | Viral carcinogenesis | 34/867 | 204/8465 | 2.82e-03 | 1.86e-02 | 1.39e-02 | 34 |
| hsa052147 | Breast | IDC | Glioma | 16/867 | 75/8465 | 3.30e-03 | 2.10e-02 | 1.57e-02 | 16 |
| hsa052109 | Breast | IDC | Colorectal cancer | 17/867 | 86/8465 | 5.70e-03 | 3.13e-02 | 2.34e-02 | 17 |
| hsa045109 | Breast | IDC | Focal adhesion | 32/867 | 203/8465 | 8.60e-03 | 4.23e-02 | 3.17e-02 | 32 |
| hsa052118 | Breast | IDC | Renal cell carcinoma | 14/867 | 69/8465 | 9.16e-03 | 4.37e-02 | 3.27e-02 | 14 |
| hsa0522010 | Breast | IDC | Chronic myeloid leukemia | 15/867 | 76/8465 | 9.24e-03 | 4.37e-02 | 3.27e-02 | 15 |
| hsa0471434 | Breast | IDC | Thermogenesis | 75/867 | 232/8465 | 8.41e-21 | 3.04e-19 | 2.27e-19 | 75 |
| hsa0520834 | Breast | IDC | Chemical carcinogenesis - reactive oxygen species | 71/867 | 223/8465 | 2.55e-19 | 7.53e-18 | 5.63e-18 | 71 |
| hsa0491533 | Breast | IDC | Estrogen signaling pathway | 35/867 | 138/8465 | 2.55e-07 | 5.18e-06 | 3.88e-06 | 35 |
| hsa0520533 | Breast | IDC | Proteoglycans in cancer | 42/867 | 205/8465 | 7.69e-06 | 9.99e-05 | 7.48e-05 | 42 |
| hsa0516334 | Breast | IDC | Human cytomegalovirus infection | 39/867 | 225/8465 | 6.66e-04 | 5.41e-03 | 4.05e-03 | 39 |
| hsa0520332 | Breast | IDC | Viral carcinogenesis | 34/867 | 204/8465 | 2.82e-03 | 1.86e-02 | 1.39e-02 | 34 |
| hsa0521413 | Breast | IDC | Glioma | 16/867 | 75/8465 | 3.30e-03 | 2.10e-02 | 1.57e-02 | 16 |
| hsa0521014 | Breast | IDC | Colorectal cancer | 17/867 | 86/8465 | 5.70e-03 | 3.13e-02 | 2.34e-02 | 17 |
| hsa0451013 | Breast | IDC | Focal adhesion | 32/867 | 203/8465 | 8.60e-03 | 4.23e-02 | 3.17e-02 | 32 |
| Page: 1 2 3 4 5 6 7 8 9 10 11 12 13 14 15 16 17 18 19 20 21 22 23 24 25 26 27 |
Top |
Cell-cell communication analysis |
| Identification of potential cell-cell interactions between two cell types and their ligand-receptor pairs for different disease states |
| Ligand | Receptor | LRpair | Pathway | Tissue | Disease Stage |
| Page: 1 |
Top |
Single-cell gene regulatory network inference analysis |
| Find out the significant the regulons (TFs) and the target genes of each regulon across cell types for different disease states |
| TF | Cell Type | Tissue | Disease Stage | Target Gene | RSS | Regulon Activity |
| ∗The dot plots of a searched regulon are shown for all cell subpopulations in each disease state of each tissue based on the regulon specific score inferred using pySCENIC and by calculating the average expression. |
| Page: 1 |
Top |
Somatic mutation of malignant transformation related genes |
| Annotation of somatic variants for genes involved in malignant transformation |
| Hugo Symbol | Variant Class | Variant Classification | dbSNP RS | HGVSc | HGVSp | HGVSp Short | SWISSPROT | BIOTYPE | SIFT | PolyPhen | Tumor Sample Barcode | Tissue | Histology | Sex | Age | Stage | Therapy Types | Drugs | Outcome |
| GRB2 | SNV | Missense_Mutation | rs371871562 | c.644G>A | p.Arg215Gln | p.R215Q | P62993 | protein_coding | tolerated(0.25) | benign(0) | TCGA-AO-A0J6-01 | Breast | breast invasive carcinoma | Female | <65 | I/II | Chemotherapy | doxorubicin | SD |
| GRB2 | deletion | Frame_Shift_Del | novel | c.585delN | p.Gly196GlufsTer18 | p.G196Efs*18 | P62993 | protein_coding | TCGA-D8-A27V-01 | Breast | breast invasive carcinoma | Female | <65 | I/II | Hormone Therapy | tamoxiphen | SD | ||
| GRB2 | SNV | Missense_Mutation | novel | c.518N>C | p.Gly173Ala | p.G173A | P62993 | protein_coding | tolerated(0.18) | benign(0.164) | TCGA-HM-A4S6-01 | Cervix | cervical & endocervical cancer | Female | <65 | III/IV | Chemotherapy | cisplatin | CR |
| GRB2 | SNV | Missense_Mutation | c.467N>G | p.Gln156Arg | p.Q156R | P62993 | protein_coding | tolerated(0.43) | benign(0.208) | TCGA-AA-A00N-01 | Colorectum | colon adenocarcinoma | Male | >=65 | I/II | Unknown | Unknown | PD | |
| GRB2 | SNV | Missense_Mutation | c.346N>A | p.Gly116Arg | p.G116R | P62993 | protein_coding | deleterious(0) | probably_damaging(0.999) | TCGA-AD-6964-01 | Colorectum | colon adenocarcinoma | Male | <65 | III/IV | Chemotherapy | folfox | PD | |
| GRB2 | SNV | Missense_Mutation | novel | c.380N>A | p.Ser127Tyr | p.S127Y | P62993 | protein_coding | deleterious(0) | probably_damaging(1) | TCGA-AG-A002-01 | Colorectum | rectum adenocarcinoma | Male | <65 | I/II | Unknown | Unknown | SD |
| GRB2 | SNV | Missense_Mutation | novel | c.235N>T | p.His79Tyr | p.H79Y | P62993 | protein_coding | tolerated(0.47) | benign(0.003) | TCGA-AJ-A3EK-01 | Endometrium | uterine corpus endometrioid carcinoma | Female | <65 | I/II | Chemotherapy | carboplatin | CR |
| GRB2 | SNV | Missense_Mutation | c.350N>G | p.Lys117Arg | p.K117R | P62993 | protein_coding | tolerated(0.07) | possibly_damaging(0.814) | TCGA-B5-A11H-01 | Endometrium | uterine corpus endometrioid carcinoma | Female | >=65 | III/IV | Hormone Therapy | megace | SD | |
| GRB2 | SNV | Missense_Mutation | rs754676096 | c.173N>G | p.His58Arg | p.H58R | P62993 | protein_coding | tolerated(0.08) | probably_damaging(0.954) | TCGA-B5-A11Y-01 | Endometrium | uterine corpus endometrioid carcinoma | Female | <65 | I/II | Unknown | Unknown | SD |
| GRB2 | SNV | Missense_Mutation | c.238G>A | p.Asp80Asn | p.D80N | P62993 | protein_coding | tolerated(0.5) | benign(0.104) | TCGA-BS-A0UV-01 | Endometrium | uterine corpus endometrioid carcinoma | Female | <65 | III/IV | Unknown | Unknown | SD |
| Page: 1 2 3 |
Top |
Related drugs of malignant transformation related genes |
| Identification of chemicals and drugs interact with genes involved in malignant transfromation |
| (DGIdb 4.0) |
| Entrez ID | Symbol | Category | Interaction Types | Drug Claim Name | Drug Name | PMIDs |
| 2885 | GRB2 | NA | LIPOSOMAL GRB-2 | |||
| 2885 | GRB2 | NA | HEREGULIN | 11175341 | ||
| 2885 | GRB2 | NA | ACTINOMYCIN D | 15964235 | ||
| 2885 | GRB2 | NA | ANTINEOPLASTIC | 10403397 | ||
| 2885 | GRB2 | NA | TCDD | 9918770 |
| Page: 1 |

Copyright 2023-Present -The University of Texas Health Science Center at Houston |