
|
|||||
|
 | |
| |
| |
| |
| |
| |
|
Gene: GRB14 |
Gene summary for GRB14 |
| Gene information | Species | Human | Gene symbol | GRB14 | Gene ID | 2888 |
| Gene name | growth factor receptor bound protein 14 | |
| Gene Alias | GRB14 | |
| Cytomap | 2q24.3 | |
| Gene Type | protein-coding | GO ID | GO:0007154 | UniProtAcc | Q14449 |
Top |
Malignant transformation analysis |
| Identification of the aberrant gene expression in precancerous and cancerous lesions by comparing the gene expression of stem-like cells in diseased tissues with normal stem cells |
| Entrez ID | Symbol | Replicates | Species | Organ | Tissue | Adj P-value | Log2FC | Malignancy |
| 2888 | GRB14 | NAFLD1 | Human | Liver | NAFLD | 1.44e-09 | 9.36e-01 | -0.04 |
| 2888 | GRB14 | S43 | Human | Liver | Cirrhotic | 1.60e-14 | -3.43e-01 | -0.0187 |
| 2888 | GRB14 | HCC1_Meng | Human | Liver | HCC | 1.24e-80 | -6.84e-02 | 0.0246 |
| 2888 | GRB14 | HCC2_Meng | Human | Liver | HCC | 2.56e-10 | -2.95e-01 | 0.0107 |
| 2888 | GRB14 | cirrhotic1 | Human | Liver | Cirrhotic | 2.34e-03 | -3.26e-02 | 0.0202 |
| 2888 | GRB14 | cirrhotic2 | Human | Liver | Cirrhotic | 4.70e-04 | -9.31e-03 | 0.0201 |
| 2888 | GRB14 | HCC2 | Human | Liver | HCC | 2.06e-05 | 2.63e+00 | 0.5341 |
| 2888 | GRB14 | Pt13.a | Human | Liver | HCC | 8.15e-04 | -2.58e-01 | 0.021 |
| 2888 | GRB14 | Pt13.b | Human | Liver | HCC | 9.48e-04 | -1.94e-01 | 0.0251 |
| 2888 | GRB14 | Pt13.c | Human | Liver | HCC | 3.57e-04 | -3.43e-01 | 0.0076 |
| 2888 | GRB14 | S028 | Human | Liver | HCC | 1.40e-03 | 2.77e-01 | 0.2503 |
| 2888 | GRB14 | S029 | Human | Liver | HCC | 5.21e-04 | 4.63e-01 | 0.2581 |
| 2888 | GRB14 | RNA-P25T1-P25T1-1 | Human | Lung | AIS | 1.25e-07 | 5.96e-01 | -0.2116 |
| 2888 | GRB14 | RNA-P25T1-P25T1-4 | Human | Lung | AIS | 2.91e-09 | 5.87e-01 | -0.2119 |
| Page: 1 |
| Tissue | Expression Dynamics | Abbreviation |
| Liver | 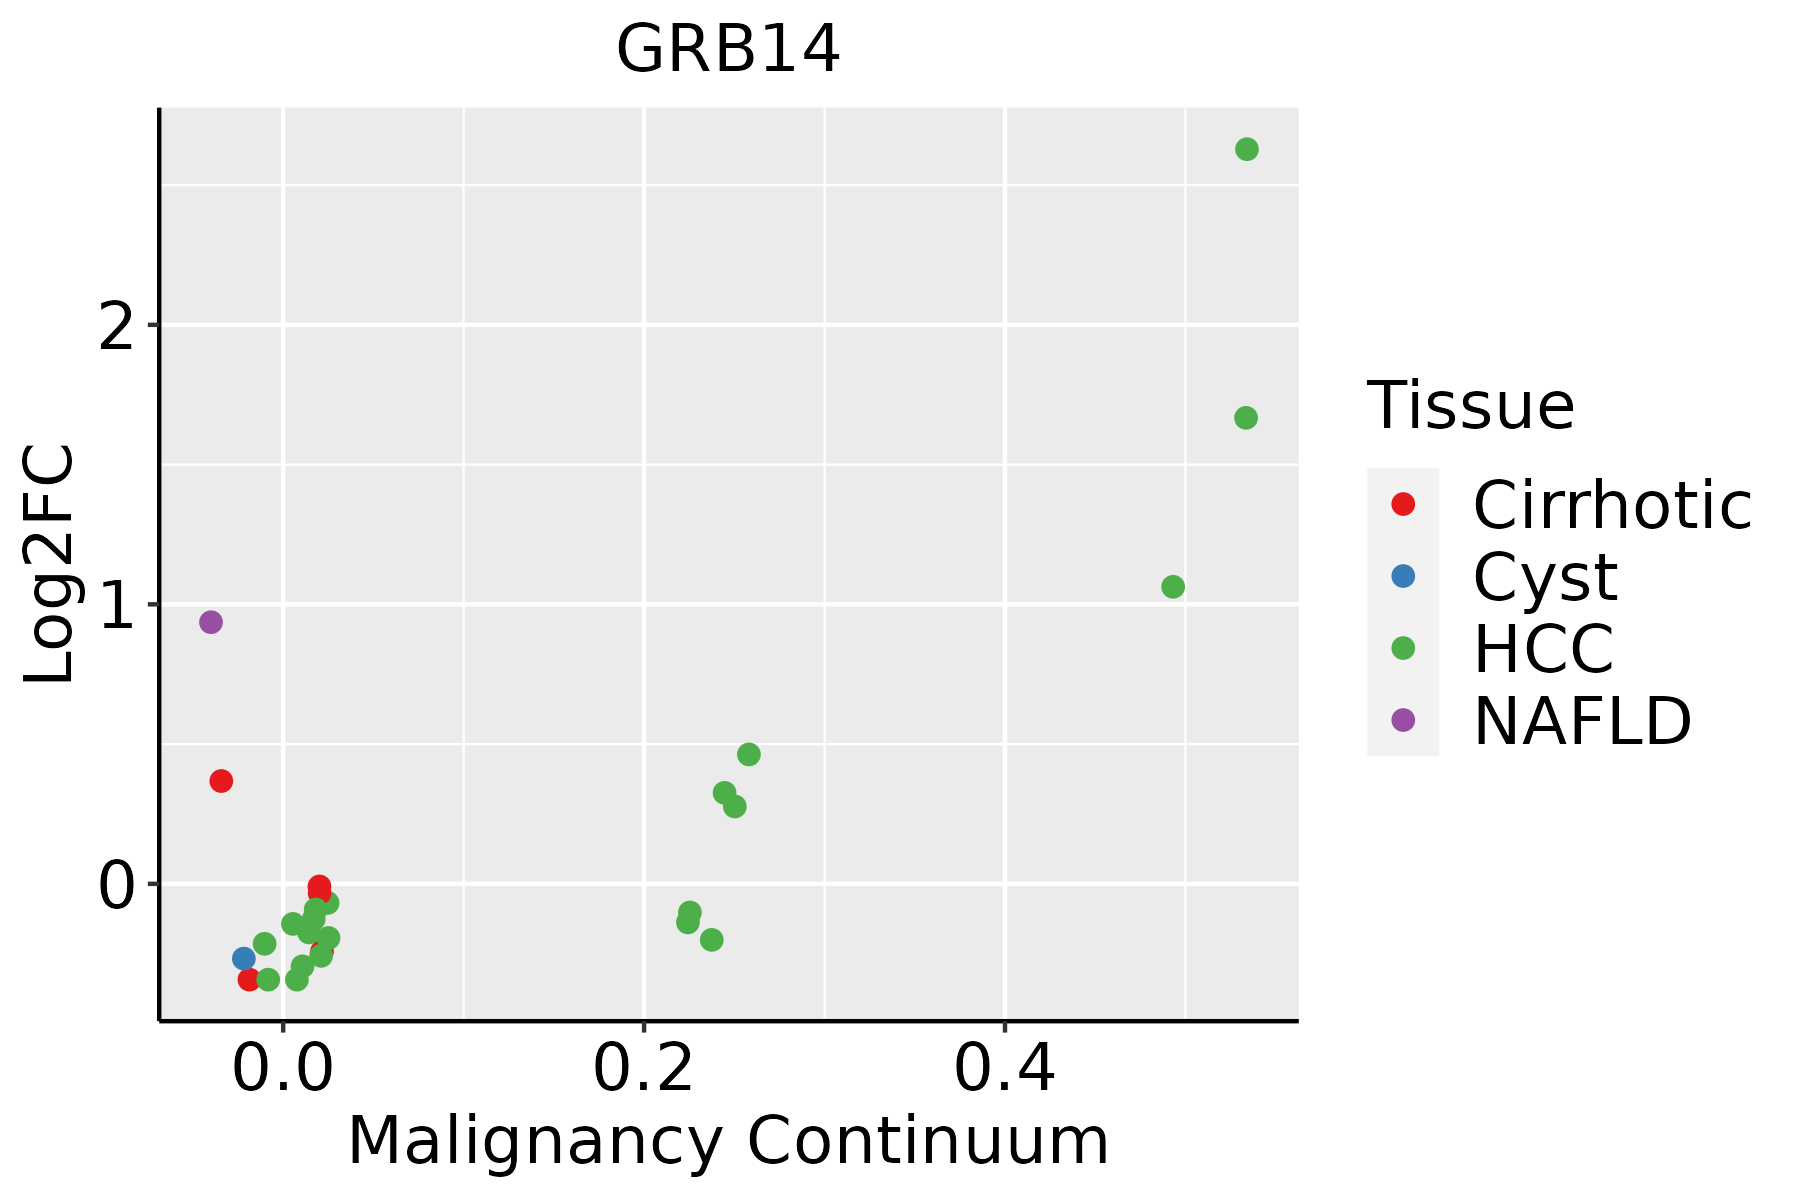 | HCC: Hepatocellular carcinoma |
| NAFLD: Non-alcoholic fatty liver disease | ||
| Lung | 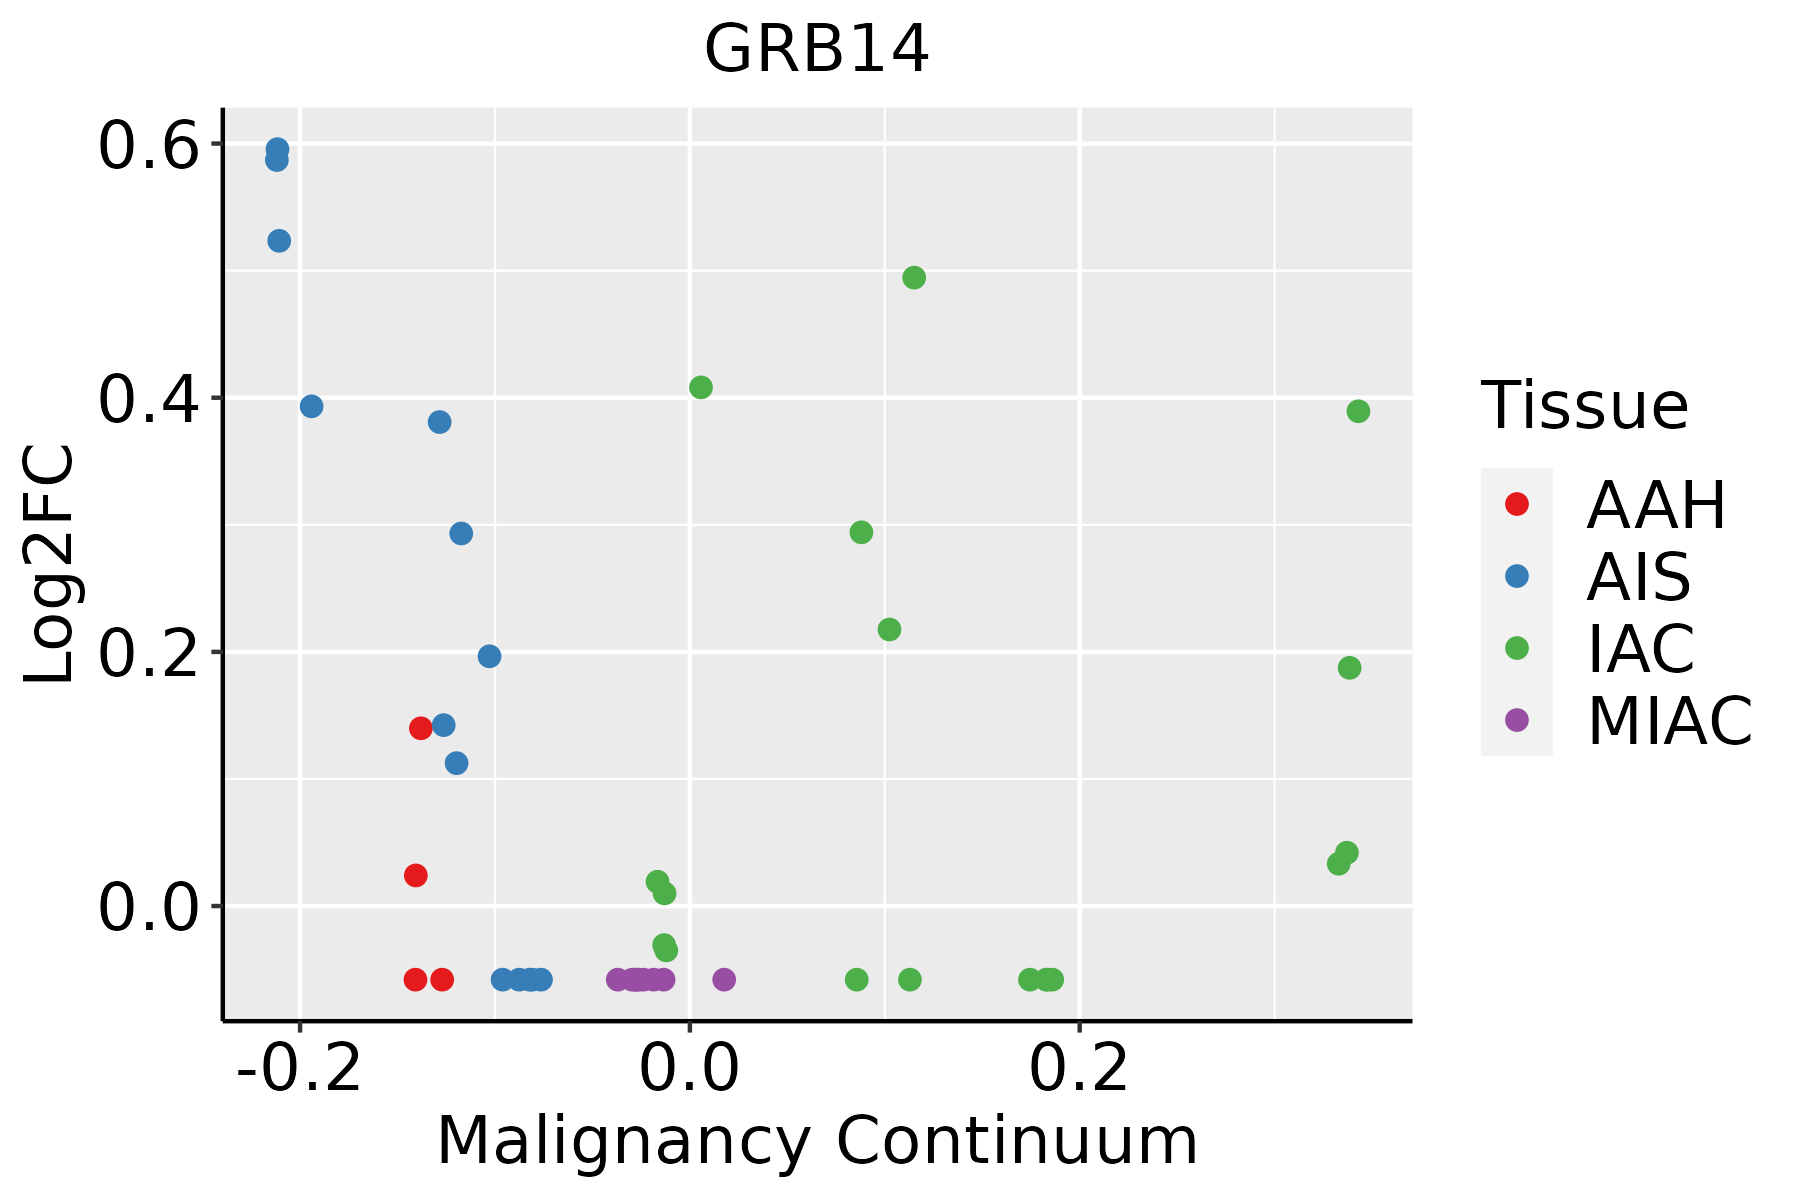 | AAH: Atypical adenomatous hyperplasia |
| AIS: Adenocarcinoma in situ | ||
| IAC: Invasive lung adenocarcinoma | ||
| MIA: Minimally invasive adenocarcinoma |
| ∗log2FC in expression of this searched gene in stem-like cells from each diseased tissue sample relative to stem-like cells in normal samples in each tissue plotted against the malignancy continuum. Samples are colored based on if they are from different disease stage. |
Top |
Malignant transformation related pathway analysis |
| Find out the enriched GO biological processes and KEGG pathways involved in transition from healthy to precancer to cancer |
| Tissue | Disease Stage | Enriched GO biological Processes |
| Colorectum | AD |  |
| Colorectum | SER |  |
| Colorectum | MSS |  |
| Colorectum | MSI-H |  |
| Colorectum | FAP |  |
| ∗Top 15 enriched GO BP terms are showed in the bar plot of each disease state in each tissue. Each row represents a significant GO biological process which is colored according to the -log10(p.adjust). |
| Page: 1 2 3 4 5 6 7 8 9 |
| GO ID | Tissue | Disease Stage | Description | Gene Ratio | Bg Ratio | pvalue | p.adjust | Count |
| GO:00713755 | Liver | NAFLD | cellular response to peptide hormone stimulus | 65/1882 | 290/18723 | 3.95e-10 | 9.62e-08 | 65 |
| GO:19016536 | Liver | NAFLD | cellular response to peptide | 71/1882 | 359/18723 | 1.82e-08 | 2.09e-06 | 71 |
| GO:00328695 | Liver | NAFLD | cellular response to insulin stimulus | 47/1882 | 203/18723 | 3.60e-08 | 3.63e-06 | 47 |
| GO:00434346 | Liver | NAFLD | response to peptide hormone | 76/1882 | 414/18723 | 1.51e-07 | 1.09e-05 | 76 |
| GO:00328685 | Liver | NAFLD | response to insulin | 53/1882 | 264/18723 | 6.99e-07 | 3.95e-05 | 53 |
| GO:00082863 | Liver | NAFLD | insulin receptor signaling pathway | 27/1882 | 116/18723 | 2.50e-05 | 6.76e-04 | 27 |
| GO:0046626 | Liver | NAFLD | regulation of insulin receptor signaling pathway | 16/1882 | 66/18723 | 6.66e-04 | 8.61e-03 | 16 |
| GO:1900076 | Liver | NAFLD | regulation of cellular response to insulin stimulus | 15/1882 | 64/18723 | 1.40e-03 | 1.57e-02 | 15 |
| GO:004343412 | Liver | Cirrhotic | response to peptide hormone | 149/4634 | 414/18723 | 1.70e-07 | 4.49e-06 | 149 |
| GO:007137511 | Liver | Cirrhotic | cellular response to peptide hormone stimulus | 110/4634 | 290/18723 | 3.73e-07 | 8.82e-06 | 110 |
| GO:190165311 | Liver | Cirrhotic | cellular response to peptide | 129/4634 | 359/18723 | 1.23e-06 | 2.49e-05 | 129 |
| GO:003286911 | Liver | Cirrhotic | cellular response to insulin stimulus | 80/4634 | 203/18723 | 2.55e-06 | 4.63e-05 | 80 |
| GO:003286811 | Liver | Cirrhotic | response to insulin | 95/4634 | 264/18723 | 2.77e-05 | 3.54e-04 | 95 |
| GO:000828611 | Liver | Cirrhotic | insulin receptor signaling pathway | 44/4634 | 116/18723 | 1.09e-03 | 7.59e-03 | 44 |
| GO:19000761 | Liver | Cirrhotic | regulation of cellular response to insulin stimulus | 26/4634 | 64/18723 | 3.69e-03 | 2.03e-02 | 26 |
| GO:003286821 | Liver | HCC | response to insulin | 172/7958 | 264/18723 | 7.14e-14 | 4.23e-12 | 172 |
| GO:003286921 | Liver | HCC | cellular response to insulin stimulus | 137/7958 | 203/18723 | 4.69e-13 | 2.44e-11 | 137 |
| GO:004343422 | Liver | HCC | response to peptide hormone | 247/7958 | 414/18723 | 9.55e-13 | 4.77e-11 | 247 |
| GO:007137521 | Liver | HCC | cellular response to peptide hormone stimulus | 179/7958 | 290/18723 | 2.54e-11 | 9.88e-10 | 179 |
| GO:190165321 | Liver | HCC | cellular response to peptide | 211/7958 | 359/18723 | 2.86e-10 | 9.63e-09 | 211 |
| Page: 1 2 |
| Pathway ID | Tissue | Disease Stage | Description | Gene Ratio | Bg Ratio | pvalue | p.adjust | qvalue | Count |
| Page: 1 |
Top |
Cell-cell communication analysis |
| Identification of potential cell-cell interactions between two cell types and their ligand-receptor pairs for different disease states |
| Ligand | Receptor | LRpair | Pathway | Tissue | Disease Stage |
| Page: 1 |
Top |
Single-cell gene regulatory network inference analysis |
| Find out the significant the regulons (TFs) and the target genes of each regulon across cell types for different disease states |
| TF | Cell Type | Tissue | Disease Stage | Target Gene | RSS | Regulon Activity |
| ∗The dot plots of a searched regulon are shown for all cell subpopulations in each disease state of each tissue based on the regulon specific score inferred using pySCENIC and by calculating the average expression. |
| Page: 1 |
Top |
Somatic mutation of malignant transformation related genes |
| Annotation of somatic variants for genes involved in malignant transformation |
| Hugo Symbol | Variant Class | Variant Classification | dbSNP RS | HGVSc | HGVSp | HGVSp Short | SWISSPROT | BIOTYPE | SIFT | PolyPhen | Tumor Sample Barcode | Tissue | Histology | Sex | Age | Stage | Therapy Types | Drugs | Outcome |
| GRB14 | SNV | Missense_Mutation | novel | c.457G>C | p.Glu153Gln | p.E153Q | Q14449 | protein_coding | deleterious(0) | probably_damaging(0.999) | TCGA-3C-AALI-01 | Breast | breast invasive carcinoma | Female | <65 | I/II | Unspecific | Poly E | Complete Response |
| GRB14 | SNV | Missense_Mutation | novel | c.844N>A | p.Glu282Lys | p.E282K | Q14449 | protein_coding | deleterious(0.04) | benign(0.069) | TCGA-AN-A046-01 | Breast | breast invasive carcinoma | Female | >=65 | I/II | Unknown | Unknown | SD |
| GRB14 | SNV | Missense_Mutation | rs771370778 | c.724N>T | p.His242Tyr | p.H242Y | Q14449 | protein_coding | tolerated(0.17) | benign(0.129) | TCGA-BH-A204-01 | Breast | breast invasive carcinoma | Female | >=65 | I/II | Unknown | Unknown | SD |
| GRB14 | deletion | Frame_Shift_Del | c.839delN | p.Phe280SerfsTer40 | p.F280Sfs*40 | Q14449 | protein_coding | TCGA-D8-A1XQ-01 | Breast | breast invasive carcinoma | Female | >=65 | I/II | Unknown | Unknown | SD | |||
| GRB14 | SNV | Missense_Mutation | rs570762396 | c.823N>T | p.Arg275Trp | p.R275W | Q14449 | protein_coding | deleterious(0) | probably_damaging(0.999) | TCGA-C5-A3HL-01 | Cervix | cervical & endocervical cancer | Female | >=65 | I/II | Unknown | Unknown | SD |
| GRB14 | SNV | Missense_Mutation | novel | c.1229N>C | p.Gly410Ala | p.G410A | Q14449 | protein_coding | tolerated(0.14) | benign(0.02) | TCGA-JW-A5VL-01 | Cervix | cervical & endocervical cancer | Female | <65 | I/II | Unknown | Unknown | SD |
| GRB14 | SNV | Missense_Mutation | c.1117N>A | p.Glu373Lys | p.E373K | Q14449 | protein_coding | deleterious(0.02) | benign(0.444) | TCGA-Q1-A73O-01 | Cervix | cervical & endocervical cancer | Female | <65 | I/II | Chemotherapy | cisplatin | CR | |
| GRB14 | SNV | Missense_Mutation | rs368925193 | c.1006G>A | p.Ala336Thr | p.A336T | Q14449 | protein_coding | deleterious(0) | probably_damaging(0.997) | TCGA-AA-3710-01 | Colorectum | colon adenocarcinoma | Female | >=65 | I/II | Unknown | Unknown | SD |
| GRB14 | SNV | Missense_Mutation | novel | c.1119G>T | p.Glu373Asp | p.E373D | Q14449 | protein_coding | tolerated(0.24) | benign(0.147) | TCGA-AG-3892-01 | Colorectum | rectum adenocarcinoma | Female | <65 | I/II | Unknown | Unknown | SD |
| GRB14 | SNV | Missense_Mutation | c.1114N>C | p.Ser372Pro | p.S372P | Q14449 | protein_coding | deleterious(0) | probably_damaging(0.998) | TCGA-AG-A002-01 | Colorectum | rectum adenocarcinoma | Male | <65 | I/II | Unknown | Unknown | SD |
| Page: 1 2 3 4 5 6 |
Top |
Related drugs of malignant transformation related genes |
| Identification of chemicals and drugs interact with genes involved in malignant transfromation |
| (DGIdb 4.0) |
| Entrez ID | Symbol | Category | Interaction Types | Drug Claim Name | Drug Name | PMIDs |
| 2888 | GRB14 | KINASE | INSULIN | INSULIN | 12242277 |
| Page: 1 |

Copyright 2023-Present -The University of Texas Health Science Center at Houston |