
|
|||||
|
 | |
| |
| |
| |
| |
| |
|
Gene: GRAMD4 |
Gene summary for GRAMD4 |
| Gene information | Species | Human | Gene symbol | GRAMD4 | Gene ID | 23151 |
| Gene name | GRAM domain containing 4 | |
| Gene Alias | DIP | |
| Cytomap | 22q13.31 | |
| Gene Type | protein-coding | GO ID | GO:0002221 | UniProtAcc | Q6IC98 |
Top |
Malignant transformation analysis |
| Identification of the aberrant gene expression in precancerous and cancerous lesions by comparing the gene expression of stem-like cells in diseased tissues with normal stem cells |
| Entrez ID | Symbol | Replicates | Species | Organ | Tissue | Adj P-value | Log2FC | Malignancy |
| 23151 | GRAMD4 | HTA11_347_2000001011 | Human | Colorectum | AD | 2.60e-15 | 5.56e-01 | -0.1954 |
| 23151 | GRAMD4 | HTA11_83_2000001011 | Human | Colorectum | SER | 7.44e-03 | 4.19e-01 | -0.1526 |
| 23151 | GRAMD4 | HTA11_696_2000001011 | Human | Colorectum | AD | 1.06e-03 | 4.55e-01 | -0.1464 |
| 23151 | GRAMD4 | HTA11_1391_2000001011 | Human | Colorectum | AD | 1.72e-03 | 3.77e-01 | -0.059 |
| 23151 | GRAMD4 | HTA11_99999971662_82457 | Human | Colorectum | MSS | 4.13e-06 | 4.72e-01 | 0.3859 |
| 23151 | GRAMD4 | A002-C-010 | Human | Colorectum | FAP | 5.28e-07 | -2.85e-01 | 0.242 |
| 23151 | GRAMD4 | A001-C-207 | Human | Colorectum | FAP | 2.86e-02 | -2.68e-01 | 0.1278 |
| 23151 | GRAMD4 | A015-C-203 | Human | Colorectum | FAP | 2.41e-12 | -2.66e-01 | -0.1294 |
| 23151 | GRAMD4 | A015-C-204 | Human | Colorectum | FAP | 2.03e-03 | -2.72e-01 | -0.0228 |
| 23151 | GRAMD4 | A002-C-201 | Human | Colorectum | FAP | 5.26e-06 | -2.93e-01 | 0.0324 |
| 23151 | GRAMD4 | A002-C-203 | Human | Colorectum | FAP | 6.31e-05 | -2.32e-01 | 0.2786 |
| 23151 | GRAMD4 | A001-C-108 | Human | Colorectum | FAP | 9.33e-06 | -2.38e-01 | -0.0272 |
| 23151 | GRAMD4 | A002-C-205 | Human | Colorectum | FAP | 2.27e-07 | -2.87e-01 | -0.1236 |
| 23151 | GRAMD4 | A001-C-104 | Human | Colorectum | FAP | 3.67e-02 | -1.68e-01 | 0.0184 |
| 23151 | GRAMD4 | A015-C-006 | Human | Colorectum | FAP | 2.05e-04 | -2.65e-01 | -0.0994 |
| 23151 | GRAMD4 | A015-C-106 | Human | Colorectum | FAP | 3.09e-08 | -2.50e-01 | -0.0511 |
| 23151 | GRAMD4 | A002-C-114 | Human | Colorectum | FAP | 1.30e-05 | -2.67e-01 | -0.1561 |
| 23151 | GRAMD4 | A015-C-104 | Human | Colorectum | FAP | 5.91e-13 | -3.02e-01 | -0.1899 |
| 23151 | GRAMD4 | A001-C-014 | Human | Colorectum | FAP | 3.78e-09 | -2.72e-01 | 0.0135 |
| 23151 | GRAMD4 | A002-C-016 | Human | Colorectum | FAP | 8.29e-08 | -3.04e-01 | 0.0521 |
| Page: 1 2 |
| Tissue | Expression Dynamics | Abbreviation |
| Colorectum (GSE201348) |  | FAP: Familial adenomatous polyposis |
| CRC: Colorectal cancer | ||
| Colorectum (HTA11) |  | AD: Adenomas |
| SER: Sessile serrated lesions | ||
| MSI-H: Microsatellite-high colorectal cancer | ||
| MSS: Microsatellite stable colorectal cancer | ||
| Liver | 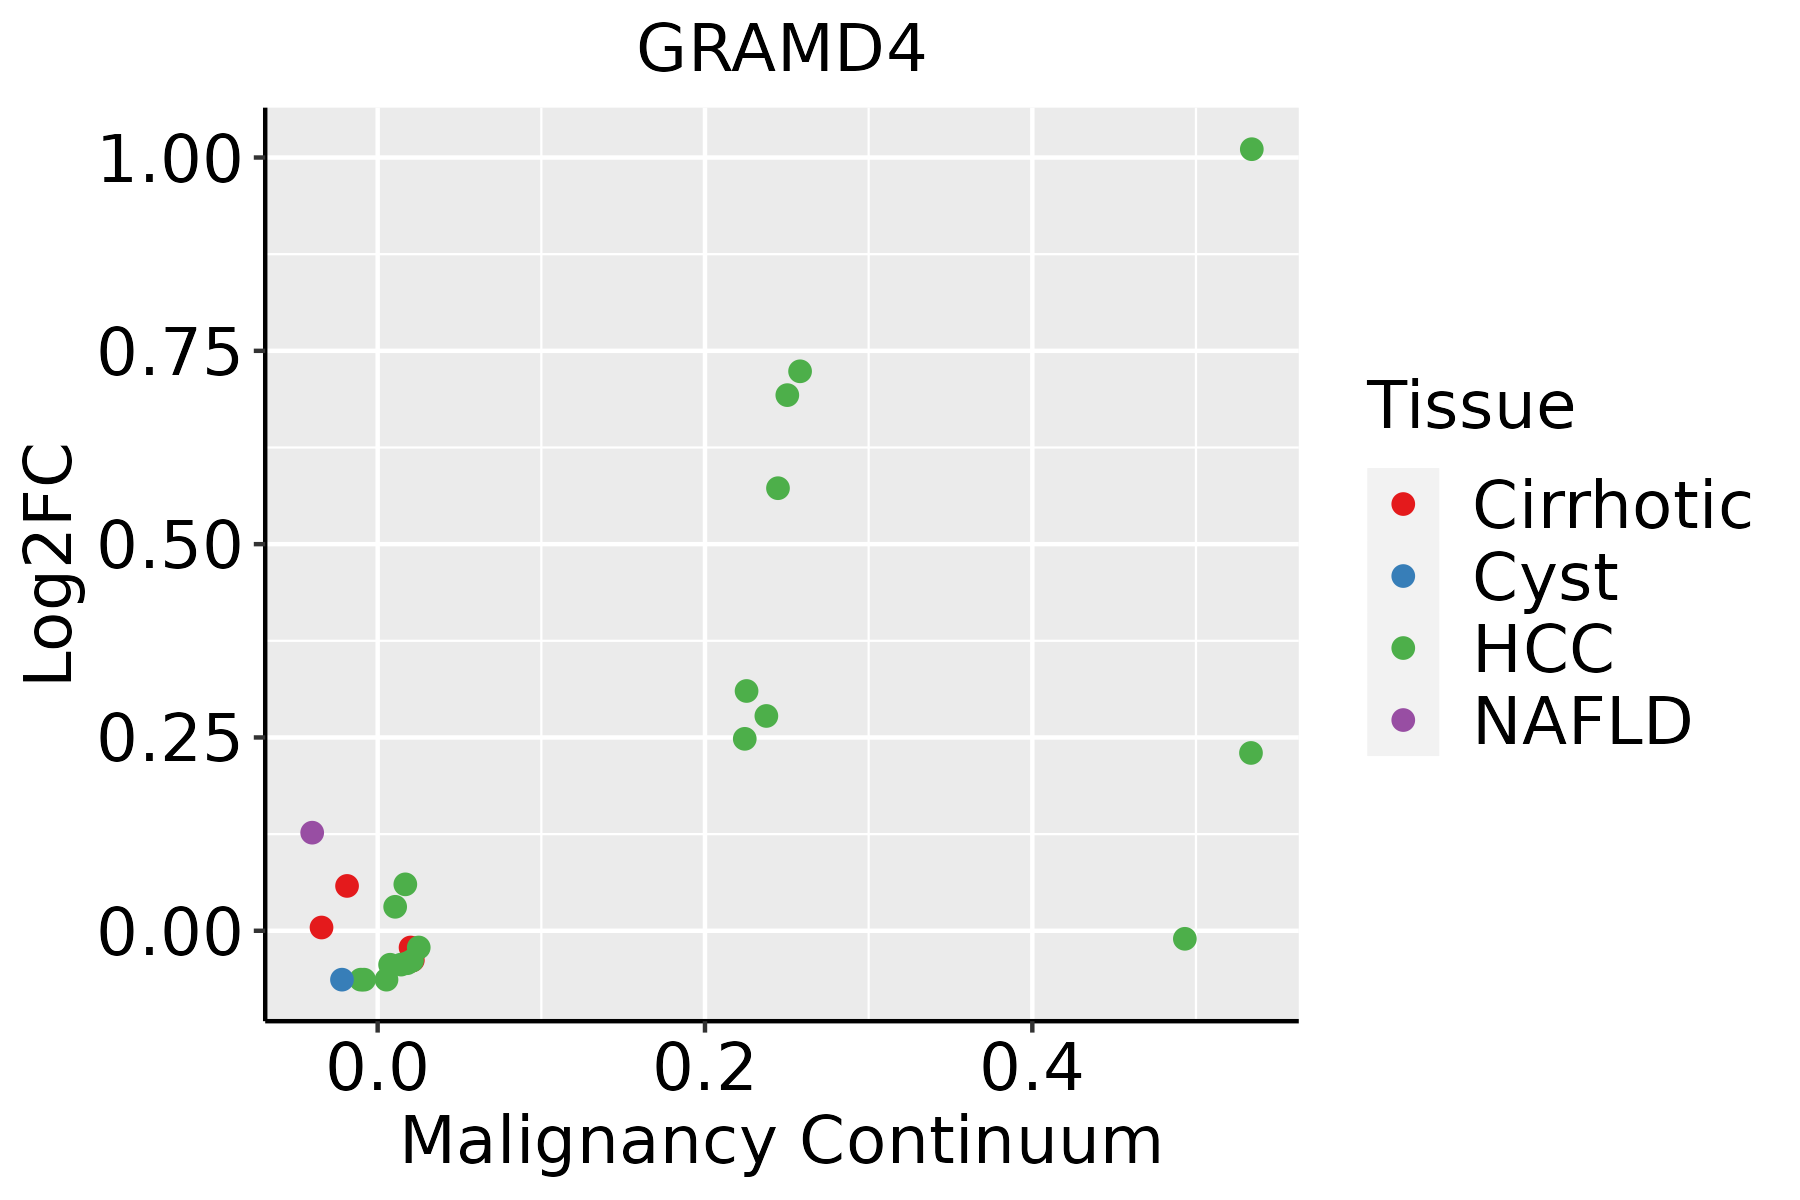 | HCC: Hepatocellular carcinoma |
| NAFLD: Non-alcoholic fatty liver disease |
| ∗log2FC in expression of this searched gene in stem-like cells from each diseased tissue sample relative to stem-like cells in normal samples in each tissue plotted against the malignancy continuum. Samples are colored based on if they are from different disease stage. |
Top |
Malignant transformation related pathway analysis |
| Find out the enriched GO biological processes and KEGG pathways involved in transition from healthy to precancer to cancer |
| Tissue | Disease Stage | Enriched GO biological Processes |
| Colorectum | AD |  |
| Colorectum | SER |  |
| Colorectum | MSS |  |
| Colorectum | MSI-H |  |
| Colorectum | FAP |  |
| ∗Top 15 enriched GO BP terms are showed in the bar plot of each disease state in each tissue. Each row represents a significant GO biological process which is colored according to the -log10(p.adjust). |
| Page: 1 2 3 4 5 6 7 8 9 |
| GO ID | Tissue | Disease Stage | Description | Gene Ratio | Bg Ratio | pvalue | p.adjust | Count |
| GO:0045862 | Colorectum | AD | positive regulation of proteolysis | 129/3918 | 372/18723 | 4.04e-10 | 3.46e-08 | 129 |
| GO:0043281 | Colorectum | AD | regulation of cysteine-type endopeptidase activity involved in apoptotic process | 72/3918 | 209/18723 | 3.70e-06 | 1.03e-04 | 72 |
| GO:2000116 | Colorectum | AD | regulation of cysteine-type endopeptidase activity | 79/3918 | 235/18723 | 3.74e-06 | 1.03e-04 | 79 |
| GO:0052547 | Colorectum | AD | regulation of peptidase activity | 137/3918 | 461/18723 | 4.12e-06 | 1.12e-04 | 137 |
| GO:0010952 | Colorectum | AD | positive regulation of peptidase activity | 68/3918 | 197/18723 | 6.30e-06 | 1.59e-04 | 68 |
| GO:0052548 | Colorectum | AD | regulation of endopeptidase activity | 124/3918 | 432/18723 | 6.58e-05 | 1.07e-03 | 124 |
| GO:0010950 | Colorectum | AD | positive regulation of endopeptidase activity | 59/3918 | 179/18723 | 1.11e-04 | 1.65e-03 | 59 |
| GO:2001056 | Colorectum | AD | positive regulation of cysteine-type endopeptidase activity | 47/3918 | 148/18723 | 1.30e-03 | 1.14e-02 | 47 |
| GO:0043280 | Colorectum | AD | positive regulation of cysteine-type endopeptidase activity involved in apoptotic process | 42/3918 | 129/18723 | 1.33e-03 | 1.16e-02 | 42 |
| GO:00458621 | Colorectum | SER | positive regulation of proteolysis | 106/2897 | 372/18723 | 8.40e-11 | 1.20e-08 | 106 |
| GO:00525471 | Colorectum | SER | regulation of peptidase activity | 114/2897 | 461/18723 | 1.18e-07 | 7.17e-06 | 114 |
| GO:00525481 | Colorectum | SER | regulation of endopeptidase activity | 103/2897 | 432/18723 | 2.86e-06 | 1.16e-04 | 103 |
| GO:00109521 | Colorectum | SER | positive regulation of peptidase activity | 55/2897 | 197/18723 | 5.44e-06 | 2.00e-04 | 55 |
| GO:00432811 | Colorectum | SER | regulation of cysteine-type endopeptidase activity involved in apoptotic process | 57/2897 | 209/18723 | 8.08e-06 | 2.74e-04 | 57 |
| GO:20001161 | Colorectum | SER | regulation of cysteine-type endopeptidase activity | 62/2897 | 235/18723 | 1.05e-05 | 3.39e-04 | 62 |
| GO:00109501 | Colorectum | SER | positive regulation of endopeptidase activity | 47/2897 | 179/18723 | 1.32e-04 | 2.66e-03 | 47 |
| GO:00432801 | Colorectum | SER | positive regulation of cysteine-type endopeptidase activity involved in apoptotic process | 33/2897 | 129/18723 | 1.97e-03 | 1.97e-02 | 33 |
| GO:20010561 | Colorectum | SER | positive regulation of cysteine-type endopeptidase activity | 36/2897 | 148/18723 | 3.21e-03 | 2.76e-02 | 36 |
| GO:00458622 | Colorectum | MSS | positive regulation of proteolysis | 119/3467 | 372/18723 | 2.14e-10 | 2.09e-08 | 119 |
| GO:00525472 | Colorectum | MSS | regulation of peptidase activity | 130/3467 | 461/18723 | 1.81e-07 | 8.13e-06 | 130 |
| Page: 1 2 3 |
| Pathway ID | Tissue | Disease Stage | Description | Gene Ratio | Bg Ratio | pvalue | p.adjust | qvalue | Count |
| Page: 1 |
Top |
Cell-cell communication analysis |
| Identification of potential cell-cell interactions between two cell types and their ligand-receptor pairs for different disease states |
| Ligand | Receptor | LRpair | Pathway | Tissue | Disease Stage |
| Page: 1 |
Top |
Single-cell gene regulatory network inference analysis |
| Find out the significant the regulons (TFs) and the target genes of each regulon across cell types for different disease states |
| TF | Cell Type | Tissue | Disease Stage | Target Gene | RSS | Regulon Activity |
| ∗The dot plots of a searched regulon are shown for all cell subpopulations in each disease state of each tissue based on the regulon specific score inferred using pySCENIC and by calculating the average expression. |
| Page: 1 |
Top |
Somatic mutation of malignant transformation related genes |
| Annotation of somatic variants for genes involved in malignant transformation |
| Hugo Symbol | Variant Class | Variant Classification | dbSNP RS | HGVSc | HGVSp | HGVSp Short | SWISSPROT | BIOTYPE | SIFT | PolyPhen | Tumor Sample Barcode | Tissue | Histology | Sex | Age | Stage | Therapy Types | Drugs | Outcome |
| GRAMD4 | SNV | Missense_Mutation | c.412N>C | p.Glu138Gln | p.E138Q | Q6IC98 | protein_coding | tolerated(0.1) | benign(0.062) | TCGA-AC-A23H-01 | Breast | breast invasive carcinoma | Female | >=65 | I/II | Unknown | Unknown | PD | |
| GRAMD4 | SNV | Missense_Mutation | novel | c.227G>A | p.Arg76Gln | p.R76Q | Q6IC98 | protein_coding | tolerated(0.3) | benign(0.005) | TCGA-AN-A046-01 | Breast | breast invasive carcinoma | Female | >=65 | I/II | Unknown | Unknown | SD |
| GRAMD4 | SNV | Missense_Mutation | c.965N>T | p.Lys322Met | p.K322M | Q6IC98 | protein_coding | deleterious(0) | probably_damaging(0.99) | TCGA-AO-A0J4-01 | Breast | breast invasive carcinoma | Female | <65 | I/II | Chemotherapy | doxorubicin | SD | |
| GRAMD4 | SNV | Missense_Mutation | novel | c.812N>A | p.Gly271Glu | p.G271E | Q6IC98 | protein_coding | deleterious(0) | probably_damaging(1) | TCGA-BH-A0HF-01 | Breast | breast invasive carcinoma | Female | >=65 | I/II | Hormone Therapy | arimidex | SD |
| GRAMD4 | SNV | Missense_Mutation | c.736N>C | p.Trp246Arg | p.W246R | Q6IC98 | protein_coding | tolerated(0.07) | possibly_damaging(0.8) | TCGA-D8-A1XQ-01 | Breast | breast invasive carcinoma | Female | >=65 | I/II | Unknown | Unknown | SD | |
| GRAMD4 | insertion | Nonsense_Mutation | novel | c.436_437insGTGGAAGCTGAAGGTCCTGGGAGCATT | p.Lys146delinsSerGlySerTerArgSerTrpGluHisTer | p.K146delinsSGS*RSWEH* | Q6IC98 | protein_coding | TCGA-A8-A07R-01 | Breast | breast invasive carcinoma | Female | >=65 | III/IV | Ancillary | zoledronic | SD | ||
| GRAMD4 | insertion | Frame_Shift_Ins | novel | c.1406_1407insTT | p.Cys470SerfsTer45 | p.C470Sfs*45 | Q6IC98 | protein_coding | TCGA-AQ-A04J-01 | Breast | breast invasive carcinoma | Female | <65 | I/II | Chemotherapy | cytoxan | SD | ||
| GRAMD4 | insertion | Frame_Shift_Ins | novel | c.1408_1409insCTTTG | p.Cys470SerfsTer46 | p.C470Sfs*46 | Q6IC98 | protein_coding | TCGA-AQ-A04J-01 | Breast | breast invasive carcinoma | Female | <65 | I/II | Chemotherapy | cytoxan | SD | ||
| GRAMD4 | deletion | Frame_Shift_Del | novel | c.1533delC | p.Lys512SerfsTer2 | p.K512Sfs*2 | Q6IC98 | protein_coding | TCGA-EW-A2FV-01 | Breast | breast invasive carcinoma | Female | <65 | III/IV | Chemotherapy | docetaxel | SD | ||
| GRAMD4 | SNV | Missense_Mutation | rs368538880 | c.517N>T | p.Arg173Trp | p.R173W | Q6IC98 | protein_coding | deleterious(0.01) | possibly_damaging(0.76) | TCGA-2W-A8YY-01 | Cervix | cervical & endocervical cancer | Female | <65 | I/II | Chemotherapy | cisplatin | CR |
| Page: 1 2 3 4 5 6 7 |
Top |
Related drugs of malignant transformation related genes |
| Identification of chemicals and drugs interact with genes involved in malignant transfromation |
| (DGIdb 4.0) |
| Entrez ID | Symbol | Category | Interaction Types | Drug Claim Name | Drug Name | PMIDs |
| Page: 1 |

Copyright 2023-Present -The University of Texas Health Science Center at Houston |