
|
|||||
|
 | |
| |
| |
| |
| |
| |
|
Gene: GRAMD1C |
Gene summary for GRAMD1C |
| Gene information | Species | Human | Gene symbol | GRAMD1C | Gene ID | 54762 |
| Gene name | GRAM domain containing 1C | |
| Gene Alias | GRAMD1C | |
| Cytomap | 3q13.31 | |
| Gene Type | protein-coding | GO ID | GO:0006810 | UniProtAcc | Q8IYS0 |
Top |
Malignant transformation analysis |
| Identification of the aberrant gene expression in precancerous and cancerous lesions by comparing the gene expression of stem-like cells in diseased tissues with normal stem cells |
| Entrez ID | Symbol | Replicates | Species | Organ | Tissue | Adj P-value | Log2FC | Malignancy |
| 54762 | GRAMD1C | HTA11_2487_2000001011 | Human | Colorectum | SER | 2.17e-02 | 2.45e-01 | -0.1808 |
| 54762 | GRAMD1C | HTA11_1938_2000001011 | Human | Colorectum | AD | 3.62e-14 | 7.80e-01 | -0.0811 |
| 54762 | GRAMD1C | HTA11_78_2000001011 | Human | Colorectum | AD | 1.95e-04 | 3.71e-01 | -0.1088 |
| 54762 | GRAMD1C | HTA11_347_2000001011 | Human | Colorectum | AD | 1.28e-04 | 2.44e-01 | -0.1954 |
| 54762 | GRAMD1C | HTA11_6818_2000001011 | Human | Colorectum | AD | 3.77e-09 | 7.03e-01 | 0.0112 |
| 54762 | GRAMD1C | HTA11_6818_2000001021 | Human | Colorectum | AD | 1.88e-11 | 7.68e-01 | 0.0588 |
| 54762 | GRAMD1C | HTA11_99999970781_79442 | Human | Colorectum | MSS | 3.21e-17 | 7.28e-01 | 0.294 |
| 54762 | GRAMD1C | HTA11_99999965062_69753 | Human | Colorectum | MSI-H | 4.50e-06 | 9.49e-01 | 0.3487 |
| 54762 | GRAMD1C | A015-C-203 | Human | Colorectum | FAP | 1.57e-04 | -1.51e-01 | -0.1294 |
| 54762 | GRAMD1C | A001-C-108 | Human | Colorectum | FAP | 1.41e-04 | -1.87e-01 | -0.0272 |
| 54762 | GRAMD1C | A015-C-104 | Human | Colorectum | FAP | 2.53e-05 | -1.23e-01 | -0.1899 |
| 54762 | GRAMD1C | A001-C-014 | Human | Colorectum | FAP | 8.79e-03 | -1.41e-01 | 0.0135 |
| 54762 | GRAMD1C | A002-C-016 | Human | Colorectum | FAP | 7.89e-05 | -1.71e-01 | 0.0521 |
| 54762 | GRAMD1C | A002-C-116 | Human | Colorectum | FAP | 8.85e-07 | -1.75e-01 | -0.0452 |
| 54762 | GRAMD1C | F034 | Human | Colorectum | FAP | 4.01e-07 | -2.11e-01 | -0.0665 |
| Page: 1 |
| Tissue | Expression Dynamics | Abbreviation |
| Colorectum (GSE201348) | 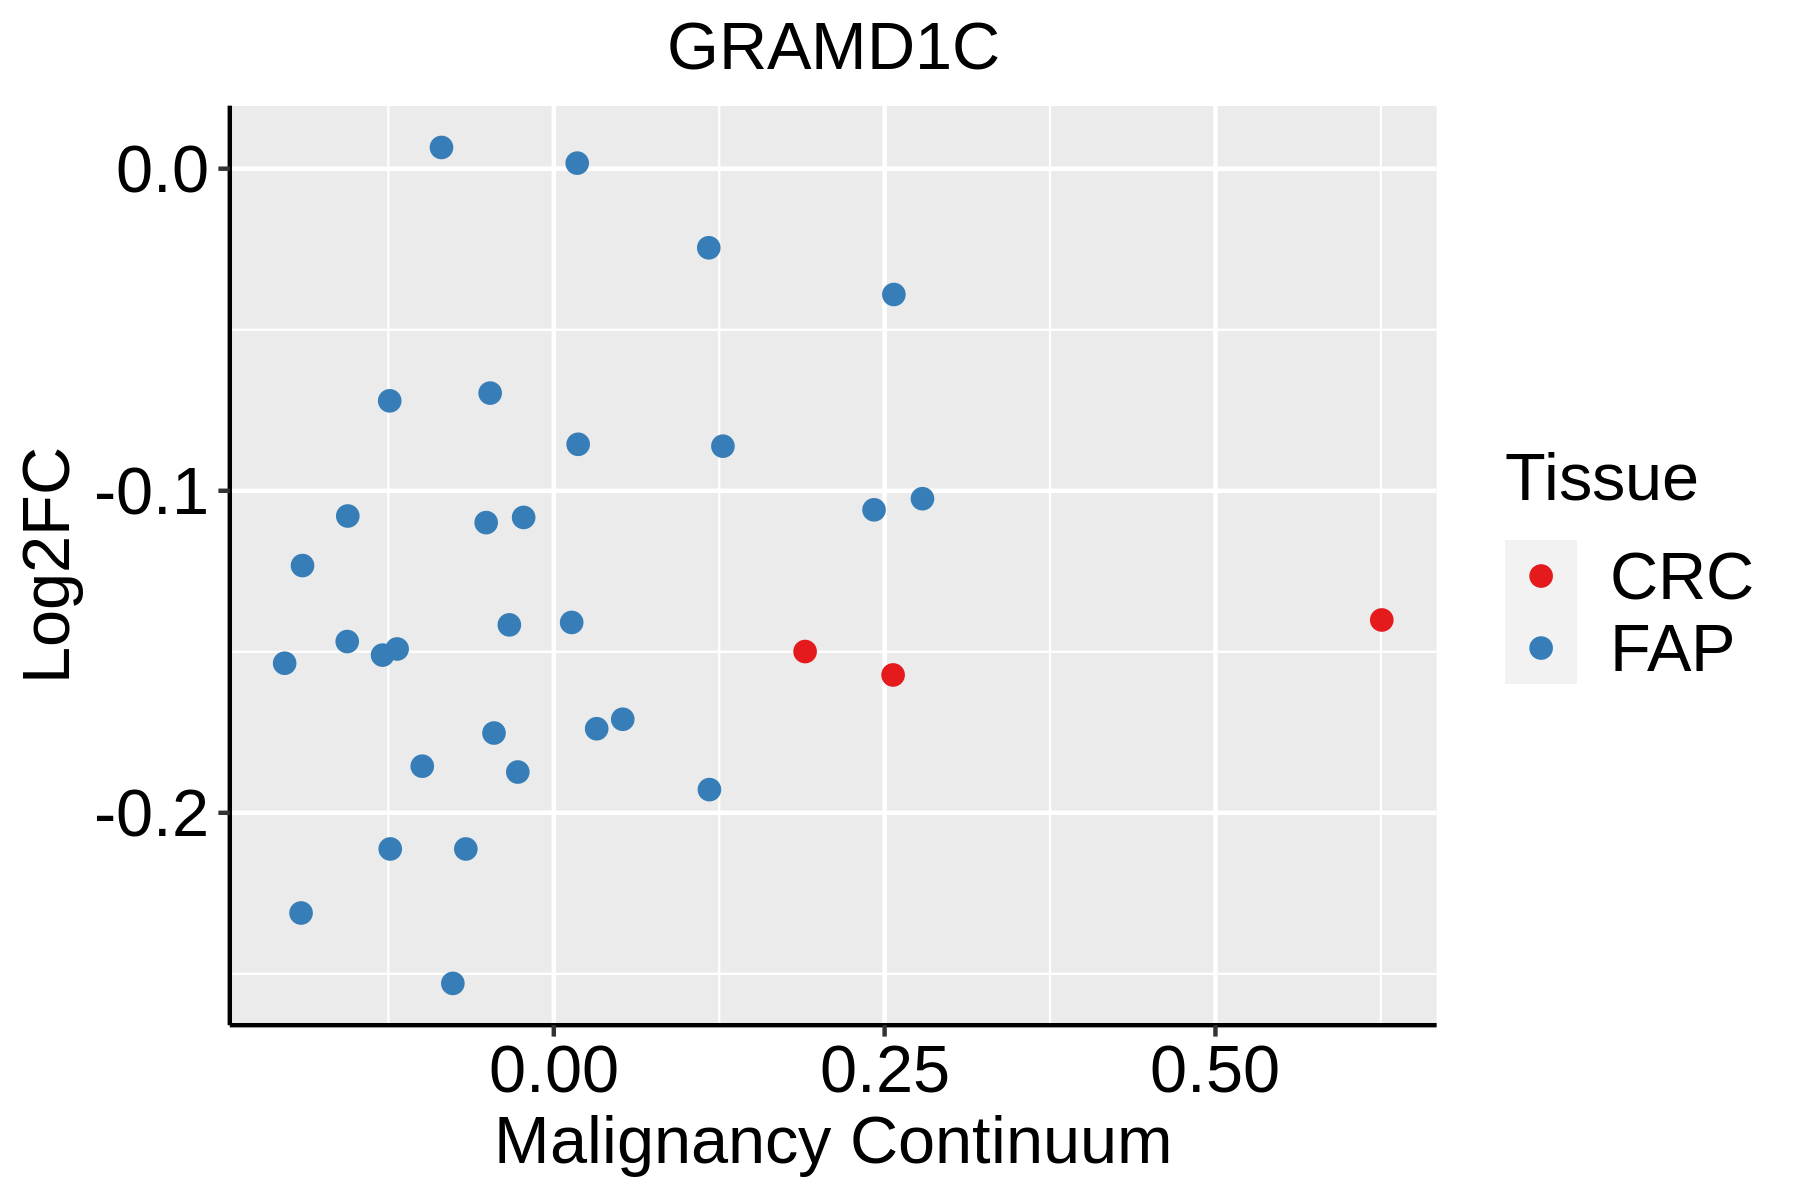 | FAP: Familial adenomatous polyposis |
| CRC: Colorectal cancer | ||
| Colorectum (HTA11) | 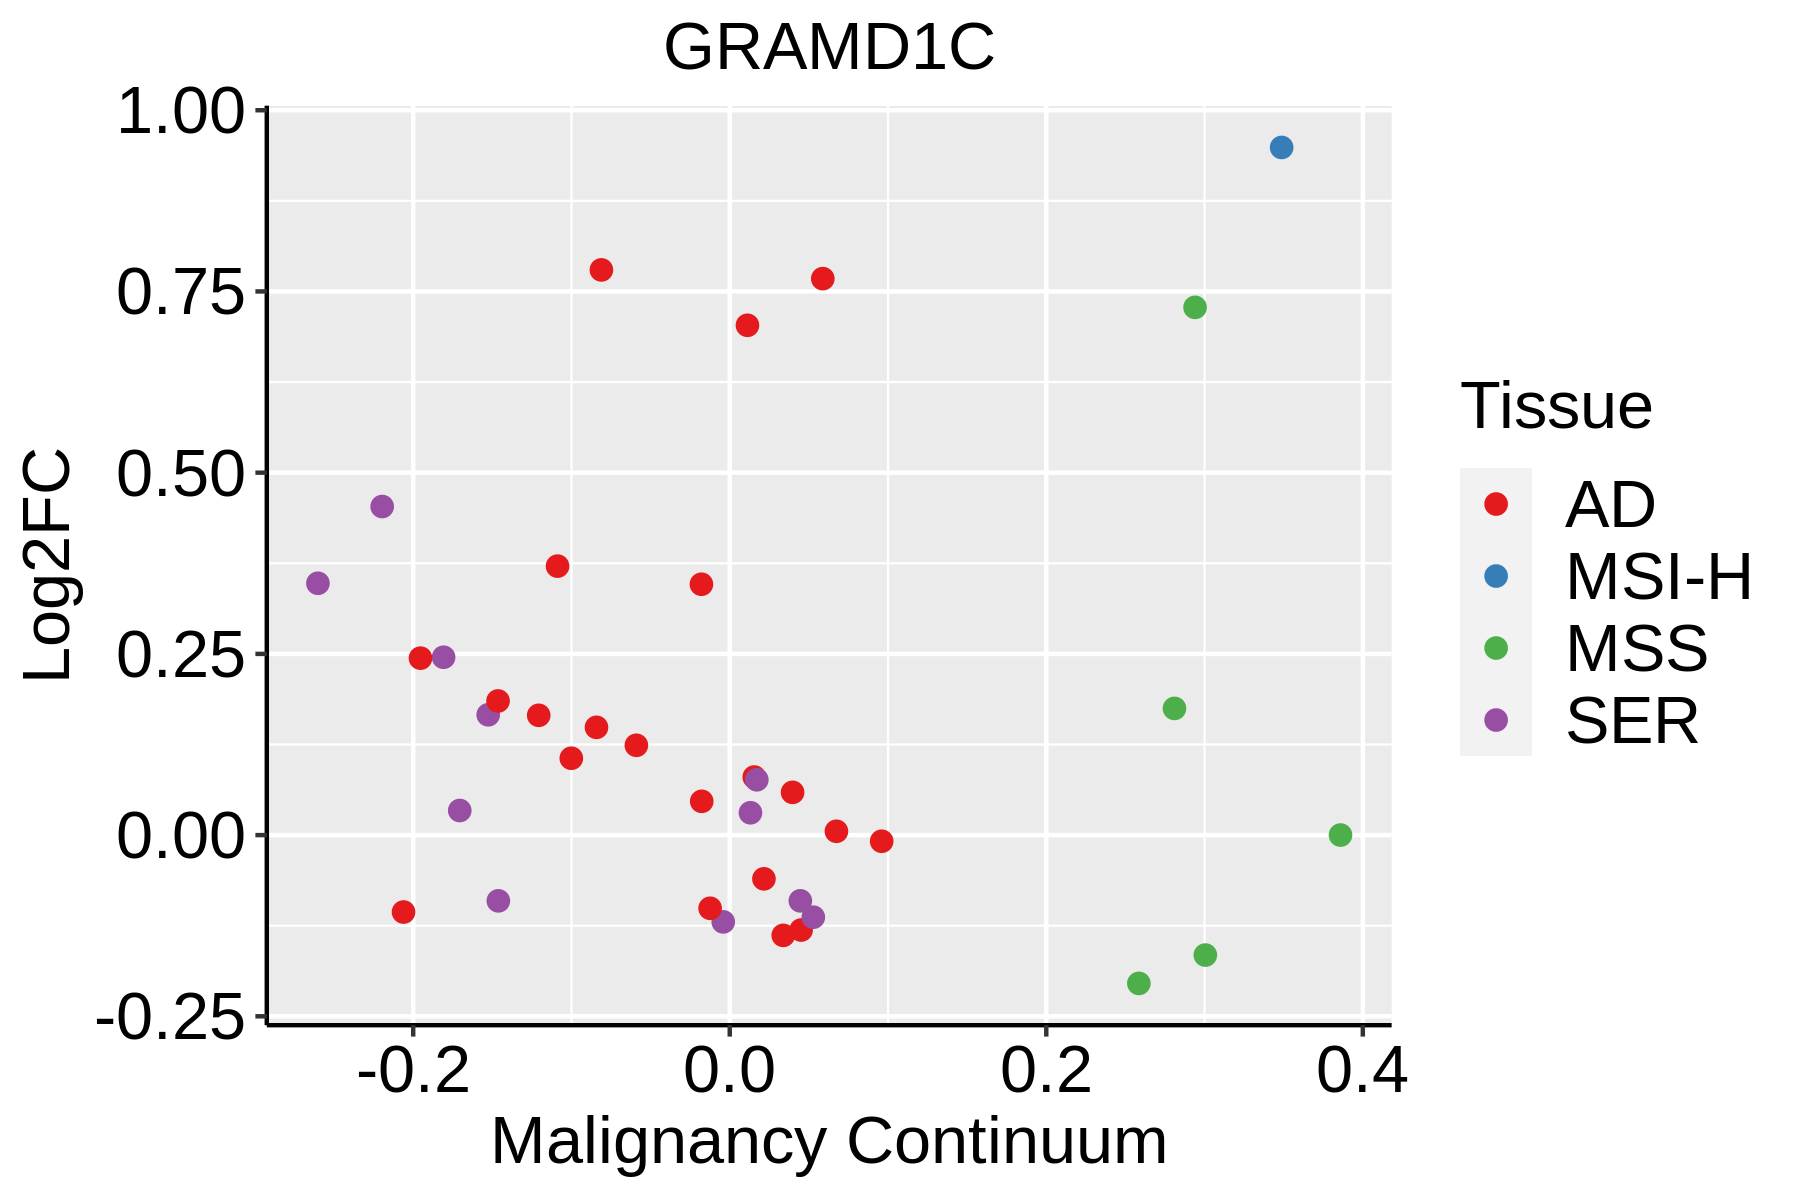 | AD: Adenomas |
| SER: Sessile serrated lesions | ||
| MSI-H: Microsatellite-high colorectal cancer | ||
| MSS: Microsatellite stable colorectal cancer |
| ∗log2FC in expression of this searched gene in stem-like cells from each diseased tissue sample relative to stem-like cells in normal samples in each tissue plotted against the malignancy continuum. Samples are colored based on if they are from different disease stage. |
Top |
Malignant transformation related pathway analysis |
| Find out the enriched GO biological processes and KEGG pathways involved in transition from healthy to precancer to cancer |
| Tissue | Disease Stage | Enriched GO biological Processes |
| Colorectum | AD |  |
| Colorectum | SER |  |
| Colorectum | MSS |  |
| Colorectum | MSI-H |  |
| Colorectum | FAP |  |
| ∗Top 15 enriched GO BP terms are showed in the bar plot of each disease state in each tissue. Each row represents a significant GO biological process which is colored according to the -log10(p.adjust). |
| Page: 1 2 3 4 5 6 7 8 9 |
| GO ID | Tissue | Disease Stage | Description | Gene Ratio | Bg Ratio | pvalue | p.adjust | Count |
| GO:0010876 | Colorectum | AD | lipid localization | 120/3918 | 448/18723 | 1.59e-03 | 1.33e-02 | 120 |
| GO:0006869 | Colorectum | AD | lipid transport | 108/3918 | 398/18723 | 1.67e-03 | 1.39e-02 | 108 |
| GO:0097305 | Colorectum | AD | response to alcohol | 71/3918 | 253/18723 | 4.01e-03 | 2.80e-02 | 71 |
| GO:00973051 | Colorectum | MSS | response to alcohol | 66/3467 | 253/18723 | 1.73e-03 | 1.54e-02 | 66 |
| GO:00108761 | Colorectum | MSS | lipid localization | 104/3467 | 448/18723 | 6.76e-03 | 4.38e-02 | 104 |
| GO:00973052 | Colorectum | MSI-H | response to alcohol | 33/1319 | 253/18723 | 4.53e-04 | 9.61e-03 | 33 |
| GO:00068691 | Colorectum | FAP | lipid transport | 81/2622 | 398/18723 | 2.84e-04 | 3.76e-03 | 81 |
| GO:00973053 | Colorectum | FAP | response to alcohol | 55/2622 | 253/18723 | 5.05e-04 | 5.78e-03 | 55 |
| GO:0097306 | Colorectum | FAP | cellular response to alcohol | 25/2622 | 93/18723 | 7.87e-04 | 8.29e-03 | 25 |
| GO:00108762 | Colorectum | FAP | lipid localization | 85/2622 | 448/18723 | 1.92e-03 | 1.63e-02 | 85 |
| Page: 1 |
| Pathway ID | Tissue | Disease Stage | Description | Gene Ratio | Bg Ratio | pvalue | p.adjust | qvalue | Count |
| Page: 1 |
Top |
Cell-cell communication analysis |
| Identification of potential cell-cell interactions between two cell types and their ligand-receptor pairs for different disease states |
| Ligand | Receptor | LRpair | Pathway | Tissue | Disease Stage |
| Page: 1 |
Top |
Single-cell gene regulatory network inference analysis |
| Find out the significant the regulons (TFs) and the target genes of each regulon across cell types for different disease states |
| TF | Cell Type | Tissue | Disease Stage | Target Gene | RSS | Regulon Activity |
| ∗The dot plots of a searched regulon are shown for all cell subpopulations in each disease state of each tissue based on the regulon specific score inferred using pySCENIC and by calculating the average expression. |
| Page: 1 |
Top |
Somatic mutation of malignant transformation related genes |
| Annotation of somatic variants for genes involved in malignant transformation |
| Hugo Symbol | Variant Class | Variant Classification | dbSNP RS | HGVSc | HGVSp | HGVSp Short | SWISSPROT | BIOTYPE | SIFT | PolyPhen | Tumor Sample Barcode | Tissue | Histology | Sex | Age | Stage | Therapy Types | Drugs | Outcome |
| GRAMD1C | SNV | Missense_Mutation | c.1811N>G | p.Ser604Cys | p.S604C | Q8IYS0 | protein_coding | tolerated(0.06) | possibly_damaging(0.818) | TCGA-AC-A23H-01 | Breast | breast invasive carcinoma | Female | >=65 | I/II | Unknown | Unknown | PD | |
| GRAMD1C | SNV | Missense_Mutation | c.433N>T | p.Ile145Phe | p.I145F | Q8IYS0 | protein_coding | deleterious(0) | probably_damaging(0.996) | TCGA-AO-A0JD-01 | Breast | breast invasive carcinoma | Female | <65 | III/IV | Chemotherapy | cyclophosphamide | SD | |
| GRAMD1C | SNV | Missense_Mutation | c.1669C>G | p.Leu557Val | p.L557V | Q8IYS0 | protein_coding | tolerated(0.09) | benign(0.01) | TCGA-B6-A0RL-01 | Breast | breast invasive carcinoma | Female | <65 | I/II | Unknown | Unknown | SD | |
| GRAMD1C | insertion | In_Frame_Ins | novel | c.115_116insGAGCTGTGGCTTGCACGTGTAATCCCAGCACTT | p.Val39delinsGlyAlaValAlaCysThrCysAsnProSerThrLeu | p.V39delinsGAVACTCNPSTL | Q8IYS0 | protein_coding | TCGA-AN-A049-01 | Breast | breast invasive carcinoma | Female | <65 | I/II | Unknown | Unknown | SD | ||
| GRAMD1C | deletion | Frame_Shift_Del | novel | c.1103delN | p.Pro369LeufsTer11 | p.P369Lfs*11 | Q8IYS0 | protein_coding | TCGA-D8-A27V-01 | Breast | breast invasive carcinoma | Female | <65 | I/II | Hormone Therapy | tamoxiphen | SD | ||
| GRAMD1C | deletion | Frame_Shift_Del | novel | c.1099delN | p.Ser367LeufsTer13 | p.S367Lfs*13 | Q8IYS0 | protein_coding | TCGA-EW-A2FV-01 | Breast | breast invasive carcinoma | Female | <65 | III/IV | Chemotherapy | docetaxel | SD | ||
| GRAMD1C | SNV | Missense_Mutation | rs755524312 | c.302G>A | p.Arg101Gln | p.R101Q | Q8IYS0 | protein_coding | deleterious(0.02) | probably_damaging(0.961) | TCGA-2W-A8YY-01 | Cervix | cervical & endocervical cancer | Female | <65 | I/II | Chemotherapy | cisplatin | CR |
| GRAMD1C | SNV | Missense_Mutation | novel | c.1559C>T | p.Ala520Val | p.A520V | Q8IYS0 | protein_coding | tolerated(0.31) | benign(0.006) | TCGA-2W-A8YY-01 | Cervix | cervical & endocervical cancer | Female | <65 | I/II | Chemotherapy | cisplatin | CR |
| GRAMD1C | SNV | Missense_Mutation | c.1811C>G | p.Ser604Cys | p.S604C | Q8IYS0 | protein_coding | tolerated(0.06) | possibly_damaging(0.818) | TCGA-EA-A3HT-01 | Cervix | cervical & endocervical cancer | Female | >=65 | I/II | Unknown | Unknown | SD | |
| GRAMD1C | SNV | Missense_Mutation | rs774536362 | c.1553N>A | p.Arg518Gln | p.R518Q | Q8IYS0 | protein_coding | deleterious(0) | probably_damaging(0.92) | TCGA-FU-A3HZ-01 | Cervix | cervical & endocervical cancer | Female | <65 | I/II | Chemotherapy | cisplatin | CR |
| Page: 1 2 3 4 5 6 7 8 9 10 |
Top |
Related drugs of malignant transformation related genes |
| Identification of chemicals and drugs interact with genes involved in malignant transfromation |
| (DGIdb 4.0) |
| Entrez ID | Symbol | Category | Interaction Types | Drug Claim Name | Drug Name | PMIDs |
| Page: 1 |

Copyright 2023-Present -The University of Texas Health Science Center at Houston |