
|
|||||
|
 | |
| |
| |
| |
| |
| |
|
Gene: GRAMD1B |
Gene summary for GRAMD1B |
| Gene information | Species | Human | Gene symbol | GRAMD1B | Gene ID | 57476 |
| Gene name | GRAM domain containing 1B | |
| Gene Alias | LINC01059 | |
| Cytomap | 11q24.1 | |
| Gene Type | protein-coding | GO ID | GO:0006810 | UniProtAcc | Q3KR37 |
Top |
Malignant transformation analysis |
| Identification of the aberrant gene expression in precancerous and cancerous lesions by comparing the gene expression of stem-like cells in diseased tissues with normal stem cells |
| Entrez ID | Symbol | Replicates | Species | Organ | Tissue | Adj P-value | Log2FC | Malignancy |
| 57476 | GRAMD1B | HCC2_Meng | Human | Liver | HCC | 1.24e-04 | 1.24e-02 | 0.0107 |
| 57476 | GRAMD1B | cirrhotic3 | Human | Liver | Cirrhotic | 2.72e-02 | 9.28e-02 | 0.0215 |
| 57476 | GRAMD1B | HCC2 | Human | Liver | HCC | 3.95e-05 | 1.30e+00 | 0.5341 |
| 57476 | GRAMD1B | S027 | Human | Liver | HCC | 1.37e-04 | 4.58e-01 | 0.2446 |
| 57476 | GRAMD1B | S028 | Human | Liver | HCC | 5.09e-11 | 5.26e-01 | 0.2503 |
| 57476 | GRAMD1B | S029 | Human | Liver | HCC | 1.23e-16 | 6.47e-01 | 0.2581 |
| Page: 1 |
| Tissue | Expression Dynamics | Abbreviation |
| Liver | 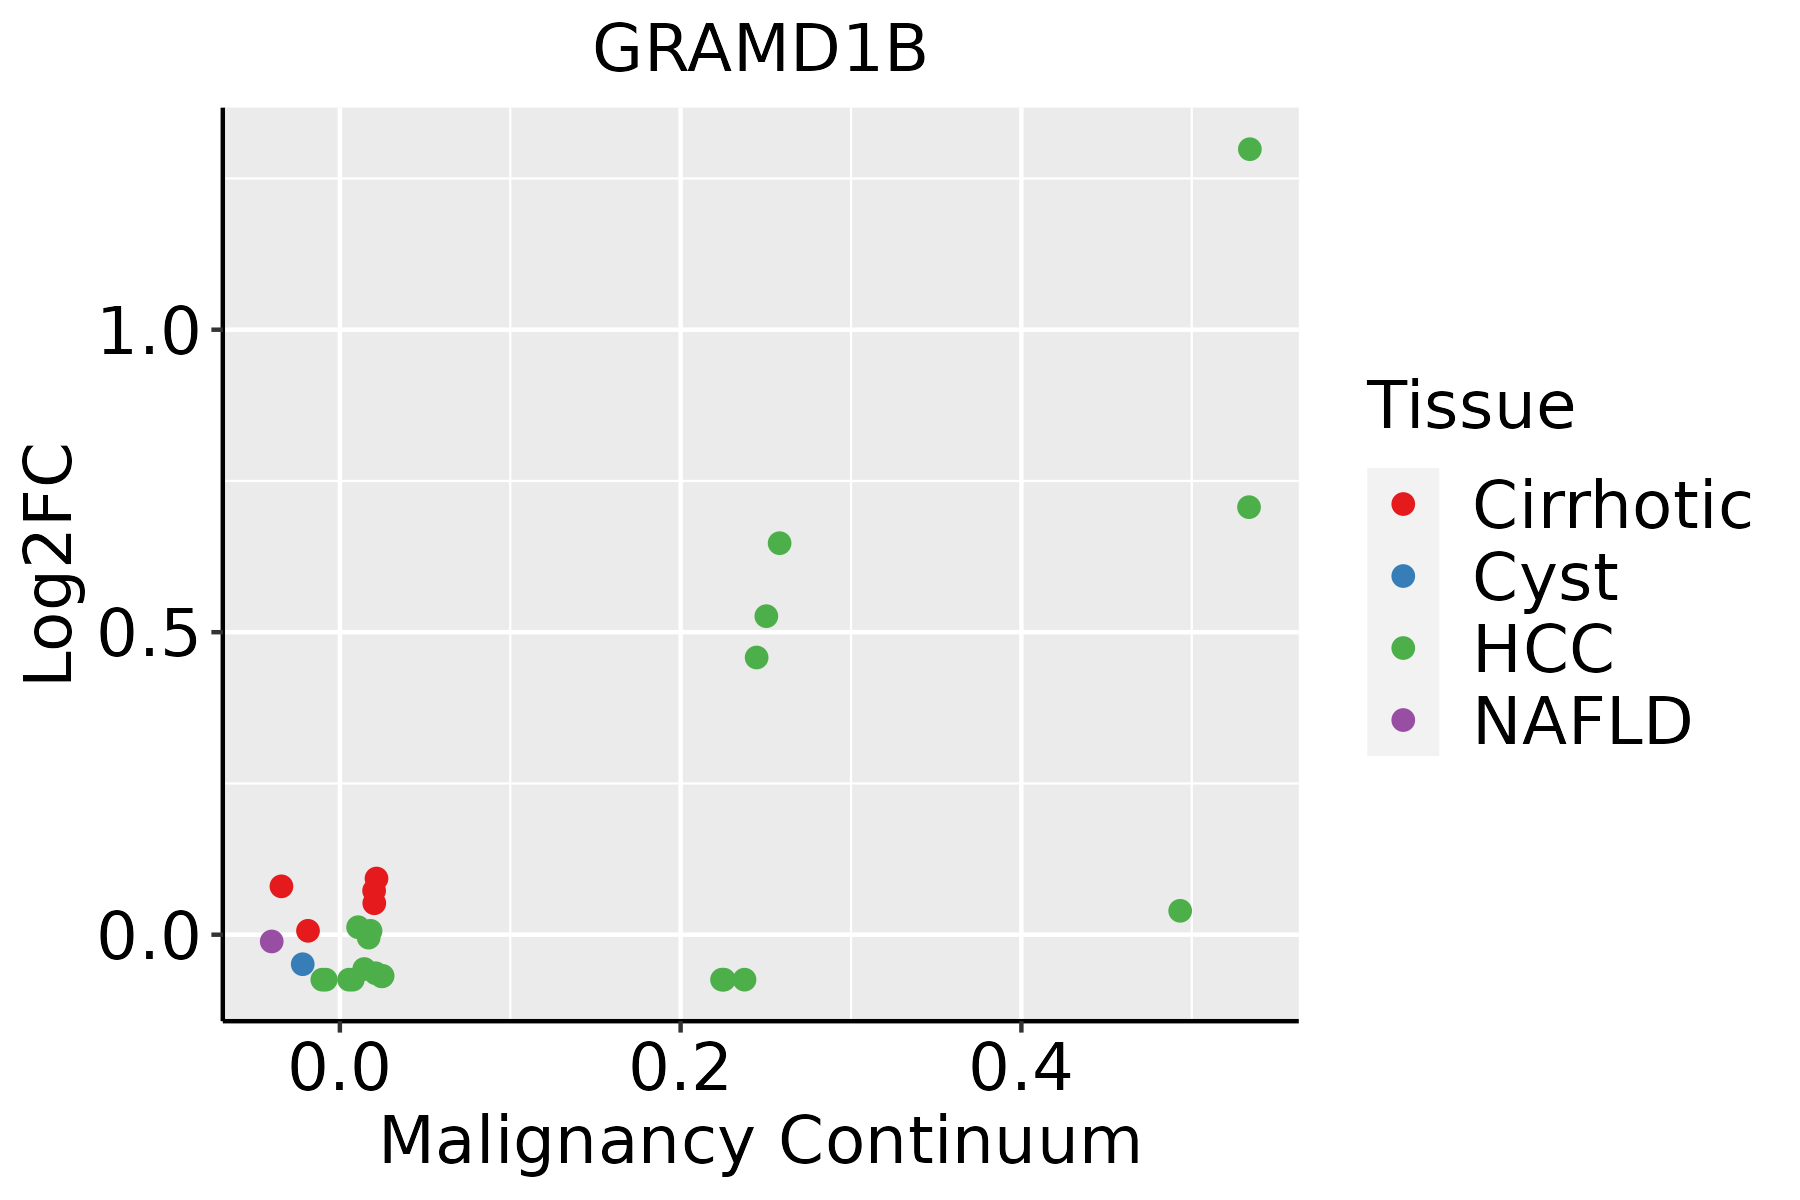 | HCC: Hepatocellular carcinoma |
| NAFLD: Non-alcoholic fatty liver disease |
| ∗log2FC in expression of this searched gene in stem-like cells from each diseased tissue sample relative to stem-like cells in normal samples in each tissue plotted against the malignancy continuum. Samples are colored based on if they are from different disease stage. |
Top |
Malignant transformation related pathway analysis |
| Find out the enriched GO biological processes and KEGG pathways involved in transition from healthy to precancer to cancer |
| Tissue | Disease Stage | Enriched GO biological Processes |
| Colorectum | AD |  |
| Colorectum | SER |  |
| Colorectum | MSS |  |
| Colorectum | MSI-H |  |
| Colorectum | FAP |  |
| ∗Top 15 enriched GO BP terms are showed in the bar plot of each disease state in each tissue. Each row represents a significant GO biological process which is colored according to the -log10(p.adjust). |
| Page: 1 2 3 4 5 6 7 8 9 |
| GO ID | Tissue | Disease Stage | Description | Gene Ratio | Bg Ratio | pvalue | p.adjust | Count |
| GO:005508811 | Liver | Cirrhotic | lipid homeostasis | 74/4634 | 167/18723 | 2.46e-08 | 8.51e-07 | 74 |
| GO:004263211 | Liver | Cirrhotic | cholesterol homeostasis | 46/4634 | 96/18723 | 7.15e-07 | 1.52e-05 | 46 |
| GO:005509211 | Liver | Cirrhotic | sterol homeostasis | 46/4634 | 97/18723 | 1.04e-06 | 2.13e-05 | 46 |
| GO:009730512 | Liver | Cirrhotic | response to alcohol | 96/4634 | 253/18723 | 1.97e-06 | 3.65e-05 | 96 |
| GO:001087611 | Liver | Cirrhotic | lipid localization | 147/4634 | 448/18723 | 6.24e-05 | 7.12e-04 | 147 |
| GO:000686911 | Liver | Cirrhotic | lipid transport | 128/4634 | 398/18723 | 4.54e-04 | 3.69e-03 | 128 |
| GO:001591811 | Liver | Cirrhotic | sterol transport | 48/4634 | 130/18723 | 1.32e-03 | 8.83e-03 | 48 |
| GO:00973061 | Liver | Cirrhotic | cellular response to alcohol | 36/4634 | 93/18723 | 1.97e-03 | 1.23e-02 | 36 |
| GO:0036314 | Liver | Cirrhotic | response to sterol | 17/4634 | 36/18723 | 2.82e-03 | 1.63e-02 | 17 |
| GO:01200091 | Liver | Cirrhotic | intermembrane lipid transfer | 21/4634 | 48/18723 | 3.06e-03 | 1.73e-02 | 21 |
| GO:00550882 | Liver | HCC | lipid homeostasis | 103/7958 | 167/18723 | 4.27e-07 | 7.18e-06 | 103 |
| GO:009730522 | Liver | HCC | response to alcohol | 138/7958 | 253/18723 | 6.91e-05 | 6.26e-04 | 138 |
| GO:001087621 | Liver | HCC | lipid localization | 228/7958 | 448/18723 | 1.80e-04 | 1.41e-03 | 228 |
| GO:005509221 | Liver | HCC | sterol homeostasis | 59/7958 | 97/18723 | 2.06e-04 | 1.58e-03 | 59 |
| GO:01200092 | Liver | HCC | intermembrane lipid transfer | 33/7958 | 48/18723 | 2.12e-04 | 1.63e-03 | 33 |
| GO:004263221 | Liver | HCC | cholesterol homeostasis | 58/7958 | 96/18723 | 2.99e-04 | 2.13e-03 | 58 |
| GO:000686921 | Liver | HCC | lipid transport | 198/7958 | 398/18723 | 1.92e-03 | 9.78e-03 | 198 |
| GO:00363141 | Liver | HCC | response to sterol | 24/7958 | 36/18723 | 2.95e-03 | 1.38e-02 | 24 |
| GO:00159182 | Liver | HCC | sterol transport | 71/7958 | 130/18723 | 3.49e-03 | 1.58e-02 | 71 |
| GO:0070723 | Liver | HCC | response to cholesterol | 20/7958 | 31/18723 | 1.11e-02 | 4.09e-02 | 20 |
| Page: 1 |
| Pathway ID | Tissue | Disease Stage | Description | Gene Ratio | Bg Ratio | pvalue | p.adjust | qvalue | Count |
| Page: 1 |
Top |
Cell-cell communication analysis |
| Identification of potential cell-cell interactions between two cell types and their ligand-receptor pairs for different disease states |
| Ligand | Receptor | LRpair | Pathway | Tissue | Disease Stage |
| Page: 1 |
Top |
Single-cell gene regulatory network inference analysis |
| Find out the significant the regulons (TFs) and the target genes of each regulon across cell types for different disease states |
| TF | Cell Type | Tissue | Disease Stage | Target Gene | RSS | Regulon Activity |
| ∗The dot plots of a searched regulon are shown for all cell subpopulations in each disease state of each tissue based on the regulon specific score inferred using pySCENIC and by calculating the average expression. |
| Page: 1 |
Top |
Somatic mutation of malignant transformation related genes |
| Annotation of somatic variants for genes involved in malignant transformation |
| Hugo Symbol | Variant Class | Variant Classification | dbSNP RS | HGVSc | HGVSp | HGVSp Short | SWISSPROT | BIOTYPE | SIFT | PolyPhen | Tumor Sample Barcode | Tissue | Histology | Sex | Age | Stage | Therapy Types | Drugs | Outcome |
| GRAMD1B | SNV | Missense_Mutation | novel | c.55N>A | p.Ala19Thr | p.A19T | Q3KR37 | protein_coding | tolerated(0.5) | benign(0.015) | TCGA-AN-A046-01 | Breast | breast invasive carcinoma | Female | >=65 | I/II | Unknown | Unknown | SD |
| GRAMD1B | SNV | Missense_Mutation | c.1550N>T | p.Gly517Val | p.G517V | Q3KR37 | protein_coding | deleterious(0.01) | probably_damaging(0.969) | TCGA-B6-A0RS-01 | Breast | breast invasive carcinoma | Female | <65 | I/II | Unknown | Unknown | PD | |
| GRAMD1B | SNV | Missense_Mutation | c.161N>A | p.Pro54Gln | p.P54Q | Q3KR37 | protein_coding | deleterious(0.02) | probably_damaging(0.995) | TCGA-BH-A18G-01 | Breast | breast invasive carcinoma | Female | >=65 | I/II | Unknown | Unknown | SD | |
| GRAMD1B | SNV | Missense_Mutation | c.181G>A | p.Val61Met | p.V61M | Q3KR37 | protein_coding | deleterious(0.05) | possibly_damaging(0.862) | TCGA-C8-A1HF-01 | Breast | breast invasive carcinoma | Female | <65 | I/II | Unknown | Unknown | SD | |
| GRAMD1B | SNV | Missense_Mutation | novel | c.1778C>T | p.Pro593Leu | p.P593L | Q3KR37 | protein_coding | tolerated(0.12) | benign(0.101) | TCGA-E2-A14U-01 | Breast | breast invasive carcinoma | Female | >=65 | I/II | Hormone Therapy | arimidex | SD |
| GRAMD1B | SNV | Missense_Mutation | rs763079105 | c.217N>A | p.Gly73Ser | p.G73S | Q3KR37 | protein_coding | tolerated(0.41) | benign(0.009) | TCGA-C5-A7CK-01 | Cervix | cervical & endocervical cancer | Female | <65 | I/II | Chemotherapy | cisplatin | SD |
| GRAMD1B | SNV | Missense_Mutation | c.1528C>T | p.Arg510Cys | p.R510C | Q3KR37 | protein_coding | tolerated(0.22) | benign(0.21) | TCGA-EA-A3HS-01 | Cervix | cervical & endocervical cancer | Female | <65 | I/II | Unknown | Unknown | SD | |
| GRAMD1B | SNV | Missense_Mutation | c.914C>T | p.Ser305Leu | p.S305L | Q3KR37 | protein_coding | tolerated(0.09) | benign(0.012) | TCGA-EK-A3GJ-01 | Cervix | cervical & endocervical cancer | Female | <65 | I/II | Unknown | Unknown | SD | |
| GRAMD1B | SNV | Missense_Mutation | c.337N>T | p.Pro113Ser | p.P113S | Q3KR37 | protein_coding | deleterious(0) | probably_damaging(0.994) | TCGA-FU-A3HZ-01 | Cervix | cervical & endocervical cancer | Female | <65 | I/II | Chemotherapy | cisplatin | CR | |
| GRAMD1B | SNV | Missense_Mutation | rs369825461 | c.1634C>T | p.Thr545Met | p.T545M | Q3KR37 | protein_coding | tolerated(0.17) | benign(0.007) | TCGA-IR-A3LL-01 | Cervix | cervical & endocervical cancer | Female | <65 | I/II | Chemotherapy | cisplatin | CR |
| Page: 1 2 3 4 5 6 7 8 9 10 11 12 13 |
Top |
Related drugs of malignant transformation related genes |
| Identification of chemicals and drugs interact with genes involved in malignant transfromation |
| (DGIdb 4.0) |
| Entrez ID | Symbol | Category | Interaction Types | Drug Claim Name | Drug Name | PMIDs |
| 57476 | GRAMD1B | TRANSPORTER | lithium | LITHIUM | 29121268 |
| Page: 1 |

Copyright 2023-Present -The University of Texas Health Science Center at Houston |