
|
|||||
|
 | |
| |
| |
| |
| |
| |
|
Gene: GPX4 |
Gene summary for GPX4 |
| Gene information | Species | Human | Gene symbol | GPX4 | Gene ID | 2879 |
| Gene name | glutathione peroxidase 4 | |
| Gene Alias | GPx-4 | |
| Cytomap | 19p13.3 | |
| Gene Type | protein-coding | GO ID | GO:0000003 | UniProtAcc | P36969 |
Top |
Malignant transformation analysis |
| Identification of the aberrant gene expression in precancerous and cancerous lesions by comparing the gene expression of stem-like cells in diseased tissues with normal stem cells |
| Entrez ID | Symbol | Replicates | Species | Organ | Tissue | Adj P-value | Log2FC | Malignancy |
| 2879 | GPX4 | GSM4909277 | Human | Breast | Precancer | 3.64e-05 | -7.27e-01 | 0.0177 |
| 2879 | GPX4 | GSM4909280 | Human | Breast | Precancer | 3.30e-05 | -6.53e-01 | 0.0305 |
| 2879 | GPX4 | GSM4909282 | Human | Breast | IDC | 6.03e-28 | -6.26e-01 | -0.0288 |
| 2879 | GPX4 | GSM4909285 | Human | Breast | IDC | 1.79e-19 | -3.04e-01 | 0.21 |
| 2879 | GPX4 | GSM4909286 | Human | Breast | IDC | 2.40e-09 | -1.97e-01 | 0.1081 |
| 2879 | GPX4 | GSM4909290 | Human | Breast | IDC | 1.60e-02 | 2.46e-01 | 0.2096 |
| 2879 | GPX4 | GSM4909293 | Human | Breast | IDC | 6.45e-08 | -1.63e-01 | 0.1581 |
| 2879 | GPX4 | GSM4909294 | Human | Breast | IDC | 4.04e-25 | 2.58e-01 | 0.2022 |
| 2879 | GPX4 | GSM4909296 | Human | Breast | IDC | 3.09e-13 | 6.02e-02 | 0.1524 |
| 2879 | GPX4 | GSM4909297 | Human | Breast | IDC | 2.43e-24 | -2.49e-01 | 0.1517 |
| 2879 | GPX4 | GSM4909301 | Human | Breast | IDC | 1.15e-03 | 1.53e-01 | 0.1577 |
| 2879 | GPX4 | GSM4909304 | Human | Breast | IDC | 2.78e-36 | 4.34e-01 | 0.1636 |
| 2879 | GPX4 | GSM4909306 | Human | Breast | IDC | 1.34e-21 | 3.64e-01 | 0.1564 |
| 2879 | GPX4 | GSM4909307 | Human | Breast | IDC | 5.02e-06 | 2.15e-01 | 0.1569 |
| 2879 | GPX4 | GSM4909308 | Human | Breast | IDC | 2.31e-07 | 3.06e-01 | 0.158 |
| 2879 | GPX4 | GSM4909309 | Human | Breast | IDC | 1.60e-04 | -5.18e-02 | 0.0483 |
| 2879 | GPX4 | GSM4909311 | Human | Breast | IDC | 6.72e-49 | -2.35e-01 | 0.1534 |
| 2879 | GPX4 | GSM4909312 | Human | Breast | IDC | 2.30e-06 | -1.59e-01 | 0.1552 |
| 2879 | GPX4 | GSM4909313 | Human | Breast | IDC | 2.94e-04 | 5.51e-02 | 0.0391 |
| 2879 | GPX4 | GSM4909315 | Human | Breast | IDC | 4.86e-11 | 2.44e-01 | 0.21 |
| Page: 1 2 3 4 5 6 7 8 9 10 11 12 13 14 15 16 17 |
| Tissue | Expression Dynamics | Abbreviation |
| Breast | 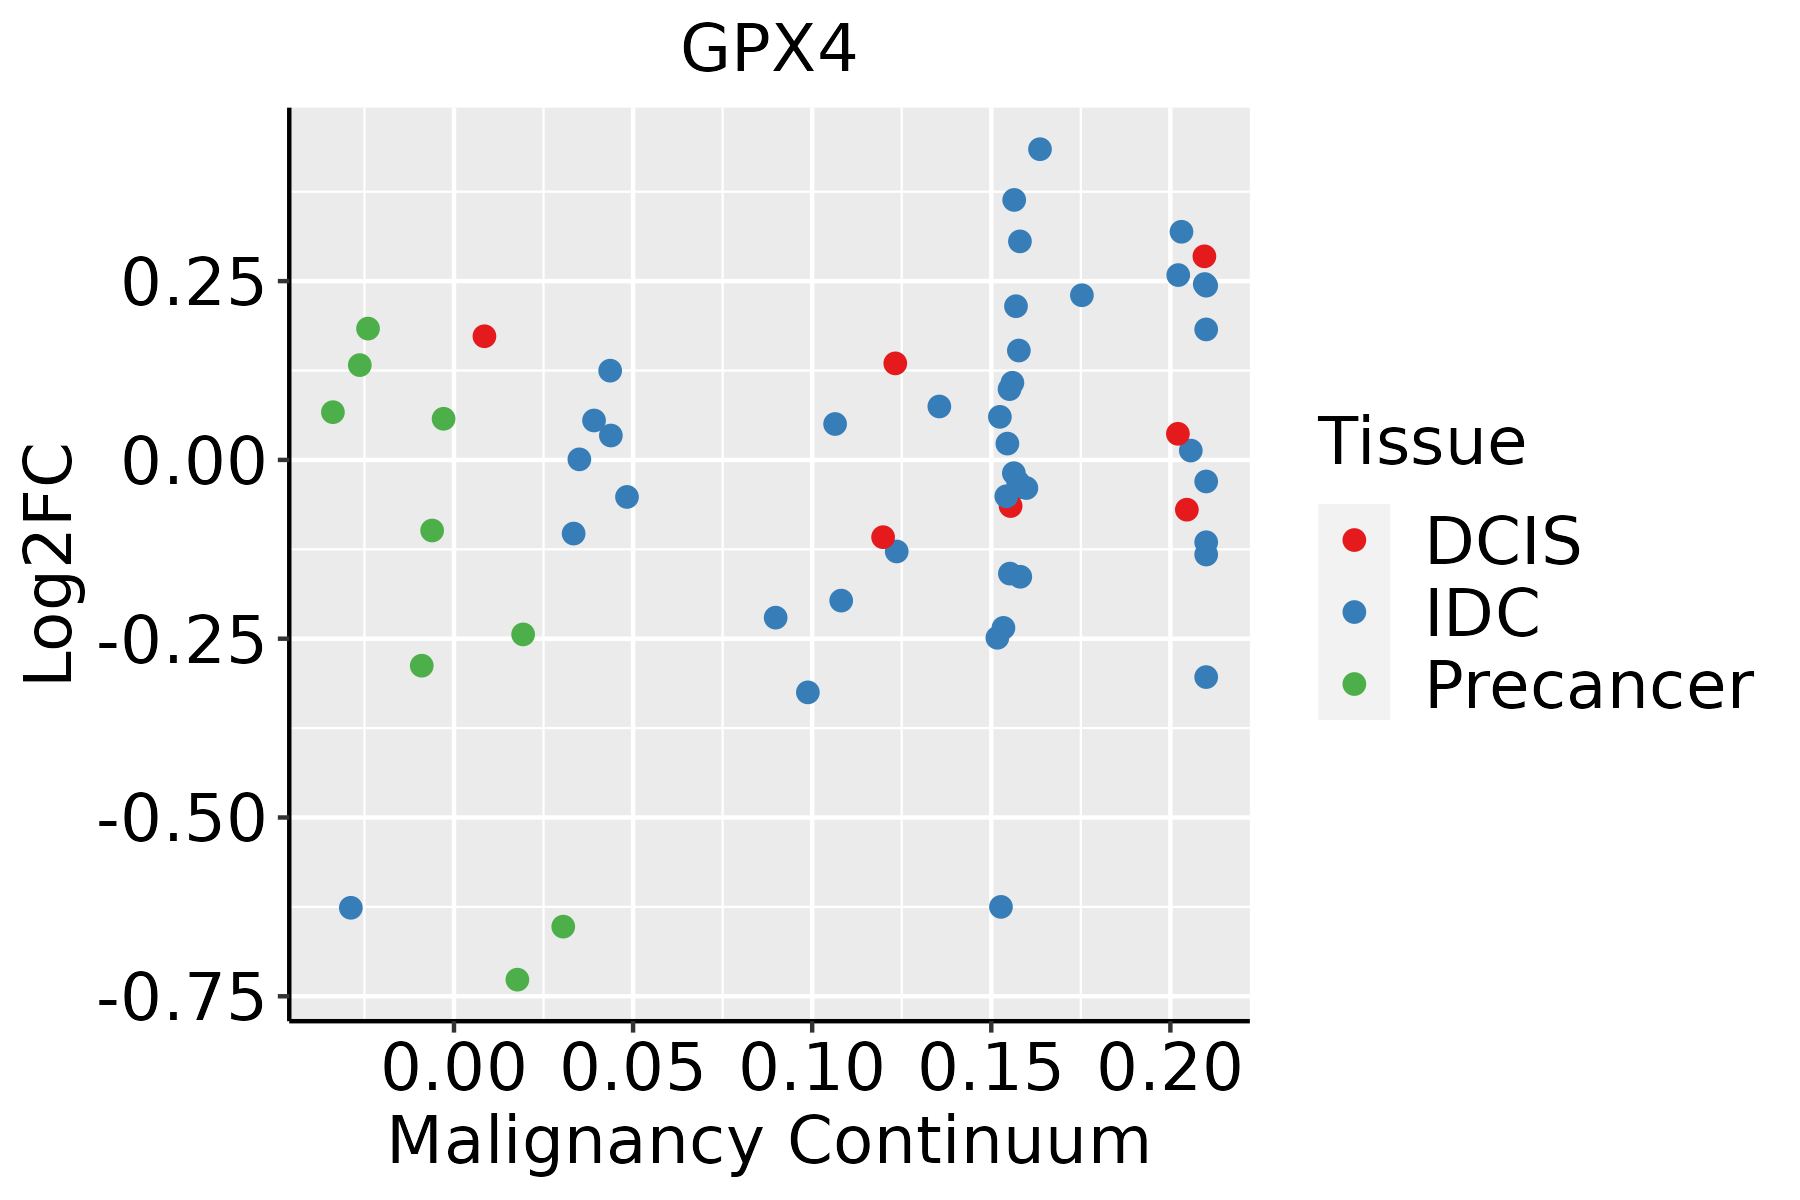 | IDC: Invasive ductal carcinoma |
| DCIS: Ductal carcinoma in situ | ||
| Precancer(BRCA1-mut): Precancerous lesion from BRCA1 mutation carriers | ||
| Cervix |  | CC: Cervix cancer |
| HSIL_HPV: HPV-infected high-grade squamous intraepithelial lesions | ||
| N_HPV: HPV-infected normal cervix | ||
| Colorectum (GSE201348) |  | FAP: Familial adenomatous polyposis |
| CRC: Colorectal cancer | ||
| Colorectum (HTA11) |  | AD: Adenomas |
| SER: Sessile serrated lesions | ||
| MSI-H: Microsatellite-high colorectal cancer | ||
| MSS: Microsatellite stable colorectal cancer | ||
| Endometrium | 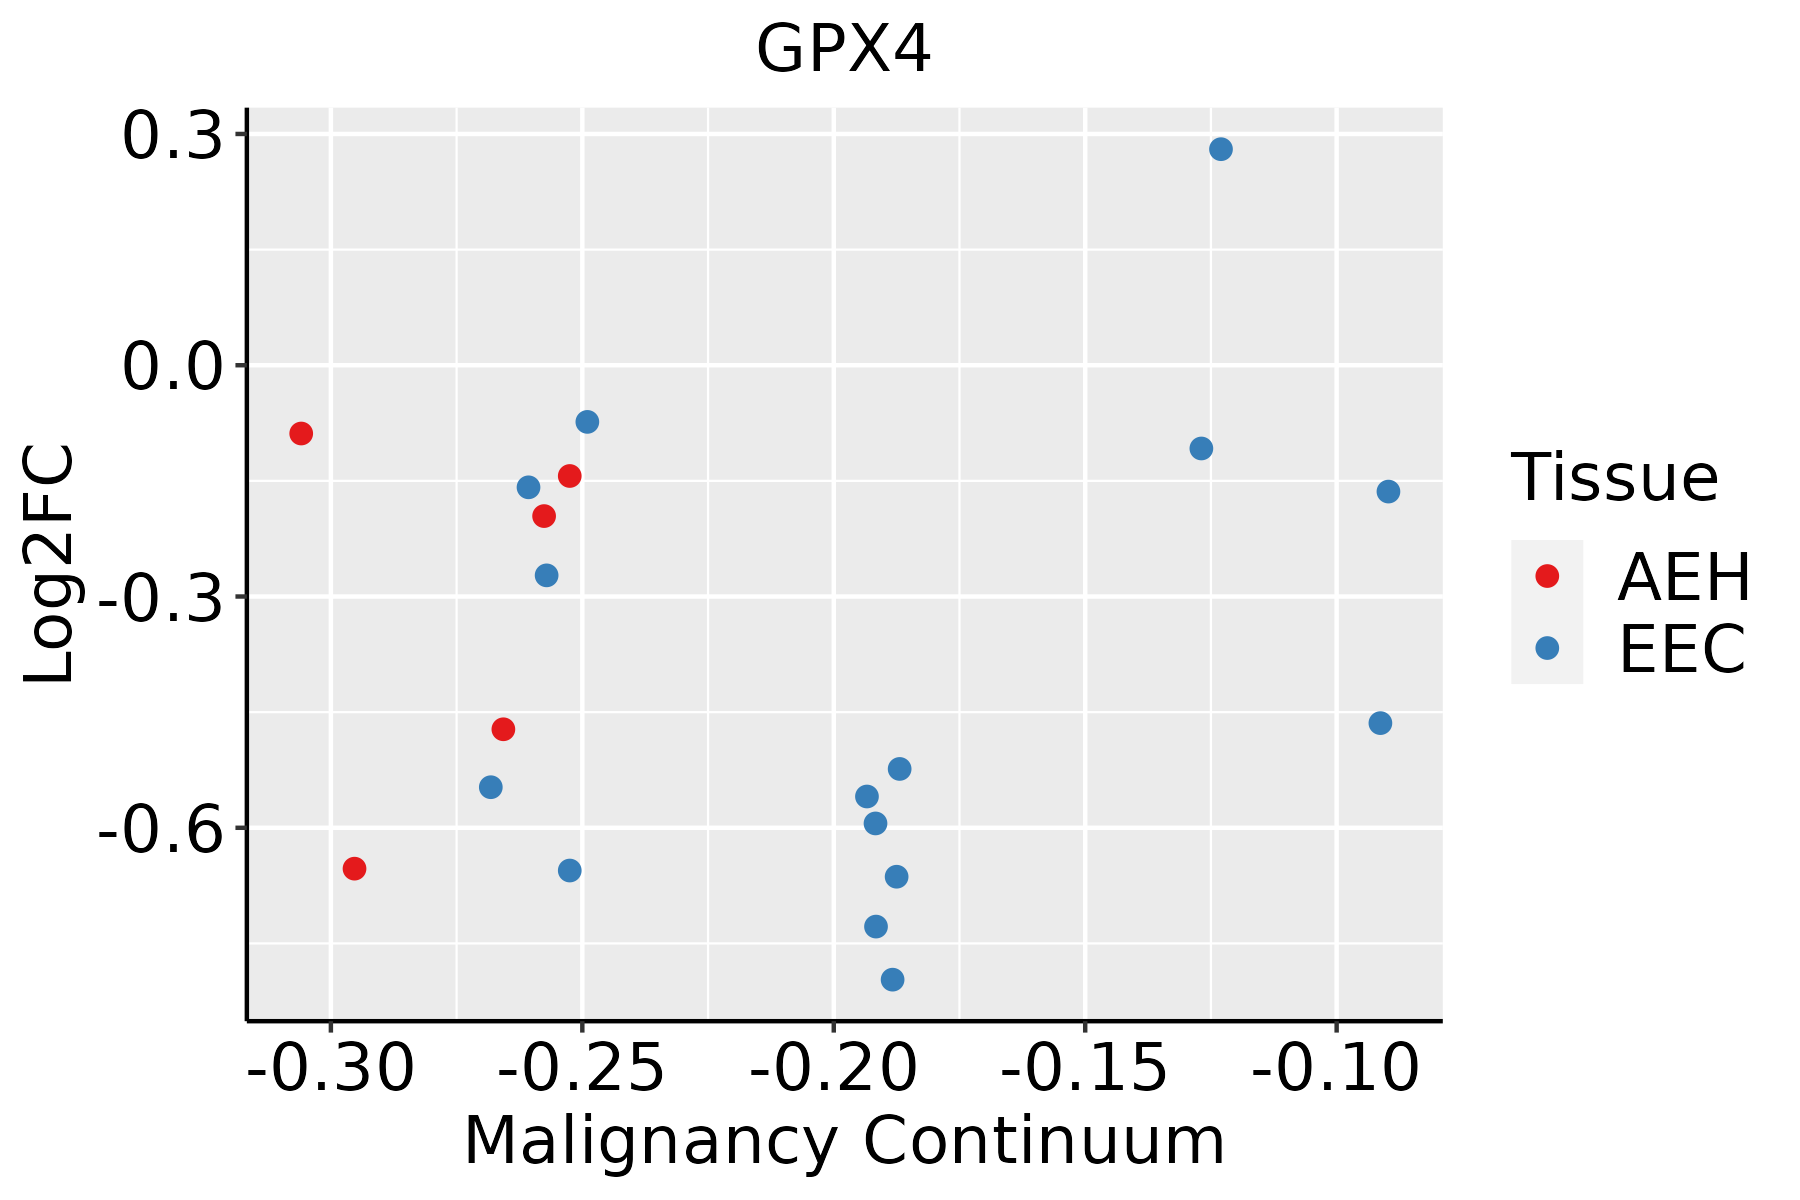 | AEH: Atypical endometrial hyperplasia |
| EEC: Endometrioid Cancer | ||
| Esophagus | 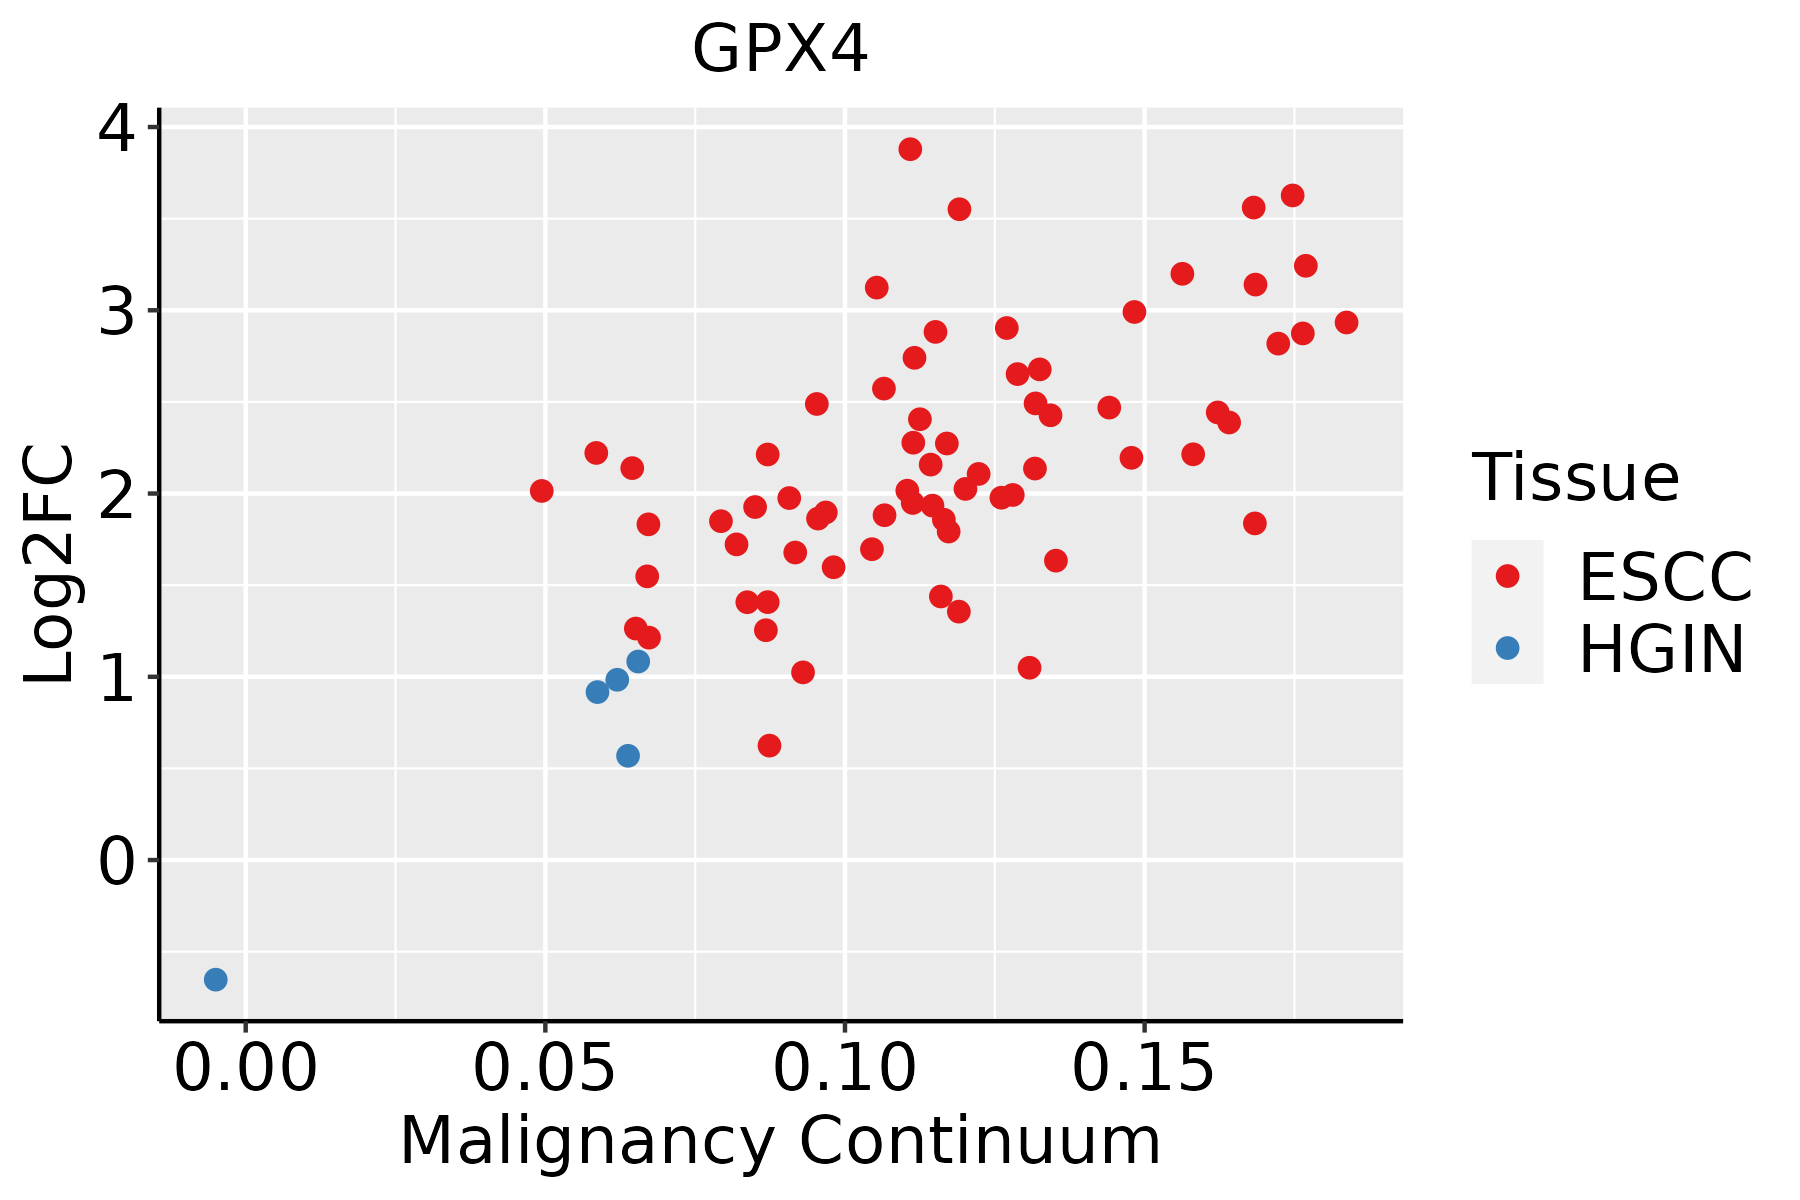 | ESCC: Esophageal squamous cell carcinoma |
| HGIN: High-grade intraepithelial neoplasias | ||
| LGIN: Low-grade intraepithelial neoplasias | ||
| GC |  | CAG: Chronic atrophic gastritis |
| CAG with IM: Chronic atrophic gastritis with intestinal metaplasia | ||
| CSG: Chronic superficial gastritis | ||
| GC: Gastric cancer | ||
| SIM: Severe intestinal metaplasia | ||
| WIM: Wild intestinal metaplasia | ||
| Liver |  | HCC: Hepatocellular carcinoma |
| NAFLD: Non-alcoholic fatty liver disease | ||
| Lung | 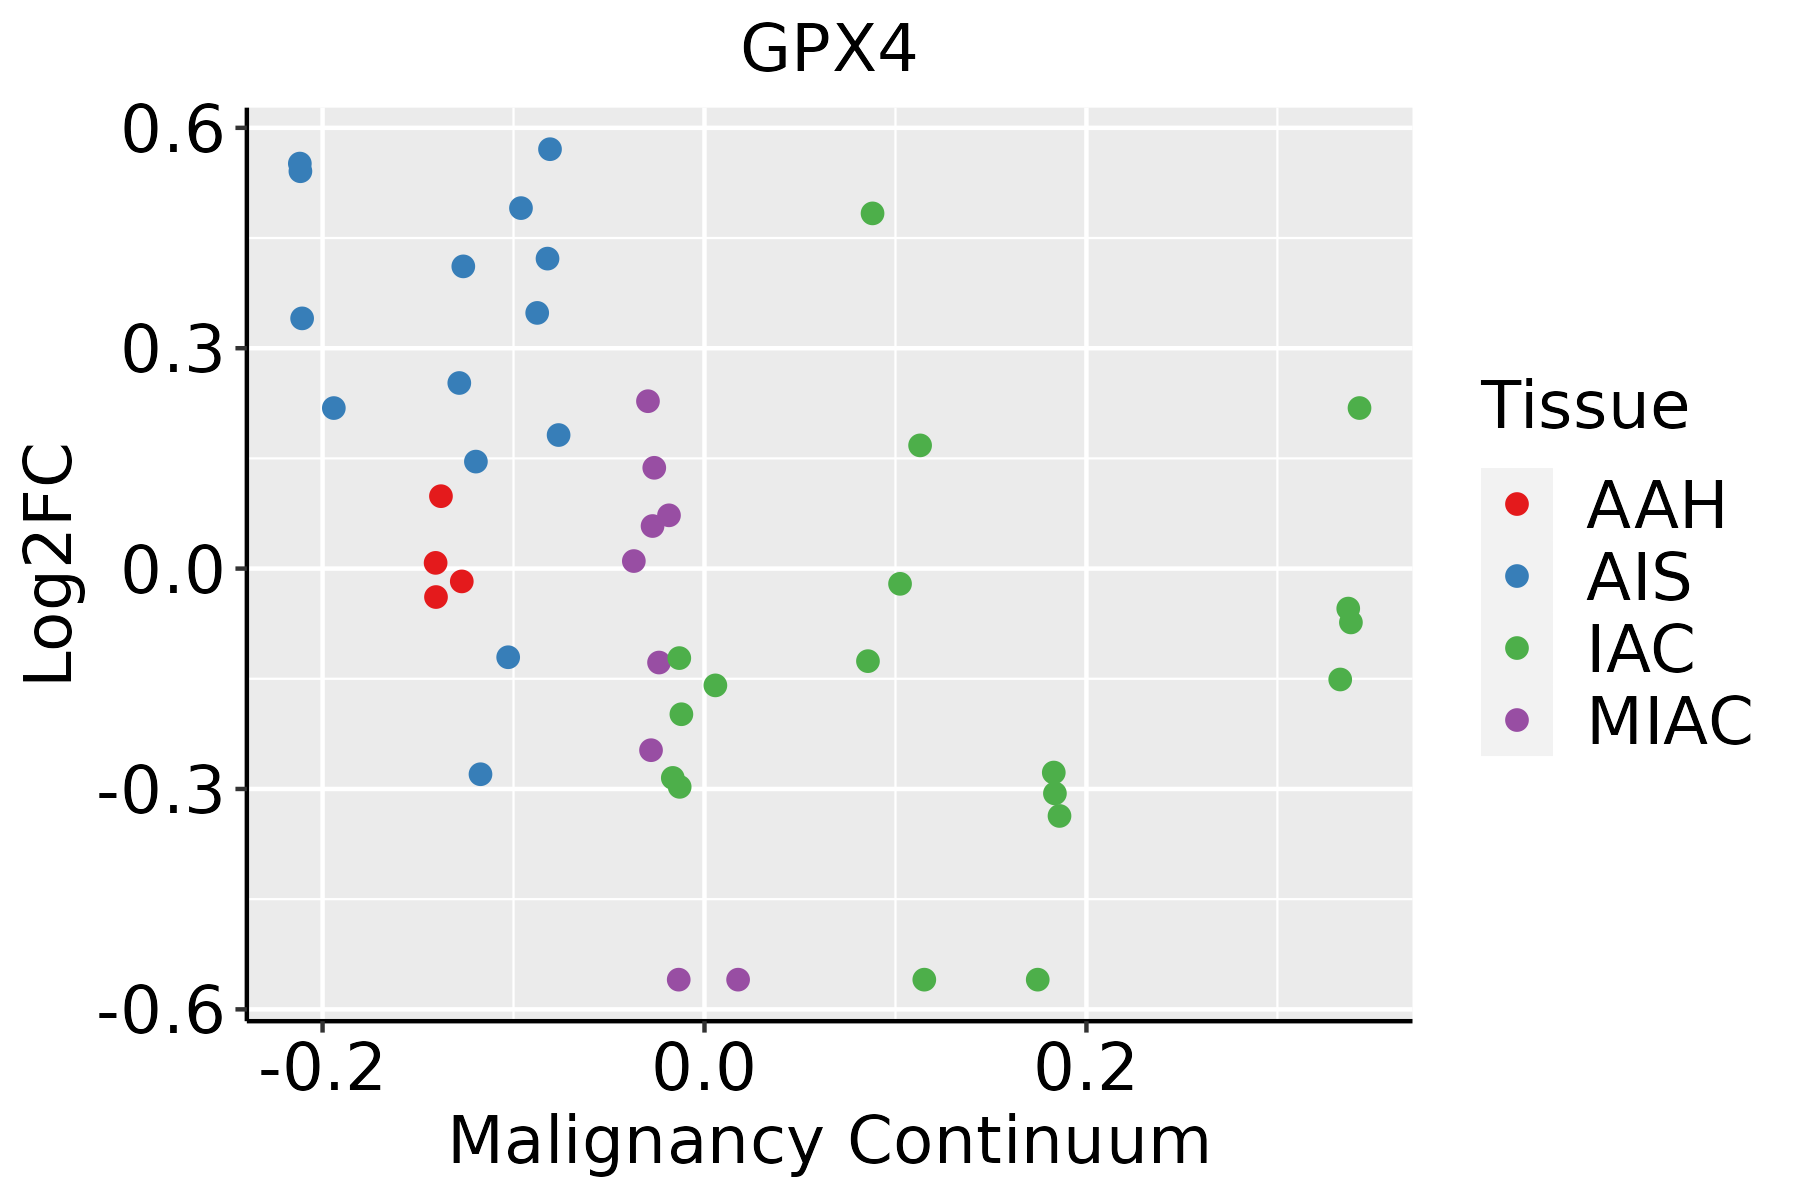 | AAH: Atypical adenomatous hyperplasia |
| AIS: Adenocarcinoma in situ | ||
| IAC: Invasive lung adenocarcinoma | ||
| MIA: Minimally invasive adenocarcinoma | ||
| Oral Cavity | 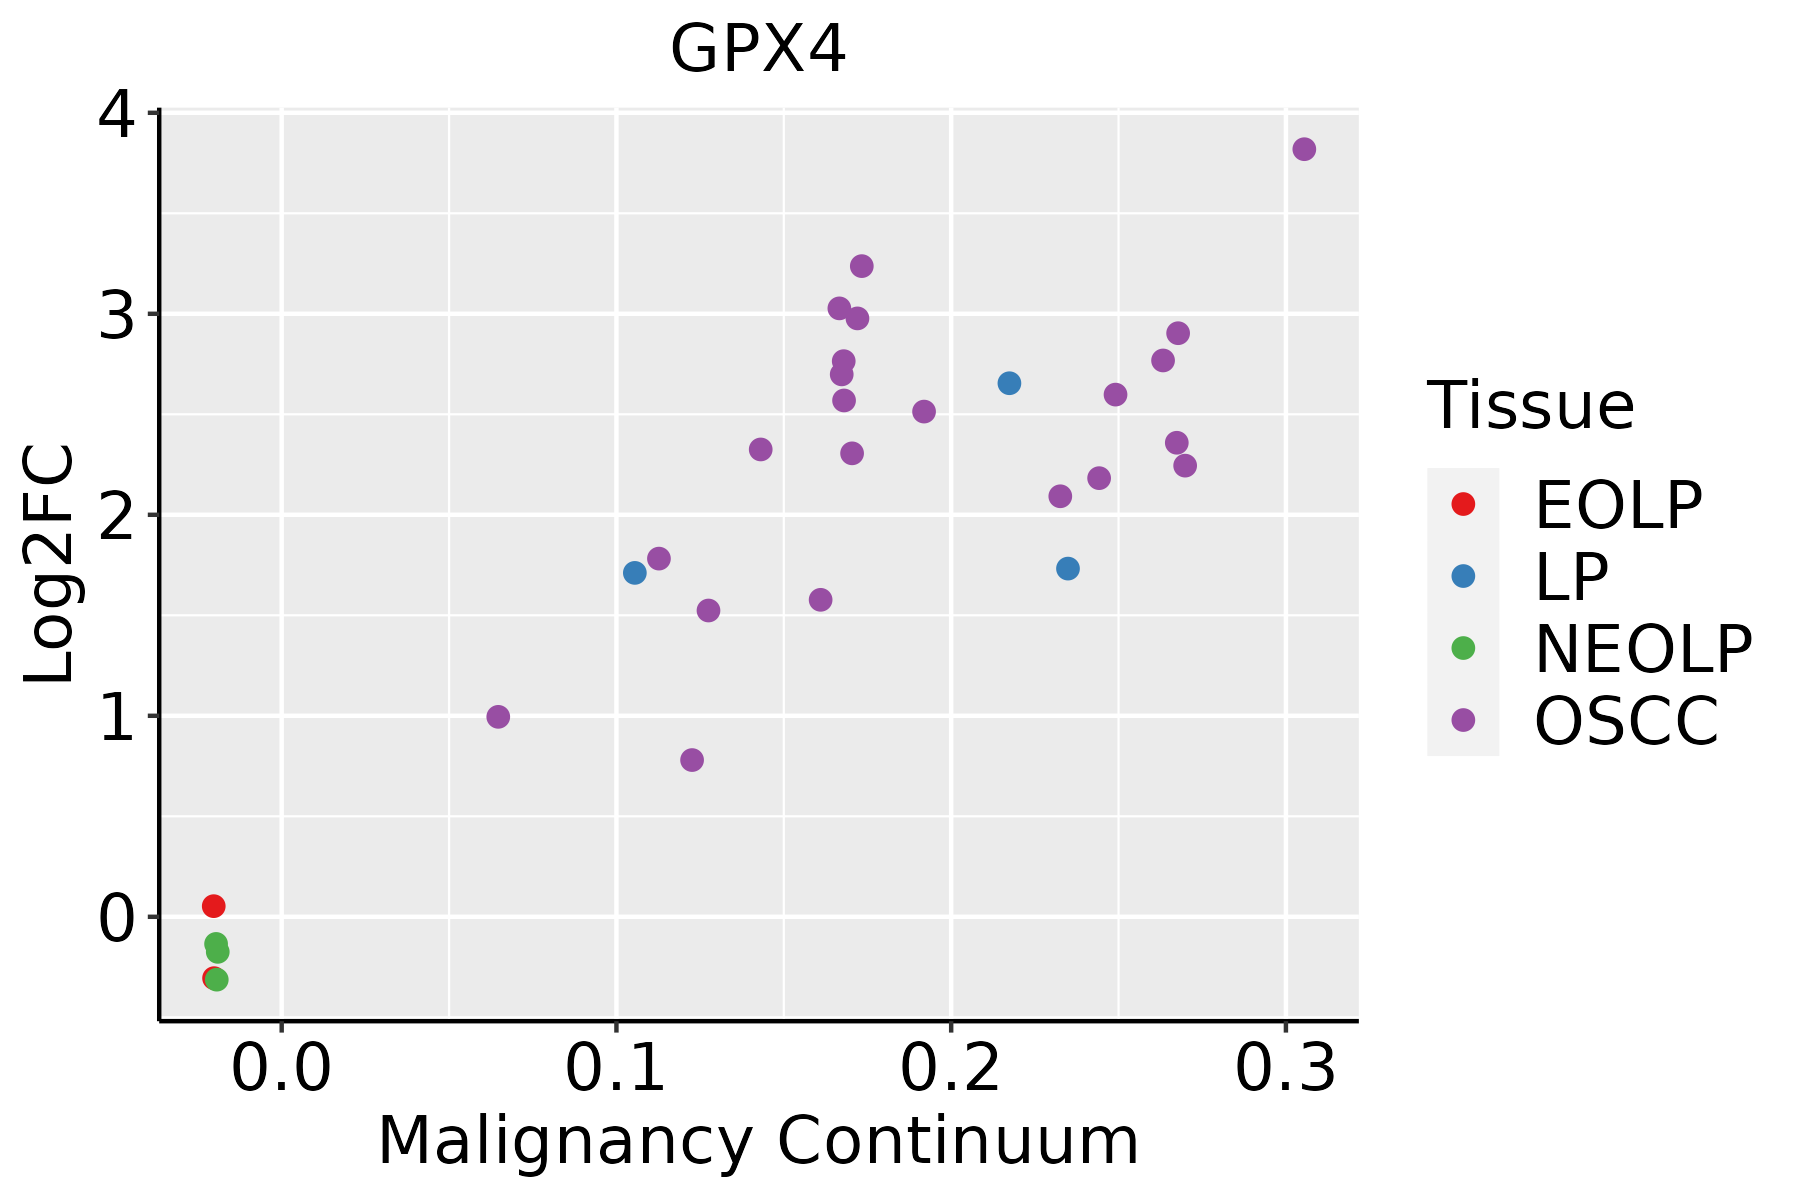 | EOLP: Erosive Oral lichen planus |
| LP: leukoplakia | ||
| NEOLP: Non-erosive oral lichen planus | ||
| OSCC: Oral squamous cell carcinoma | ||
| Prostate | 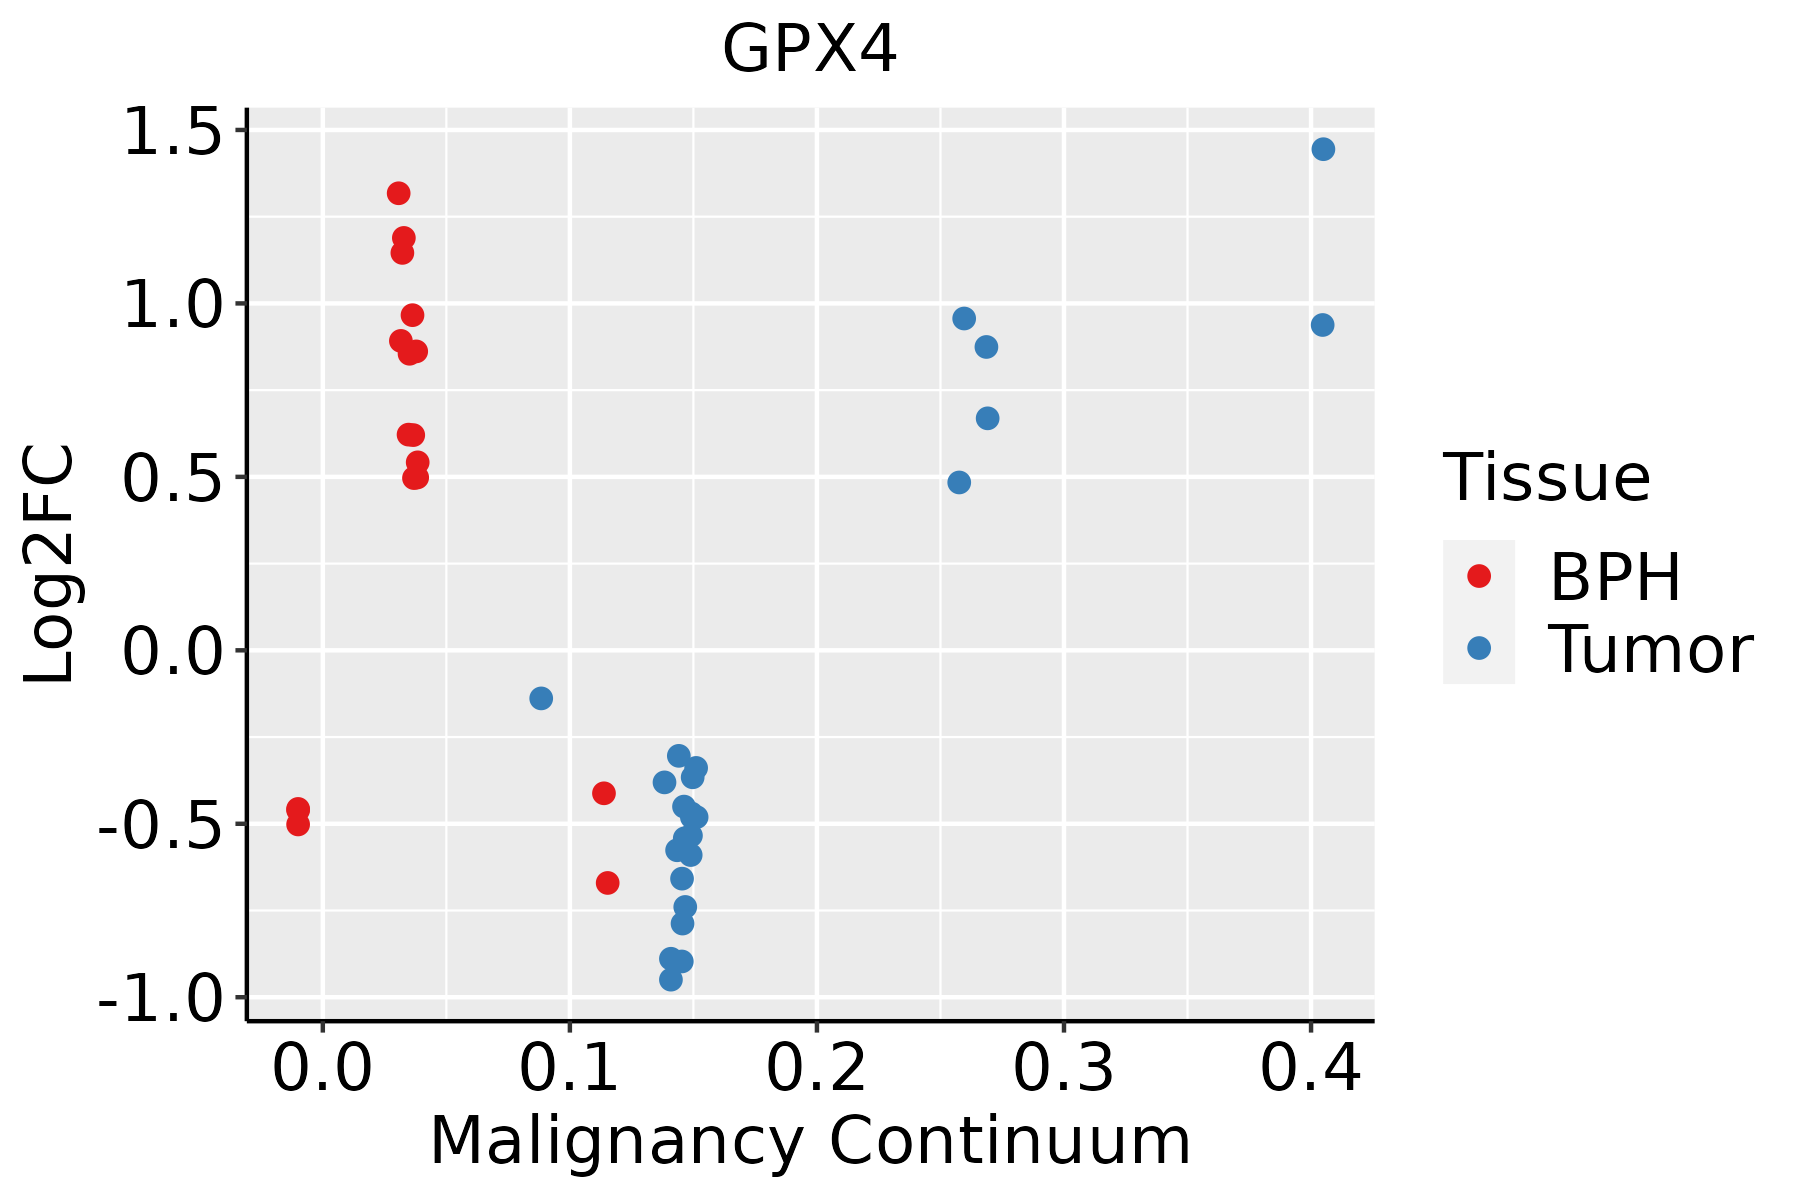 | BPH: Benign Prostatic Hyperplasia |
| Skin | 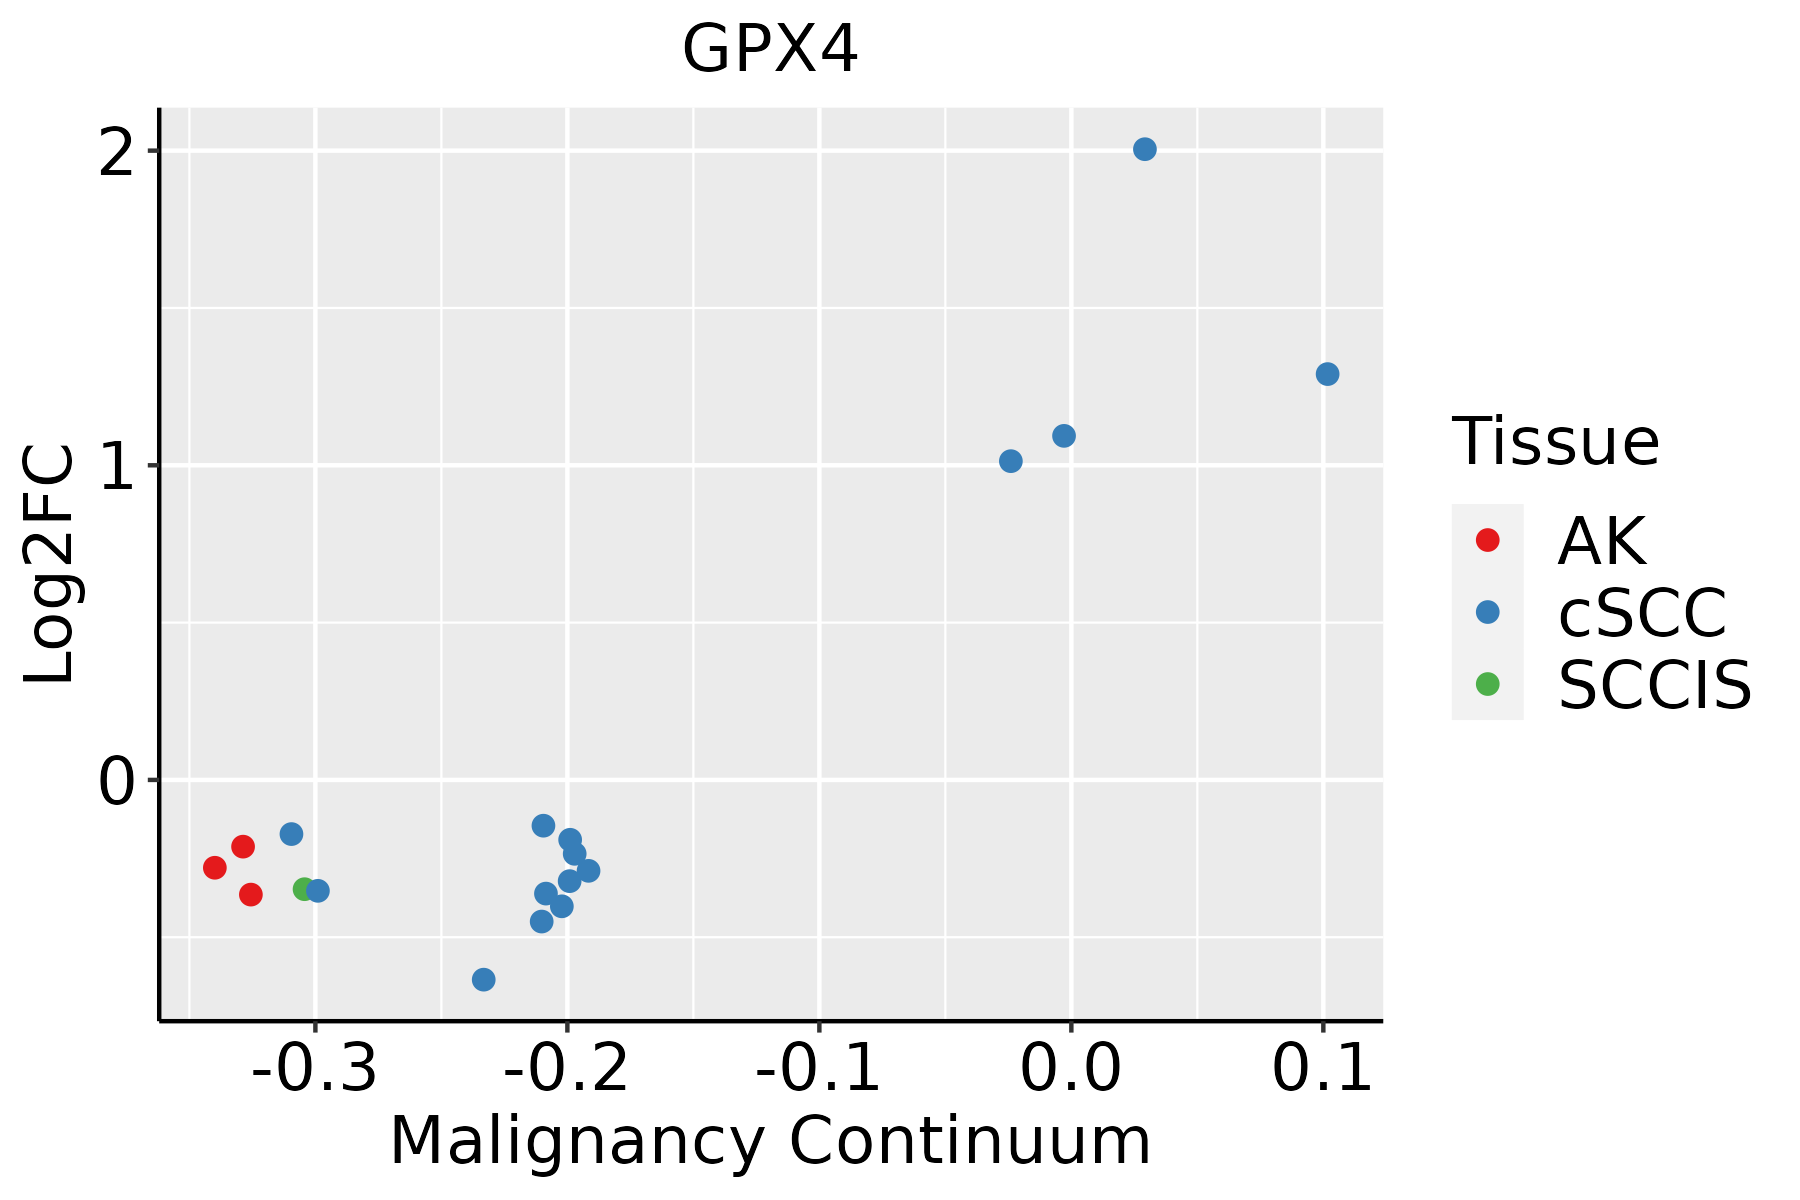 | AK: Actinic keratosis |
| cSCC: Cutaneous squamous cell carcinoma | ||
| SCCIS:squamous cell carcinoma in situ | ||
| Thyroid | 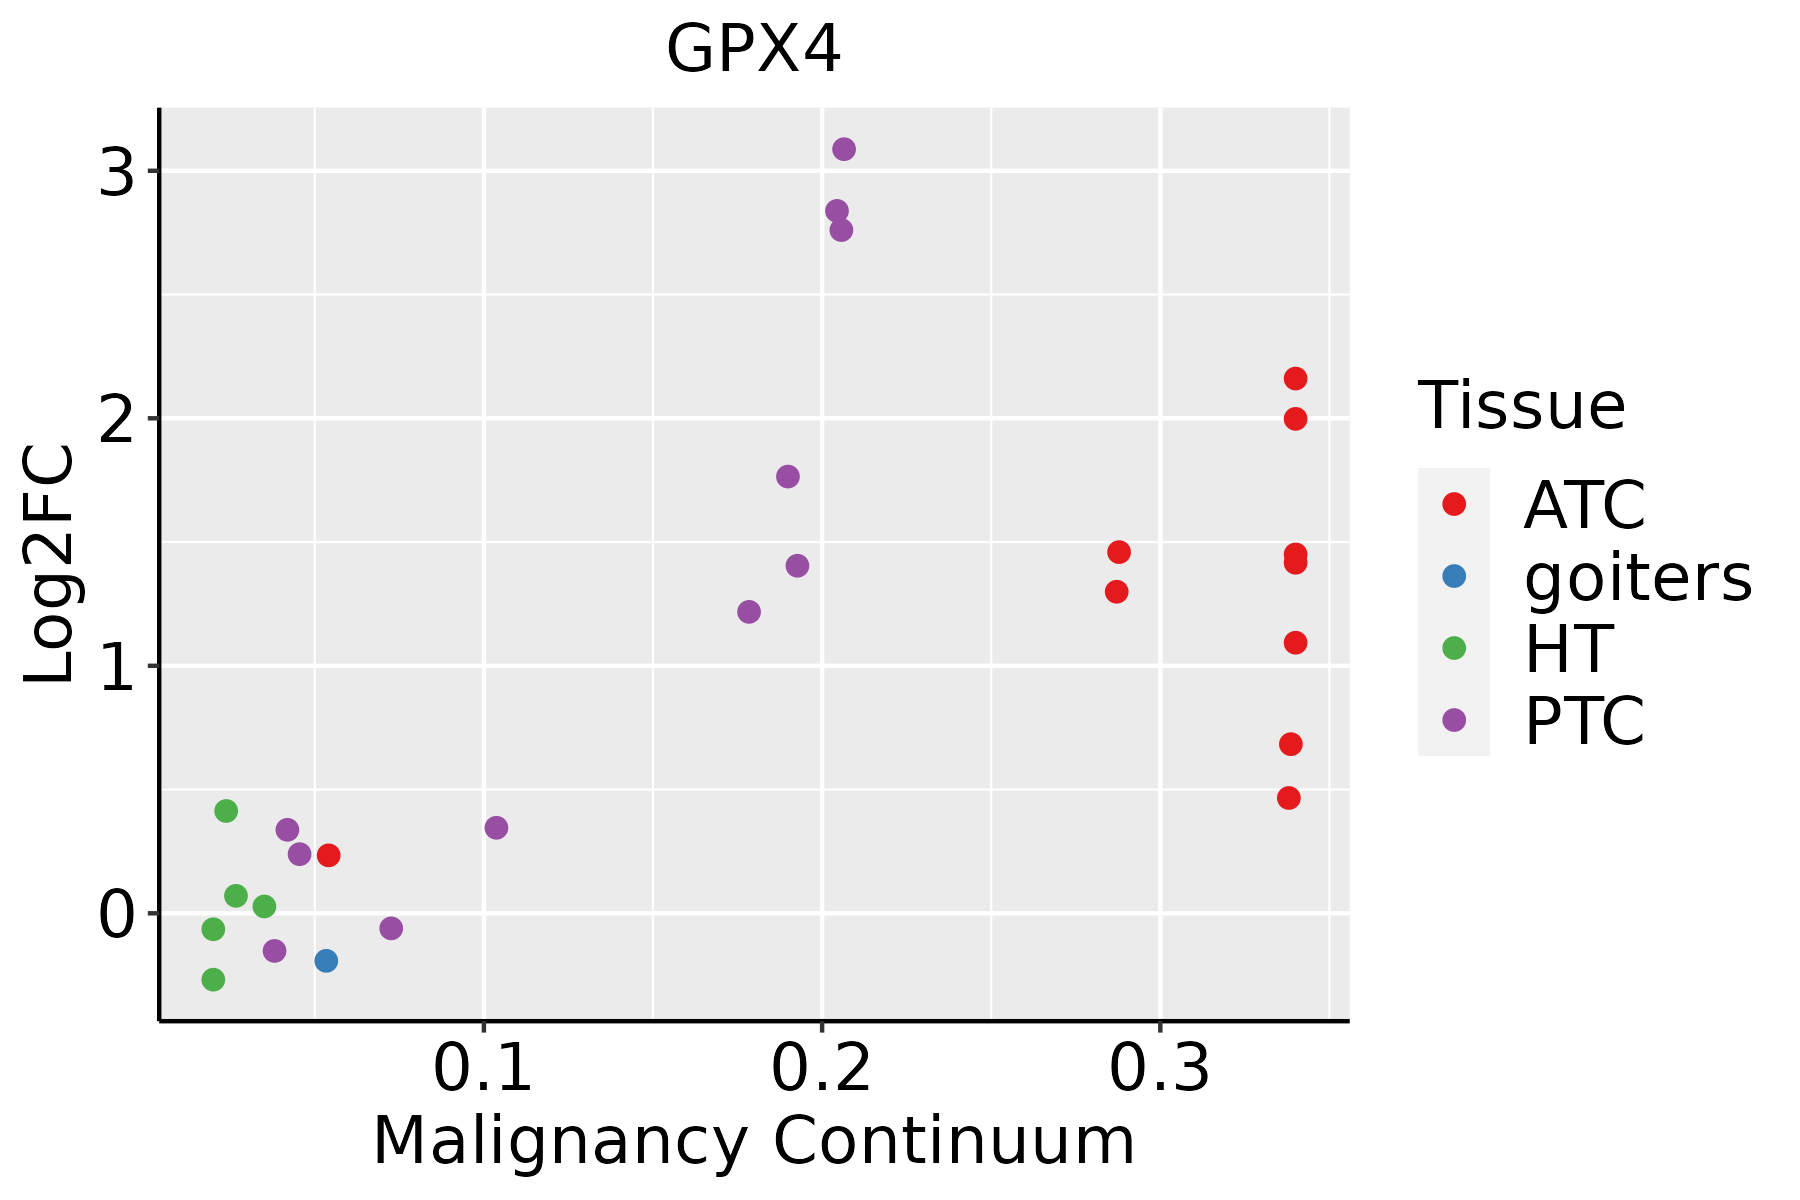 | ATC: Anaplastic thyroid cancer |
| HT: Hashimoto's thyroiditis | ||
| PTC: Papillary thyroid cancer |
| ∗log2FC in expression of this searched gene in stem-like cells from each diseased tissue sample relative to stem-like cells in normal samples in each tissue plotted against the malignancy continuum. Samples are colored based on if they are from different disease stage. |
Top |
Malignant transformation related pathway analysis |
| Find out the enriched GO biological processes and KEGG pathways involved in transition from healthy to precancer to cancer |
| Tissue | Disease Stage | Enriched GO biological Processes |
| Colorectum | AD |  |
| Colorectum | SER |  |
| Colorectum | MSS |  |
| Colorectum | MSI-H |  |
| Colorectum | FAP |  |
| ∗Top 15 enriched GO BP terms are showed in the bar plot of each disease state in each tissue. Each row represents a significant GO biological process which is colored according to the -log10(p.adjust). |
| Page: 1 2 3 4 5 6 7 8 9 |
| GO ID | Tissue | Disease Stage | Description | Gene Ratio | Bg Ratio | pvalue | p.adjust | Count |
| GO:00069799 | Breast | Precancer | response to oxidative stress | 70/1080 | 446/18723 | 1.59e-14 | 4.26e-12 | 70 |
| GO:00988698 | Breast | Precancer | cellular oxidant detoxification | 20/1080 | 101/18723 | 1.07e-06 | 4.18e-05 | 20 |
| GO:19907488 | Breast | Precancer | cellular detoxification | 21/1080 | 116/18723 | 2.67e-06 | 8.89e-05 | 21 |
| GO:00075688 | Breast | Precancer | aging | 41/1080 | 339/18723 | 5.95e-06 | 1.71e-04 | 41 |
| GO:00987548 | Breast | Precancer | detoxification | 24/1080 | 152/18723 | 6.49e-06 | 1.81e-04 | 24 |
| GO:00972378 | Breast | Precancer | cellular response to toxic substance | 21/1080 | 124/18723 | 7.98e-06 | 2.17e-04 | 21 |
| GO:0050727 | Breast | Precancer | regulation of inflammatory response | 44/1080 | 386/18723 | 1.26e-05 | 3.22e-04 | 44 |
| GO:00096368 | Breast | Precancer | response to toxic substance | 31/1080 | 262/18723 | 1.18e-04 | 2.12e-03 | 31 |
| GO:00323555 | Breast | Precancer | response to estradiol | 19/1080 | 141/18723 | 4.81e-04 | 6.31e-03 | 19 |
| GO:00463946 | Breast | Precancer | carboxylic acid biosynthetic process | 32/1080 | 314/18723 | 1.30e-03 | 1.38e-02 | 32 |
| GO:00723304 | Breast | Precancer | monocarboxylic acid biosynthetic process | 24/1080 | 214/18723 | 1.41e-03 | 1.48e-02 | 24 |
| GO:00160536 | Breast | Precancer | organic acid biosynthetic process | 32/1080 | 316/18723 | 1.44e-03 | 1.50e-02 | 32 |
| GO:00066335 | Breast | Precancer | fatty acid biosynthetic process | 19/1080 | 163/18723 | 2.74e-03 | 2.42e-02 | 19 |
| GO:000697914 | Breast | IDC | response to oxidative stress | 83/1434 | 446/18723 | 2.36e-14 | 7.06e-12 | 83 |
| GO:000963613 | Breast | IDC | response to toxic substance | 44/1434 | 262/18723 | 6.33e-07 | 3.00e-05 | 44 |
| GO:000756813 | Breast | IDC | aging | 52/1434 | 339/18723 | 1.14e-06 | 5.10e-05 | 52 |
| GO:009875413 | Breast | IDC | detoxification | 29/1434 | 152/18723 | 3.97e-06 | 1.43e-04 | 29 |
| GO:009886913 | Breast | IDC | cellular oxidant detoxification | 22/1434 | 101/18723 | 6.31e-06 | 1.98e-04 | 22 |
| GO:003235512 | Breast | IDC | response to estradiol | 27/1434 | 141/18723 | 7.87e-06 | 2.35e-04 | 27 |
| GO:199074813 | Breast | IDC | cellular detoxification | 23/1434 | 116/18723 | 2.02e-05 | 4.92e-04 | 23 |
| Page: 1 2 3 4 5 6 7 8 9 10 11 12 13 14 15 16 17 18 19 20 21 |
| Pathway ID | Tissue | Disease Stage | Description | Gene Ratio | Bg Ratio | pvalue | p.adjust | qvalue | Count |
| hsa0421623 | Breast | IDC | Ferroptosis | 12/867 | 41/8465 | 5.87e-04 | 4.89e-03 | 3.66e-03 | 12 |
| hsa0048023 | Breast | IDC | Glutathione metabolism | 13/867 | 57/8465 | 4.25e-03 | 2.56e-02 | 1.91e-02 | 13 |
| hsa0421633 | Breast | IDC | Ferroptosis | 12/867 | 41/8465 | 5.87e-04 | 4.89e-03 | 3.66e-03 | 12 |
| hsa0048033 | Breast | IDC | Glutathione metabolism | 13/867 | 57/8465 | 4.25e-03 | 2.56e-02 | 1.91e-02 | 13 |
| hsa0421642 | Breast | DCIS | Ferroptosis | 12/846 | 41/8465 | 4.69e-04 | 3.69e-03 | 2.72e-03 | 12 |
| hsa0048041 | Breast | DCIS | Glutathione metabolism | 13/846 | 57/8465 | 3.44e-03 | 1.98e-02 | 1.46e-02 | 13 |
| hsa0421652 | Breast | DCIS | Ferroptosis | 12/846 | 41/8465 | 4.69e-04 | 3.69e-03 | 2.72e-03 | 12 |
| hsa0048051 | Breast | DCIS | Glutathione metabolism | 13/846 | 57/8465 | 3.44e-03 | 1.98e-02 | 1.46e-02 | 13 |
| hsa0421614 | Cervix | CC | Ferroptosis | 14/1267 | 41/8465 | 1.75e-03 | 7.21e-03 | 4.26e-03 | 14 |
| hsa0421615 | Cervix | CC | Ferroptosis | 14/1267 | 41/8465 | 1.75e-03 | 7.21e-03 | 4.26e-03 | 14 |
| hsa0421624 | Cervix | N_HPV | Ferroptosis | 6/349 | 41/8465 | 6.24e-03 | 3.24e-02 | 2.54e-02 | 6 |
| hsa0421634 | Cervix | N_HPV | Ferroptosis | 6/349 | 41/8465 | 6.24e-03 | 3.24e-02 | 2.54e-02 | 6 |
| hsa04216 | Colorectum | AD | Ferroptosis | 21/2092 | 41/8465 | 2.23e-04 | 1.78e-03 | 1.13e-03 | 21 |
| hsa00480 | Colorectum | AD | Glutathione metabolism | 23/2092 | 57/8465 | 6.52e-03 | 2.76e-02 | 1.76e-02 | 23 |
| hsa042161 | Colorectum | AD | Ferroptosis | 21/2092 | 41/8465 | 2.23e-04 | 1.78e-03 | 1.13e-03 | 21 |
| hsa004801 | Colorectum | AD | Glutathione metabolism | 23/2092 | 57/8465 | 6.52e-03 | 2.76e-02 | 1.76e-02 | 23 |
| hsa042162 | Colorectum | MSS | Ferroptosis | 18/1875 | 41/8465 | 1.53e-03 | 8.53e-03 | 5.23e-03 | 18 |
| hsa004802 | Colorectum | MSS | Glutathione metabolism | 22/1875 | 57/8465 | 3.58e-03 | 1.64e-02 | 1.01e-02 | 22 |
| hsa042163 | Colorectum | MSS | Ferroptosis | 18/1875 | 41/8465 | 1.53e-03 | 8.53e-03 | 5.23e-03 | 18 |
| hsa004803 | Colorectum | MSS | Glutathione metabolism | 22/1875 | 57/8465 | 3.58e-03 | 1.64e-02 | 1.01e-02 | 22 |
| Page: 1 2 3 4 |
Top |
Cell-cell communication analysis |
| Identification of potential cell-cell interactions between two cell types and their ligand-receptor pairs for different disease states |
| Ligand | Receptor | LRpair | Pathway | Tissue | Disease Stage |
| Page: 1 |
Top |
Single-cell gene regulatory network inference analysis |
| Find out the significant the regulons (TFs) and the target genes of each regulon across cell types for different disease states |
| TF | Cell Type | Tissue | Disease Stage | Target Gene | RSS | Regulon Activity |
| ∗The dot plots of a searched regulon are shown for all cell subpopulations in each disease state of each tissue based on the regulon specific score inferred using pySCENIC and by calculating the average expression. |
| Page: 1 |
Top |
Somatic mutation of malignant transformation related genes |
| Annotation of somatic variants for genes involved in malignant transformation |
| Hugo Symbol | Variant Class | Variant Classification | dbSNP RS | HGVSc | HGVSp | HGVSp Short | SWISSPROT | BIOTYPE | SIFT | PolyPhen | Tumor Sample Barcode | Tissue | Histology | Sex | Age | Stage | Therapy Types | Drugs | Outcome |
| GPX4 | SNV | Missense_Mutation | novel | c.425C>T | p.Pro142Leu | p.P142L | P36969 | protein_coding | deleterious(0.04) | probably_damaging(0.999) | TCGA-AA-3947-01 | Colorectum | colon adenocarcinoma | Female | <65 | I/II | Unknown | Unknown | SD |
| GPX4 | SNV | Missense_Mutation | c.521G>A | p.Gly174Asp | p.G174D | P36969 | protein_coding | deleterious(0) | probably_damaging(0.997) | TCGA-AA-A010-01 | Colorectum | colon adenocarcinoma | Female | <65 | I/II | Chemotherapy | folinic | CR | |
| GPX4 | SNV | Missense_Mutation | novel | c.313T>C | p.Phe105Leu | p.F105L | P36969 | protein_coding | deleterious(0) | probably_damaging(0.999) | TCGA-CA-6717-01 | Colorectum | colon adenocarcinoma | Male | <65 | I/II | Chemotherapy | oxaliplatin | CR |
| GPX4 | SNV | Missense_Mutation | c.418N>A | p.Ala140Thr | p.A140T | P36969 | protein_coding | tolerated(0.05) | possibly_damaging(0.609) | TCGA-AX-A1C9-01 | Endometrium | uterine corpus endometrioid carcinoma | Female | >=65 | I/II | Unknown | Unknown | SD | |
| GPX4 | SNV | Missense_Mutation | rs763745871 | c.536N>A | p.Arg179His | p.R179H | P36969 | protein_coding | deleterious(0) | probably_damaging(0.989) | TCGA-AX-A2HD-01 | Endometrium | uterine corpus endometrioid carcinoma | Female | >=65 | III/IV | Unknown | Unknown | SD |
| GPX4 | SNV | Missense_Mutation | novel | c.100N>A | p.Asp34Asn | p.D34N | P36969 | protein_coding | tolerated(0.3) | benign(0.01) | TCGA-B5-A1MW-01 | Endometrium | uterine corpus endometrioid carcinoma | Female | <65 | I/II | Unknown | Unknown | PD |
| GPX4 | SNV | Missense_Mutation | novel | c.563N>A | p.Val188Glu | p.V188E | P36969 | protein_coding | tolerated(1) | benign(0) | TCGA-BG-A221-01 | Endometrium | uterine corpus endometrioid carcinoma | Female | >=65 | I/II | Unknown | Unknown | SD |
| GPX4 | SNV | Missense_Mutation | novel | c.262N>A | p.Ala88Thr | p.A88T | P36969 | protein_coding | tolerated(0.52) | benign(0.01) | TCGA-EO-A22R-01 | Endometrium | uterine corpus endometrioid carcinoma | Female | <65 | I/II | Unknown | Unknown | SD |
| GPX4 | SNV | Missense_Mutation | novel | c.353N>C | p.Glu118Ala | p.E118A | P36969 | protein_coding | tolerated(0.17) | benign(0.019) | TCGA-EO-A22X-01 | Endometrium | uterine corpus endometrioid carcinoma | Female | <65 | III/IV | Unspecific | Carboplatin | Complete Response |
| GPX4 | SNV | Missense_Mutation | novel | c.502N>C | p.Phe168Leu | p.F168L | P36969 | protein_coding | deleterious(0) | probably_damaging(0.991) | TCGA-55-1595-01 | Lung | lung adenocarcinoma | Female | >=65 | I/II | Unknown | Unknown | SD |
| Page: 1 2 |
Top |
Related drugs of malignant transformation related genes |
| Identification of chemicals and drugs interact with genes involved in malignant transfromation |
| (DGIdb 4.0) |
| Entrez ID | Symbol | Category | Interaction Types | Drug Claim Name | Drug Name | PMIDs |
| Page: 1 |

Copyright 2023-Present -The University of Texas Health Science Center at Houston |