
|
|||||
|
 | |
| |
| |
| |
| |
| |
|
Gene: GPX2 |
Gene summary for GPX2 |
| Gene information | Species | Human | Gene symbol | GPX2 | Gene ID | 2877 |
| Gene name | glutathione peroxidase 2 | |
| Gene Alias | GI-GPx | |
| Cytomap | 14q23.3 | |
| Gene Type | protein-coding | GO ID | GO:0006091 | UniProtAcc | P18283 |
Top |
Malignant transformation analysis |
| Identification of the aberrant gene expression in precancerous and cancerous lesions by comparing the gene expression of stem-like cells in diseased tissues with normal stem cells |
| Entrez ID | Symbol | Replicates | Species | Organ | Tissue | Adj P-value | Log2FC | Malignancy |
| 2877 | GPX2 | CA_HPV_2 | Human | Cervix | CC | 8.57e-15 | 3.15e-01 | 0.0391 |
| 2877 | GPX2 | CA_HPV_3 | Human | Cervix | CC | 1.30e-12 | 2.92e-01 | 0.0414 |
| 2877 | GPX2 | N_HPV_2 | Human | Cervix | N_HPV | 1.75e-08 | 1.97e-01 | -0.0131 |
| 2877 | GPX2 | Tumor | Human | Cervix | CC | 2.67e-74 | 1.08e+00 | 0.1241 |
| 2877 | GPX2 | sample3 | Human | Cervix | CC | 1.66e-65 | 9.33e-01 | 0.1387 |
| 2877 | GPX2 | T3 | Human | Cervix | CC | 7.06e-69 | 9.65e-01 | 0.1389 |
| 2877 | GPX2 | HTA11_3410_2000001011 | Human | Colorectum | AD | 1.19e-15 | 5.12e-01 | 0.0155 |
| 2877 | GPX2 | HTA11_1938_2000001011 | Human | Colorectum | AD | 4.77e-21 | 1.06e+00 | -0.0811 |
| 2877 | GPX2 | HTA11_78_2000001011 | Human | Colorectum | AD | 1.26e-05 | 4.27e-01 | -0.1088 |
| 2877 | GPX2 | HTA11_347_2000001011 | Human | Colorectum | AD | 1.16e-28 | 8.69e-01 | -0.1954 |
| 2877 | GPX2 | HTA11_411_2000001011 | Human | Colorectum | SER | 3.48e-07 | 1.09e+00 | -0.2602 |
| 2877 | GPX2 | HTA11_2112_2000001011 | Human | Colorectum | SER | 3.46e-04 | 8.67e-01 | -0.2196 |
| 2877 | GPX2 | HTA11_3361_2000001011 | Human | Colorectum | AD | 1.17e-07 | 9.38e-01 | -0.1207 |
| 2877 | GPX2 | HTA11_696_2000001011 | Human | Colorectum | AD | 3.52e-20 | 1.12e+00 | -0.1464 |
| 2877 | GPX2 | HTA11_866_2000001011 | Human | Colorectum | AD | 1.39e-07 | 7.60e-01 | -0.1001 |
| 2877 | GPX2 | HTA11_1391_2000001011 | Human | Colorectum | AD | 1.03e-36 | 2.26e+00 | -0.059 |
| 2877 | GPX2 | HTA11_2992_2000001011 | Human | Colorectum | SER | 1.39e-06 | 9.96e-01 | -0.1706 |
| 2877 | GPX2 | HTA11_5212_2000001011 | Human | Colorectum | AD | 2.13e-04 | 6.59e-01 | -0.2061 |
| 2877 | GPX2 | HTA11_5216_2000001011 | Human | Colorectum | SER | 2.34e-08 | 1.03e+00 | -0.1462 |
| 2877 | GPX2 | HTA11_546_2000001011 | Human | Colorectum | AD | 1.43e-18 | 1.16e+00 | -0.0842 |
| Page: 1 2 3 4 5 6 7 8 9 10 11 |
| Tissue | Expression Dynamics | Abbreviation |
| Cervix |  | CC: Cervix cancer |
| HSIL_HPV: HPV-infected high-grade squamous intraepithelial lesions | ||
| N_HPV: HPV-infected normal cervix | ||
| Colorectum (GSE201348) | 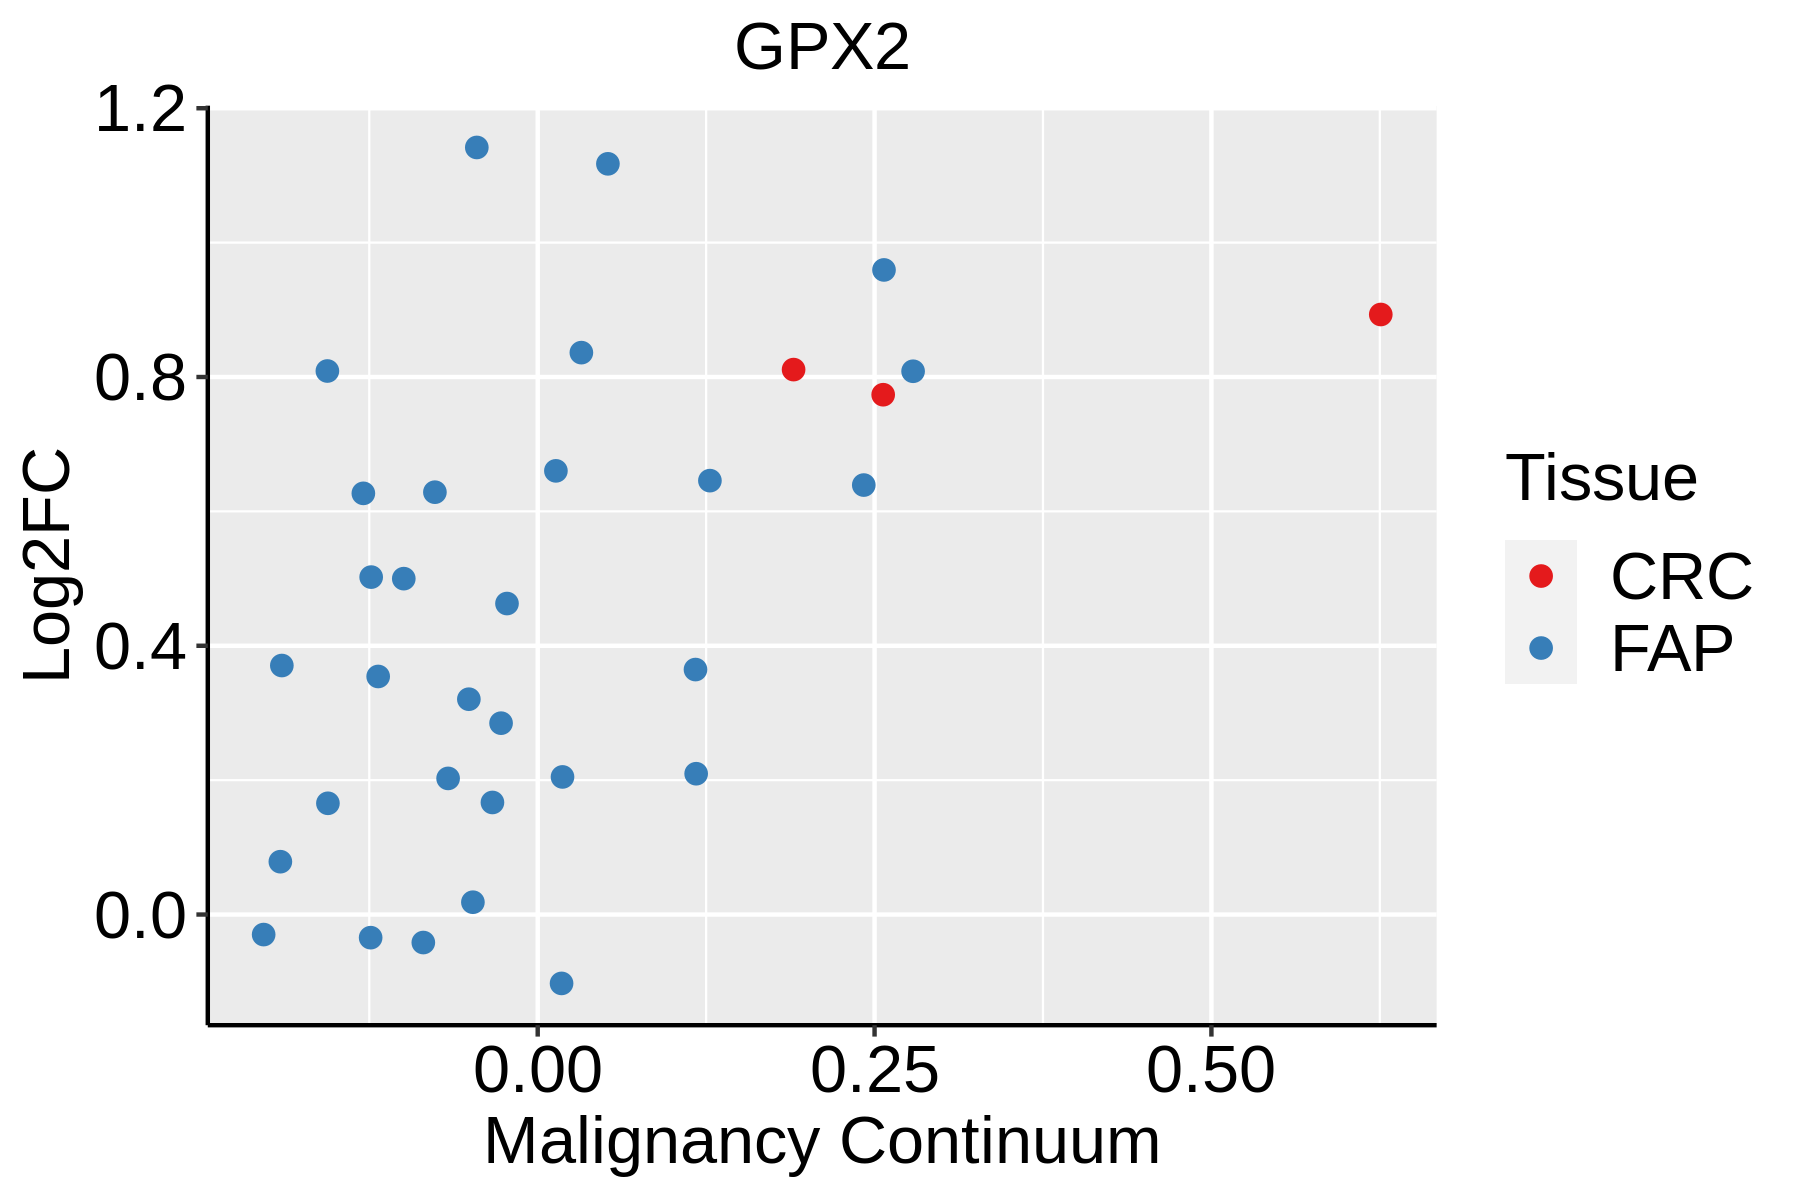 | FAP: Familial adenomatous polyposis |
| CRC: Colorectal cancer | ||
| Colorectum (HTA11) | 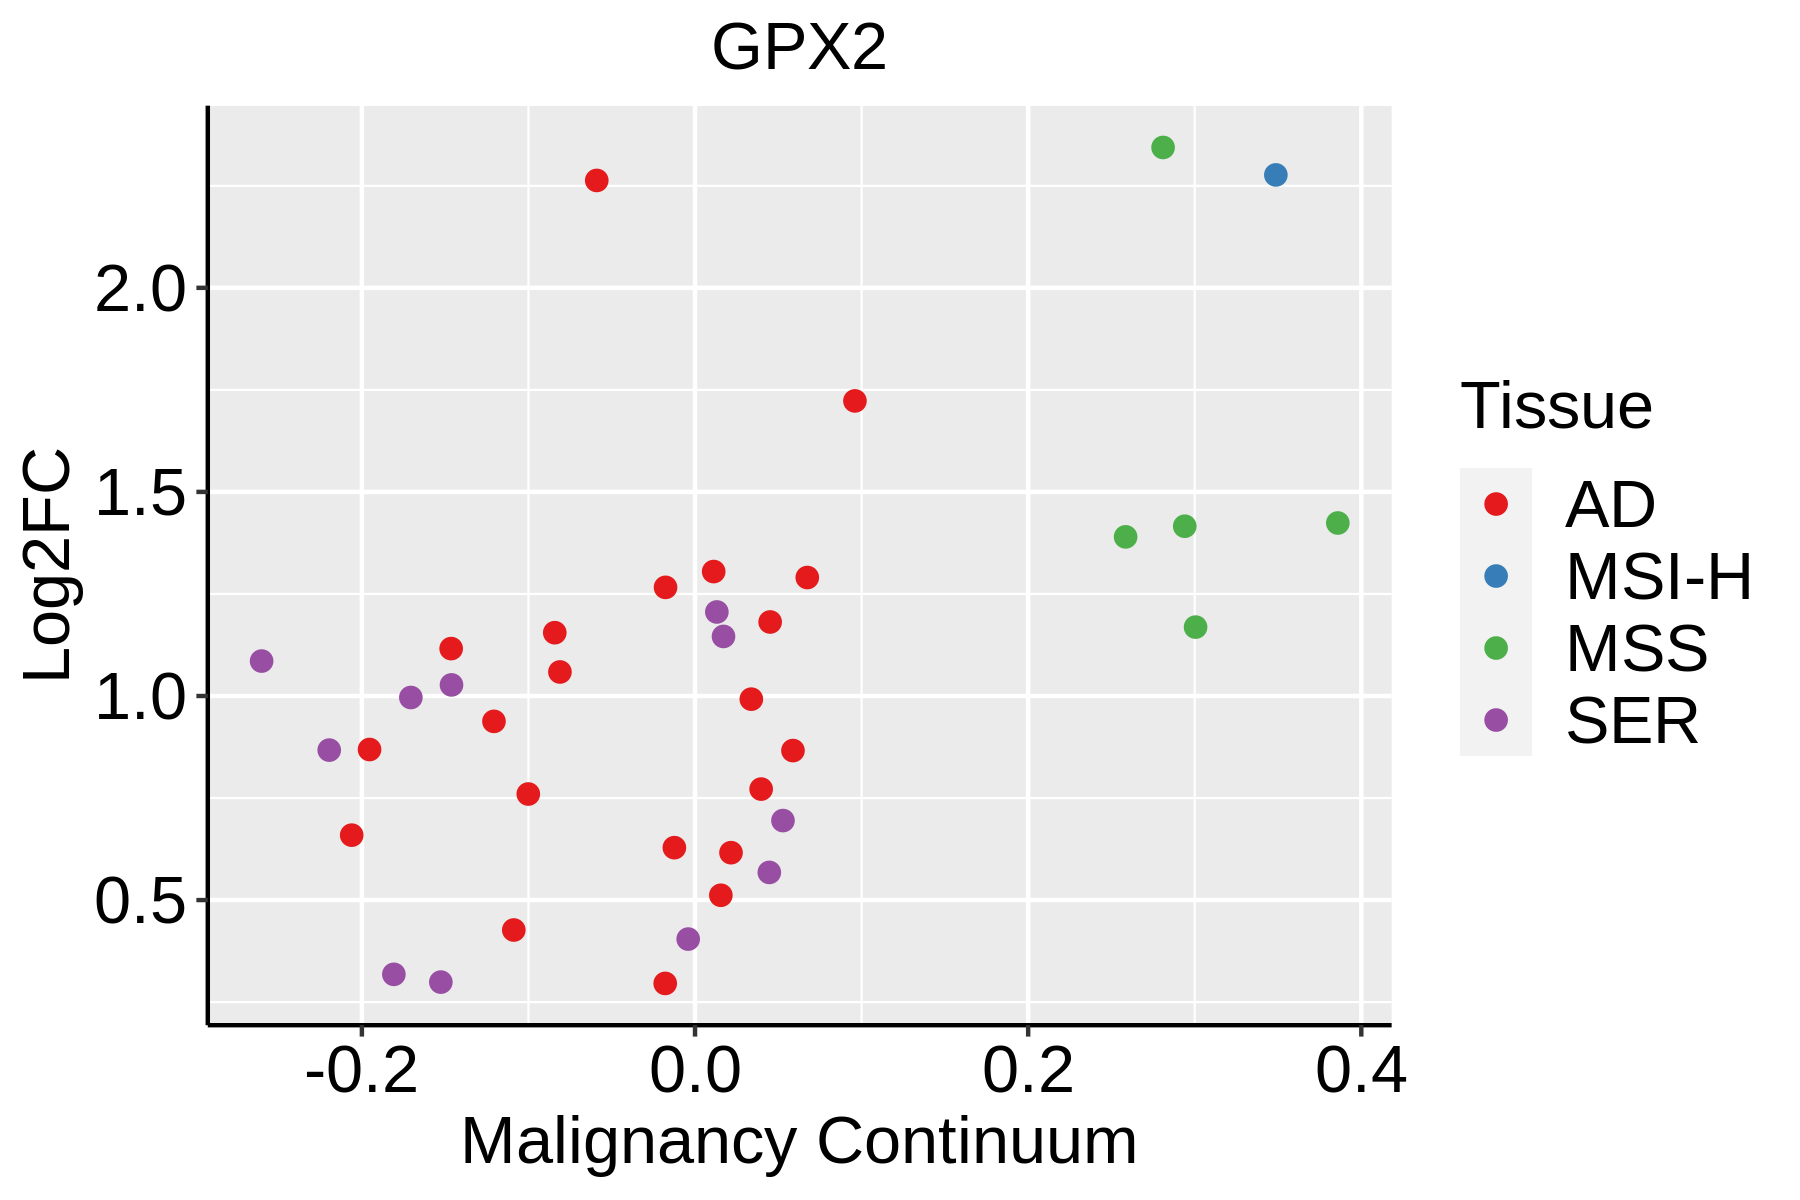 | AD: Adenomas |
| SER: Sessile serrated lesions | ||
| MSI-H: Microsatellite-high colorectal cancer | ||
| MSS: Microsatellite stable colorectal cancer | ||
| Esophagus | 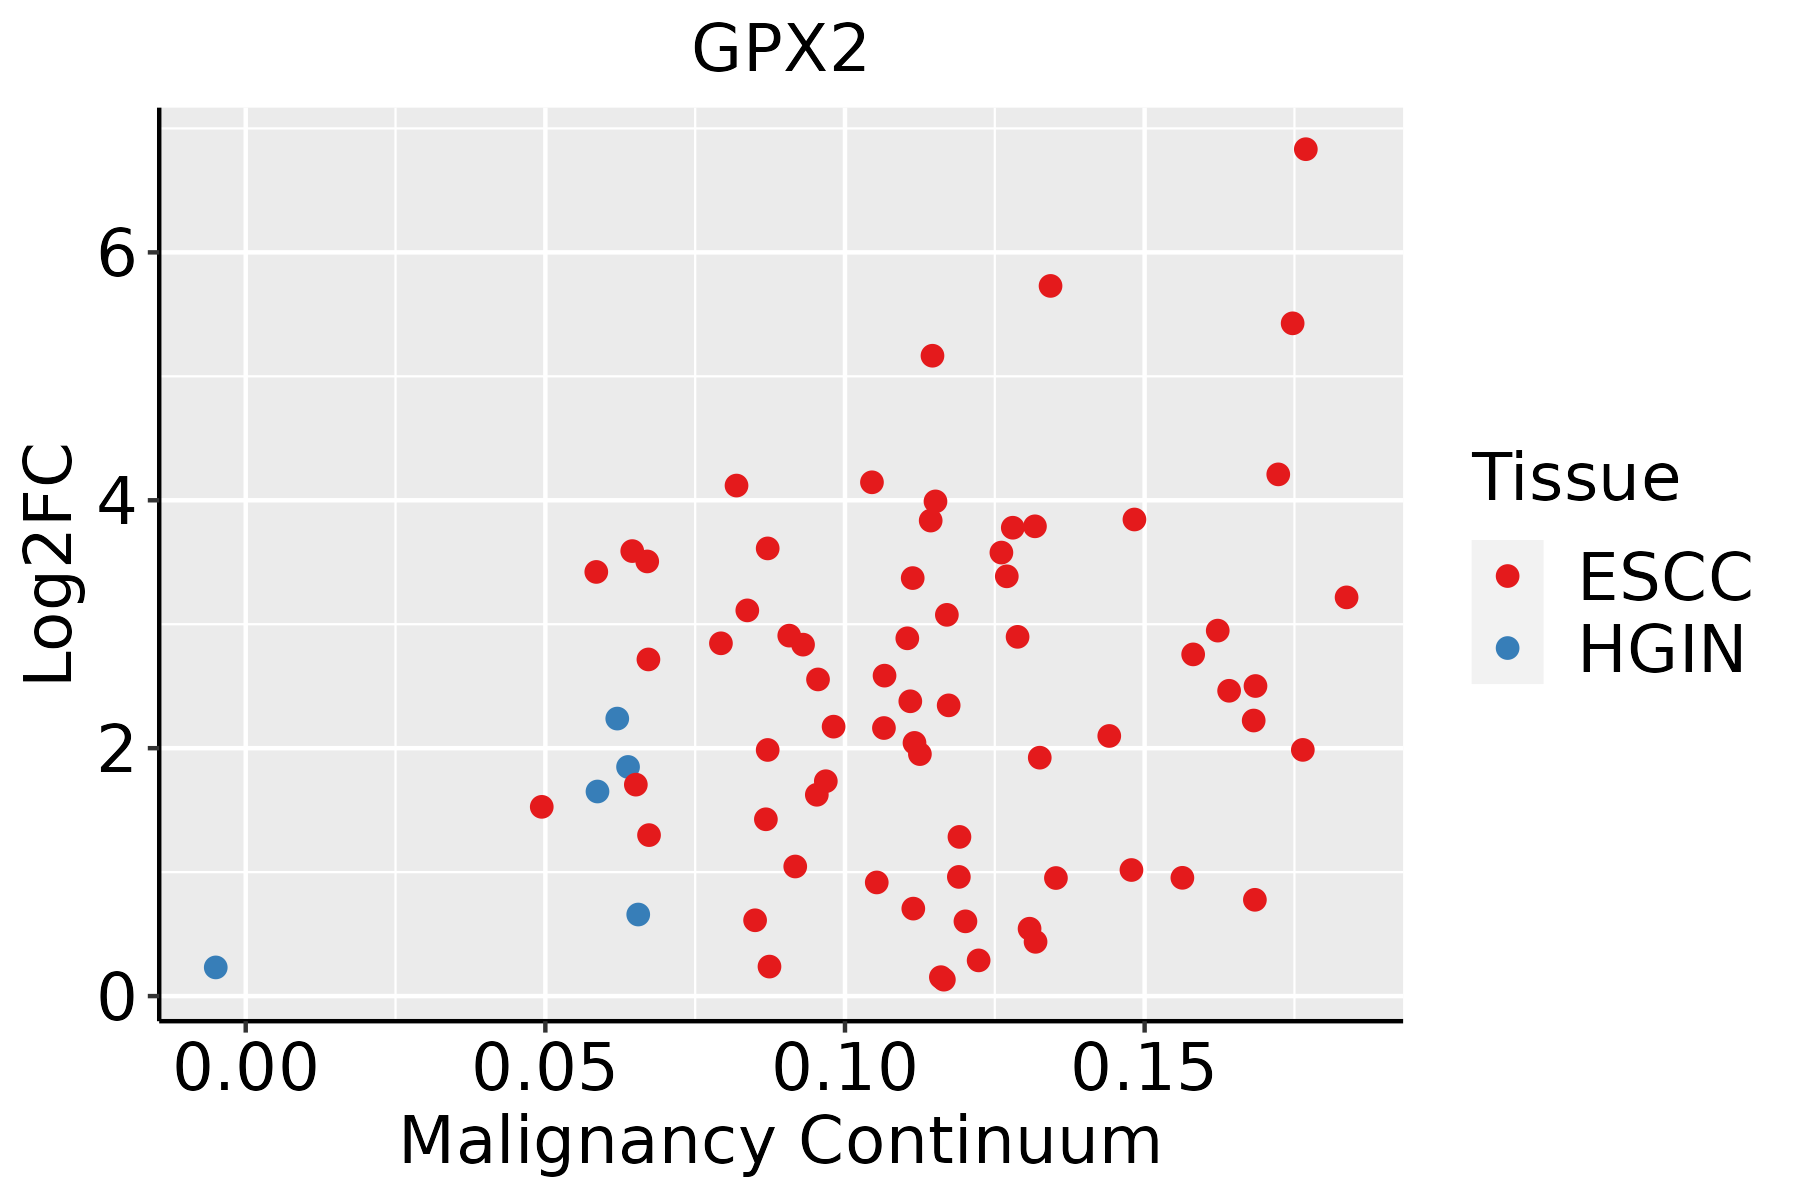 | ESCC: Esophageal squamous cell carcinoma |
| HGIN: High-grade intraepithelial neoplasias | ||
| LGIN: Low-grade intraepithelial neoplasias | ||
| GC |  | CAG: Chronic atrophic gastritis |
| CAG with IM: Chronic atrophic gastritis with intestinal metaplasia | ||
| CSG: Chronic superficial gastritis | ||
| GC: Gastric cancer | ||
| SIM: Severe intestinal metaplasia | ||
| WIM: Wild intestinal metaplasia | ||
| Liver |  | HCC: Hepatocellular carcinoma |
| NAFLD: Non-alcoholic fatty liver disease | ||
| Oral Cavity | 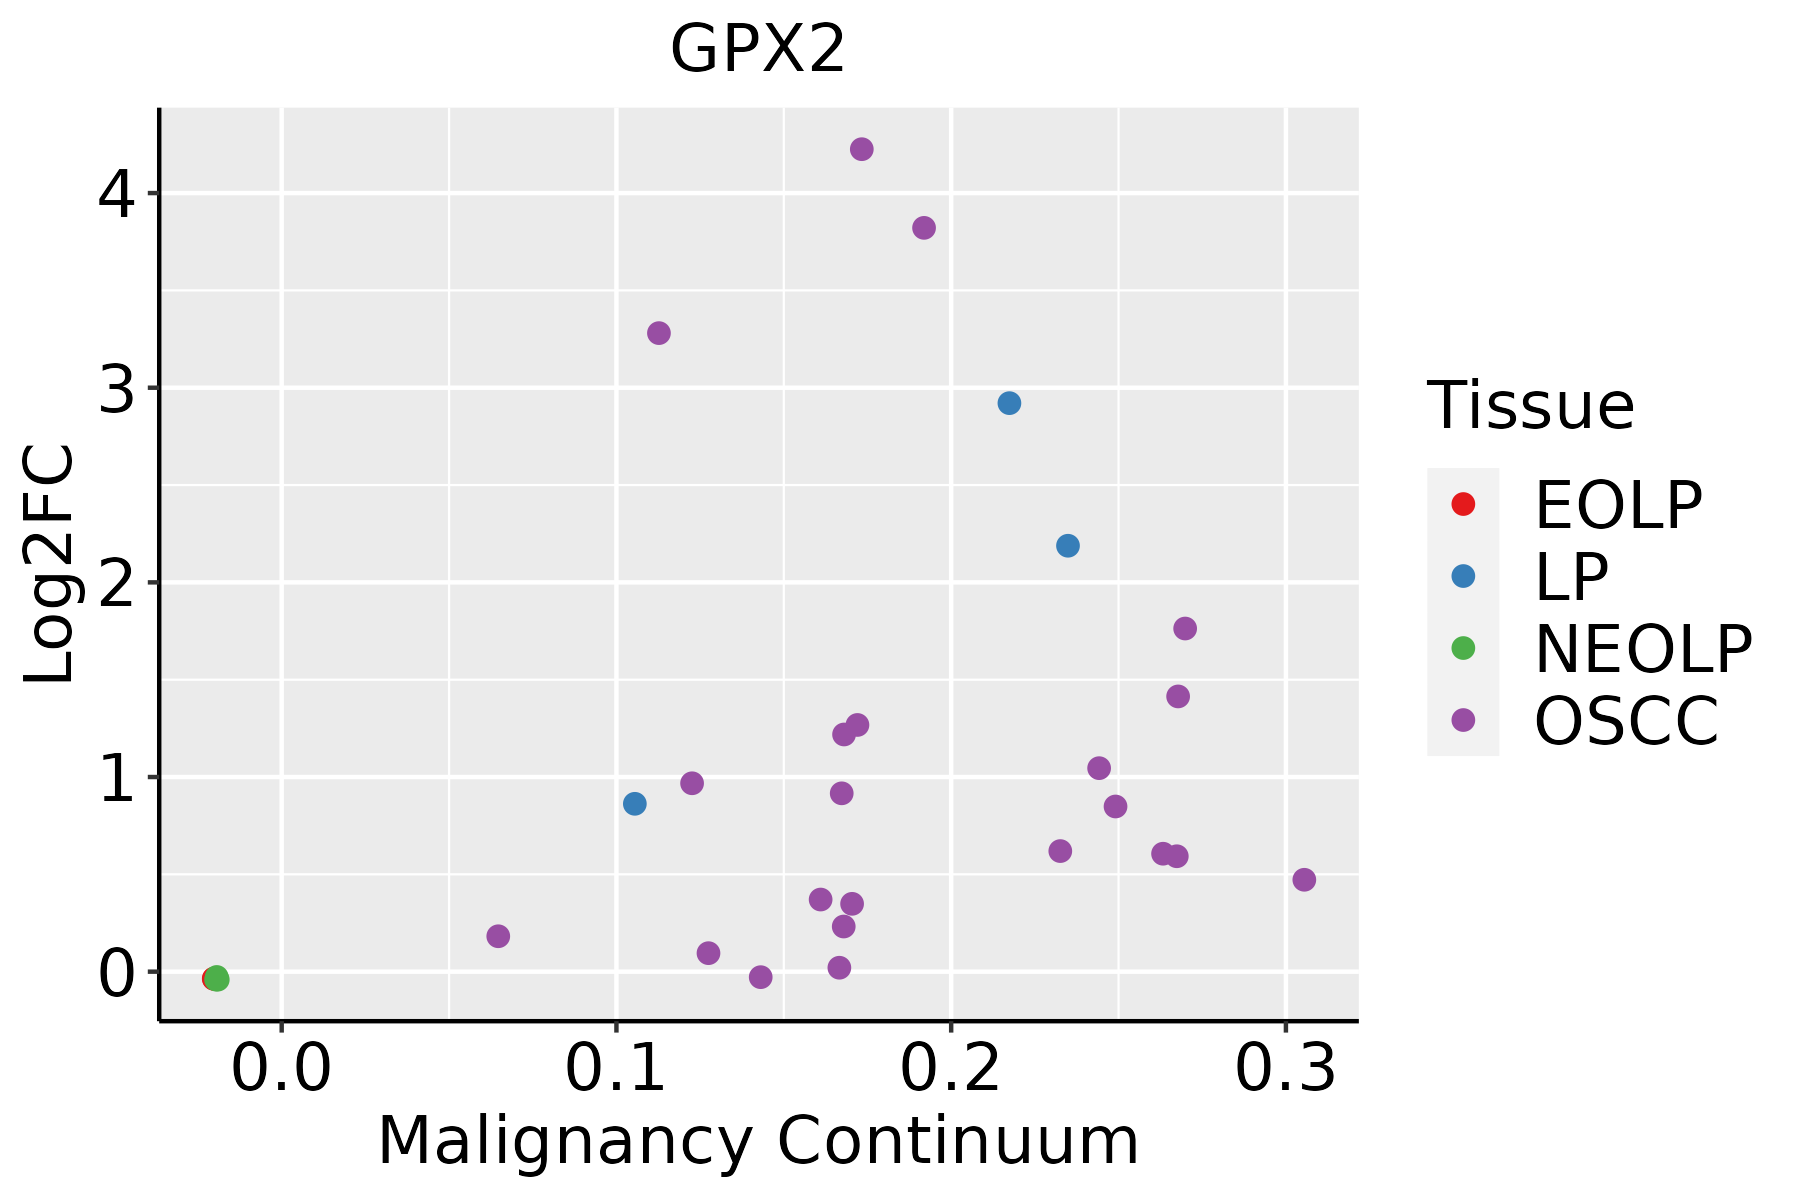 | EOLP: Erosive Oral lichen planus |
| LP: leukoplakia | ||
| NEOLP: Non-erosive oral lichen planus | ||
| OSCC: Oral squamous cell carcinoma | ||
| Skin | 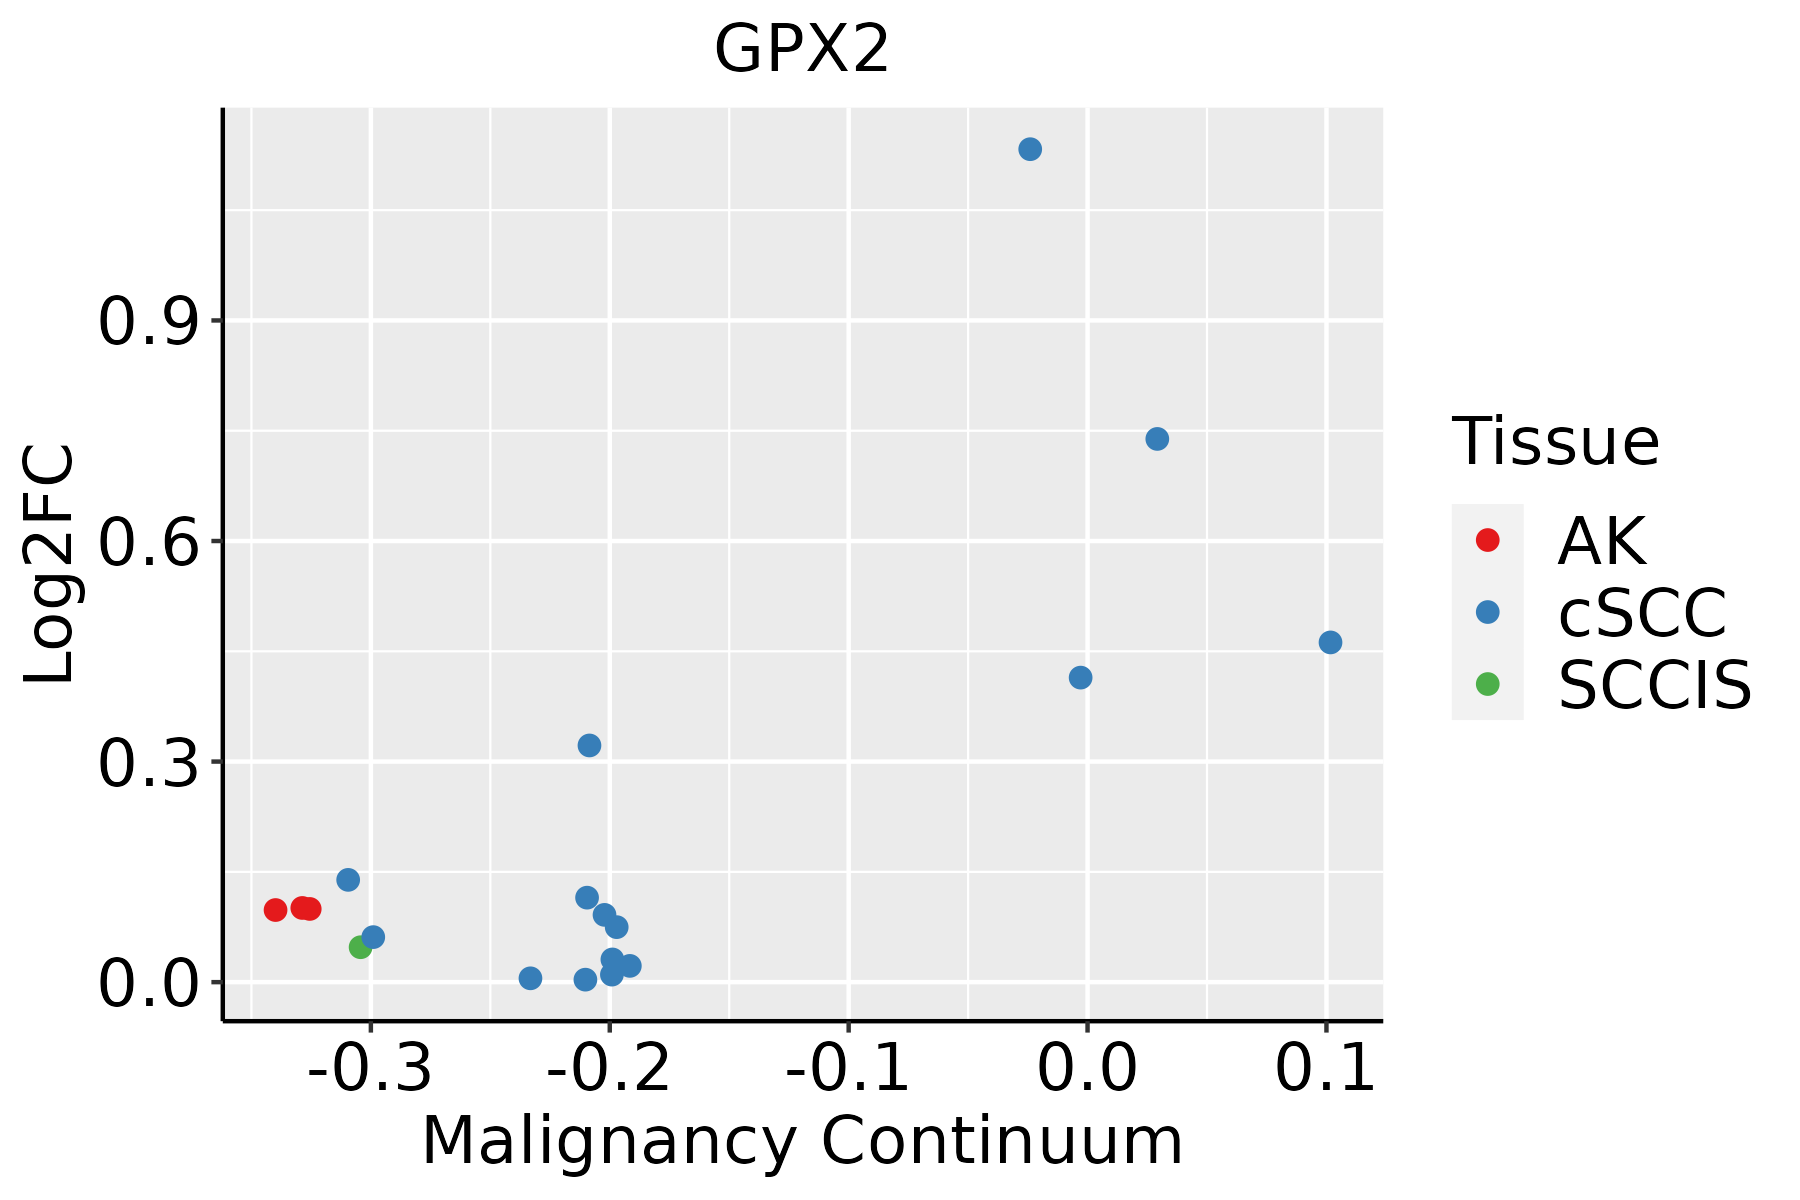 | AK: Actinic keratosis |
| cSCC: Cutaneous squamous cell carcinoma | ||
| SCCIS:squamous cell carcinoma in situ |
| ∗log2FC in expression of this searched gene in stem-like cells from each diseased tissue sample relative to stem-like cells in normal samples in each tissue plotted against the malignancy continuum. Samples are colored based on if they are from different disease stage. |
Top |
Malignant transformation related pathway analysis |
| Find out the enriched GO biological processes and KEGG pathways involved in transition from healthy to precancer to cancer |
| Tissue | Disease Stage | Enriched GO biological Processes |
| Colorectum | AD |  |
| Colorectum | SER |  |
| Colorectum | MSS |  |
| Colorectum | MSI-H |  |
| Colorectum | FAP |  |
| ∗Top 15 enriched GO BP terms are showed in the bar plot of each disease state in each tissue. Each row represents a significant GO biological process which is colored according to the -log10(p.adjust). |
| Page: 1 2 3 4 5 6 7 8 9 |
| GO ID | Tissue | Disease Stage | Description | Gene Ratio | Bg Ratio | pvalue | p.adjust | Count |
| GO:00229009 | Cervix | CC | electron transport chain | 53/2311 | 175/18723 | 2.23e-10 | 3.43e-08 | 53 |
| GO:000697910 | Cervix | CC | response to oxidative stress | 102/2311 | 446/18723 | 2.99e-10 | 4.36e-08 | 102 |
| GO:00060919 | Cervix | CC | generation of precursor metabolites and energy | 105/2311 | 490/18723 | 7.40e-09 | 6.61e-07 | 105 |
| GO:00988699 | Cervix | CC | cellular oxidant detoxification | 30/2311 | 101/18723 | 2.72e-06 | 7.93e-05 | 30 |
| GO:19907489 | Cervix | CC | cellular detoxification | 30/2311 | 116/18723 | 5.34e-05 | 7.94e-04 | 30 |
| GO:00972379 | Cervix | CC | cellular response to toxic substance | 31/2311 | 124/18723 | 8.09e-05 | 1.10e-03 | 31 |
| GO:00096369 | Cervix | CC | response to toxic substance | 52/2311 | 262/18723 | 3.34e-04 | 3.52e-03 | 52 |
| GO:00987549 | Cervix | CC | detoxification | 33/2311 | 152/18723 | 7.97e-04 | 7.00e-03 | 33 |
| GO:000609124 | Cervix | N_HPV | generation of precursor metabolites and energy | 40/534 | 490/18723 | 2.59e-09 | 7.88e-07 | 40 |
| GO:000963624 | Cervix | N_HPV | response to toxic substance | 27/534 | 262/18723 | 9.00e-09 | 1.71e-06 | 27 |
| GO:002290024 | Cervix | N_HPV | electron transport chain | 21/534 | 175/18723 | 2.95e-08 | 3.63e-06 | 21 |
| GO:000697925 | Cervix | N_HPV | response to oxidative stress | 31/534 | 446/18723 | 5.10e-06 | 1.89e-04 | 31 |
| GO:009886924 | Cervix | N_HPV | cellular oxidant detoxification | 13/534 | 101/18723 | 5.89e-06 | 2.15e-04 | 13 |
| GO:009723724 | Cervix | N_HPV | cellular response to toxic substance | 14/534 | 124/18723 | 1.22e-05 | 4.06e-04 | 14 |
| GO:199074824 | Cervix | N_HPV | cellular detoxification | 13/534 | 116/18723 | 2.69e-05 | 7.30e-04 | 13 |
| GO:009875424 | Cervix | N_HPV | detoxification | 15/534 | 152/18723 | 3.05e-05 | 8.02e-04 | 15 |
| GO:0006091 | Colorectum | AD | generation of precursor metabolites and energy | 209/3918 | 490/18723 | 3.17e-28 | 6.61e-25 | 209 |
| GO:0022900 | Colorectum | AD | electron transport chain | 89/3918 | 175/18723 | 1.42e-18 | 8.91e-16 | 89 |
| GO:0006979 | Colorectum | AD | response to oxidative stress | 145/3918 | 446/18723 | 5.16e-09 | 3.23e-07 | 145 |
| GO:0009636 | Colorectum | AD | response to toxic substance | 88/3918 | 262/18723 | 1.12e-06 | 3.72e-05 | 88 |
| Page: 1 2 3 4 5 6 7 8 |
| Pathway ID | Tissue | Disease Stage | Description | Gene Ratio | Bg Ratio | pvalue | p.adjust | qvalue | Count |
| hsa0501618 | Cervix | CC | Huntington disease | 94/1267 | 306/8465 | 8.49e-13 | 3.06e-11 | 1.81e-11 | 94 |
| hsa0502218 | Cervix | CC | Pathways of neurodegeneration - multiple diseases | 128/1267 | 476/8465 | 2.87e-12 | 9.29e-11 | 5.50e-11 | 128 |
| hsa0501418 | Cervix | CC | Amyotrophic lateral sclerosis | 103/1267 | 364/8465 | 1.79e-11 | 4.47e-10 | 2.64e-10 | 103 |
| hsa0501619 | Cervix | CC | Huntington disease | 94/1267 | 306/8465 | 8.49e-13 | 3.06e-11 | 1.81e-11 | 94 |
| hsa0502219 | Cervix | CC | Pathways of neurodegeneration - multiple diseases | 128/1267 | 476/8465 | 2.87e-12 | 9.29e-11 | 5.50e-11 | 128 |
| hsa0501419 | Cervix | CC | Amyotrophic lateral sclerosis | 103/1267 | 364/8465 | 1.79e-11 | 4.47e-10 | 2.64e-10 | 103 |
| hsa0501444 | Cervix | N_HPV | Amyotrophic lateral sclerosis | 41/349 | 364/8465 | 3.11e-09 | 1.06e-07 | 8.26e-08 | 41 |
| hsa0501644 | Cervix | N_HPV | Huntington disease | 36/349 | 306/8465 | 9.73e-09 | 2.65e-07 | 2.07e-07 | 36 |
| hsa0502244 | Cervix | N_HPV | Pathways of neurodegeneration - multiple diseases | 47/349 | 476/8465 | 1.48e-08 | 3.13e-07 | 2.45e-07 | 47 |
| hsa0501454 | Cervix | N_HPV | Amyotrophic lateral sclerosis | 41/349 | 364/8465 | 3.11e-09 | 1.06e-07 | 8.26e-08 | 41 |
| hsa0501654 | Cervix | N_HPV | Huntington disease | 36/349 | 306/8465 | 9.73e-09 | 2.65e-07 | 2.07e-07 | 36 |
| hsa0502254 | Cervix | N_HPV | Pathways of neurodegeneration - multiple diseases | 47/349 | 476/8465 | 1.48e-08 | 3.13e-07 | 2.45e-07 | 47 |
| hsa05016 | Colorectum | AD | Huntington disease | 147/2092 | 306/8465 | 1.93e-19 | 9.26e-18 | 5.91e-18 | 147 |
| hsa05014 | Colorectum | AD | Amyotrophic lateral sclerosis | 164/2092 | 364/8465 | 4.28e-18 | 1.27e-16 | 8.09e-17 | 164 |
| hsa05022 | Colorectum | AD | Pathways of neurodegeneration - multiple diseases | 201/2092 | 476/8465 | 4.54e-18 | 1.27e-16 | 8.09e-17 | 201 |
| hsa00480 | Colorectum | AD | Glutathione metabolism | 23/2092 | 57/8465 | 6.52e-03 | 2.76e-02 | 1.76e-02 | 23 |
| hsa050161 | Colorectum | AD | Huntington disease | 147/2092 | 306/8465 | 1.93e-19 | 9.26e-18 | 5.91e-18 | 147 |
| hsa050141 | Colorectum | AD | Amyotrophic lateral sclerosis | 164/2092 | 364/8465 | 4.28e-18 | 1.27e-16 | 8.09e-17 | 164 |
| hsa050221 | Colorectum | AD | Pathways of neurodegeneration - multiple diseases | 201/2092 | 476/8465 | 4.54e-18 | 1.27e-16 | 8.09e-17 | 201 |
| hsa004801 | Colorectum | AD | Glutathione metabolism | 23/2092 | 57/8465 | 6.52e-03 | 2.76e-02 | 1.76e-02 | 23 |
| Page: 1 2 3 4 5 6 7 |
Top |
Cell-cell communication analysis |
| Identification of potential cell-cell interactions between two cell types and their ligand-receptor pairs for different disease states |
| Ligand | Receptor | LRpair | Pathway | Tissue | Disease Stage |
| Page: 1 |
Top |
Single-cell gene regulatory network inference analysis |
| Find out the significant the regulons (TFs) and the target genes of each regulon across cell types for different disease states |
| TF | Cell Type | Tissue | Disease Stage | Target Gene | RSS | Regulon Activity |
| ∗The dot plots of a searched regulon are shown for all cell subpopulations in each disease state of each tissue based on the regulon specific score inferred using pySCENIC and by calculating the average expression. |
| Page: 1 |
Top |
Somatic mutation of malignant transformation related genes |
| Annotation of somatic variants for genes involved in malignant transformation |
| Hugo Symbol | Variant Class | Variant Classification | dbSNP RS | HGVSc | HGVSp | HGVSp Short | SWISSPROT | BIOTYPE | SIFT | PolyPhen | Tumor Sample Barcode | Tissue | Histology | Sex | Age | Stage | Therapy Types | Drugs | Outcome |
| GPX2 | SNV | Missense_Mutation | c.243G>C | p.Glu81Asp | p.E81D | P18283 | protein_coding | deleterious(0) | probably_damaging(0.991) | TCGA-B6-A1KI-01 | Breast | breast invasive carcinoma | Female | <65 | I/II | Unknown | Unknown | SD | |
| GPX2 | insertion | Nonsense_Mutation | novel | c.259_260insTATAGTCCAAAACAAATAGATAATTATAC | p.Lys87IlefsTer? | p.K87Ifs*? | P18283 | protein_coding | TCGA-BH-A0B4-01 | Breast | breast invasive carcinoma | Male | >=65 | III/IV | Hormone Therapy | tamoxiphen | SD | ||
| GPX2 | SNV | Missense_Mutation | novel | c.280N>A | p.Gly94Arg | p.G94R | P18283 | protein_coding | deleterious(0.03) | possibly_damaging(0.839) | TCGA-VS-A9U6-01 | Cervix | cervical & endocervical cancer | Female | <65 | I/II | Chemotherapy | cisplatin | PD |
| GPX2 | SNV | Missense_Mutation | c.389C>A | p.Pro130Gln | p.P130Q | P18283 | protein_coding | tolerated(0.06) | benign(0.419) | TCGA-AA-3833-01 | Colorectum | colon adenocarcinoma | Female | <65 | I/II | Unknown | Unknown | SD | |
| GPX2 | SNV | Missense_Mutation | c.511N>A | p.Arg171Ser | p.R171S | P18283 | protein_coding | deleterious(0.04) | benign(0.12) | TCGA-AD-A5EJ-01 | Colorectum | colon adenocarcinoma | Female | >=65 | I/II | Unknown | Unknown | SD | |
| GPX2 | SNV | Missense_Mutation | c.485N>T | p.Glu162Val | p.E162V | P18283 | protein_coding | deleterious(0) | benign(0.044) | TCGA-WS-AB45-01 | Colorectum | colon adenocarcinoma | Female | <65 | I/II | Unknown | Unknown | SD | |
| GPX2 | deletion | Frame_Shift_Del | rs773382437 | c.456delN | p.Trp152Ter | p.W152* | P18283 | protein_coding | TCGA-AA-3673-01 | Colorectum | colon adenocarcinoma | Female | <65 | I/II | Unknown | Unknown | SD | ||
| GPX2 | SNV | Missense_Mutation | novel | c.37N>A | p.Ala13Thr | p.A13T | P18283 | protein_coding | tolerated(0.05) | benign(0.238) | TCGA-AJ-A3EK-01 | Endometrium | uterine corpus endometrioid carcinoma | Female | <65 | I/II | Chemotherapy | carboplatin | CR |
| GPX2 | SNV | Missense_Mutation | novel | c.43N>C | p.Ser15Arg | p.S15R | P18283 | protein_coding | tolerated(0.52) | benign(0.049) | TCGA-AJ-A3NE-01 | Endometrium | uterine corpus endometrioid carcinoma | Female | <65 | I/II | Unknown | Unknown | SD |
| GPX2 | SNV | Missense_Mutation | novel | c.362N>G | p.Asp121Gly | p.D121G | P18283 | protein_coding | deleterious(0.04) | benign(0.003) | TCGA-AP-A1DV-01 | Endometrium | uterine corpus endometrioid carcinoma | Female | <65 | I/II | Unknown | Unknown | SD |
| Page: 1 2 3 |
Top |
Related drugs of malignant transformation related genes |
| Identification of chemicals and drugs interact with genes involved in malignant transfromation |
| (DGIdb 4.0) |
| Entrez ID | Symbol | Category | Interaction Types | Drug Claim Name | Drug Name | PMIDs |
| Page: 1 |

Copyright 2023-Present -The University of Texas Health Science Center at Houston |