
|
|||||
|
 | |
| |
| |
| |
| |
| |
|
Gene: GPT |
Gene summary for GPT |
| Gene information | Species | Human | Gene symbol | GPT | Gene ID | 2875 |
| Gene name | glutamic--pyruvic transaminase | |
| Gene Alias | AAT1 | |
| Cytomap | 8q24.3 | |
| Gene Type | protein-coding | GO ID | GO:0005975 | UniProtAcc | P24298 |
Top |
Malignant transformation analysis |
| Identification of the aberrant gene expression in precancerous and cancerous lesions by comparing the gene expression of stem-like cells in diseased tissues with normal stem cells |
| Entrez ID | Symbol | Replicates | Species | Organ | Tissue | Adj P-value | Log2FC | Malignancy |
| 2875 | GPT | HTA11_347_2000001011 | Human | Colorectum | AD | 8.68e-07 | 3.70e-01 | -0.1954 |
| 2875 | GPT | HTA11_83_2000001011 | Human | Colorectum | SER | 4.70e-07 | 7.21e-01 | -0.1526 |
| 2875 | GPT | HTA11_696_2000001011 | Human | Colorectum | AD | 2.64e-08 | 4.84e-01 | -0.1464 |
| 2875 | GPT | HTA11_866_2000001011 | Human | Colorectum | AD | 8.90e-05 | 1.97e-01 | -0.1001 |
| 2875 | GPT | HTA11_99999965104_69814 | Human | Colorectum | MSS | 4.53e-02 | -2.15e-01 | 0.281 |
| 2875 | GPT | HTA11_99999974143_84620 | Human | Colorectum | MSS | 1.98e-03 | -1.97e-01 | 0.3005 |
| 2875 | GPT | A002-C-205 | Human | Colorectum | FAP | 2.19e-06 | -1.97e-01 | -0.1236 |
| 2875 | GPT | A001-C-007 | Human | Colorectum | CRC | 4.53e-02 | -2.15e-01 | 0.1899 |
| 2875 | GPT | A018-E-020 | Human | Colorectum | FAP | 1.52e-02 | -1.36e-01 | -0.2034 |
| 2875 | GPT | P2T-E | Human | Esophagus | ESCC | 1.65e-02 | 2.79e-02 | 0.1177 |
| 2875 | GPT | P5T-E | Human | Esophagus | ESCC | 4.30e-05 | 6.22e-02 | 0.1327 |
| 2875 | GPT | P9T-E | Human | Esophagus | ESCC | 3.47e-03 | 6.89e-02 | 0.1131 |
| 2875 | GPT | P10T-E | Human | Esophagus | ESCC | 9.05e-18 | 2.80e-01 | 0.116 |
| 2875 | GPT | P11T-E | Human | Esophagus | ESCC | 3.16e-03 | 2.11e-01 | 0.1426 |
| 2875 | GPT | P20T-E | Human | Esophagus | ESCC | 1.28e-02 | 9.68e-02 | 0.1124 |
| 2875 | GPT | P22T-E | Human | Esophagus | ESCC | 4.12e-18 | 3.57e-01 | 0.1236 |
| 2875 | GPT | P26T-E | Human | Esophagus | ESCC | 5.68e-21 | 4.23e-01 | 0.1276 |
| 2875 | GPT | P40T-E | Human | Esophagus | ESCC | 4.53e-08 | 2.78e-01 | 0.109 |
| 2875 | GPT | P49T-E | Human | Esophagus | ESCC | 6.64e-11 | 6.37e-01 | 0.1768 |
| 2875 | GPT | P56T-E | Human | Esophagus | ESCC | 2.28e-05 | 8.19e-01 | 0.1613 |
| Page: 1 2 |
| Tissue | Expression Dynamics | Abbreviation |
| Colorectum (GSE201348) |  | FAP: Familial adenomatous polyposis |
| CRC: Colorectal cancer | ||
| Colorectum (HTA11) |  | AD: Adenomas |
| SER: Sessile serrated lesions | ||
| MSI-H: Microsatellite-high colorectal cancer | ||
| MSS: Microsatellite stable colorectal cancer | ||
| Esophagus | 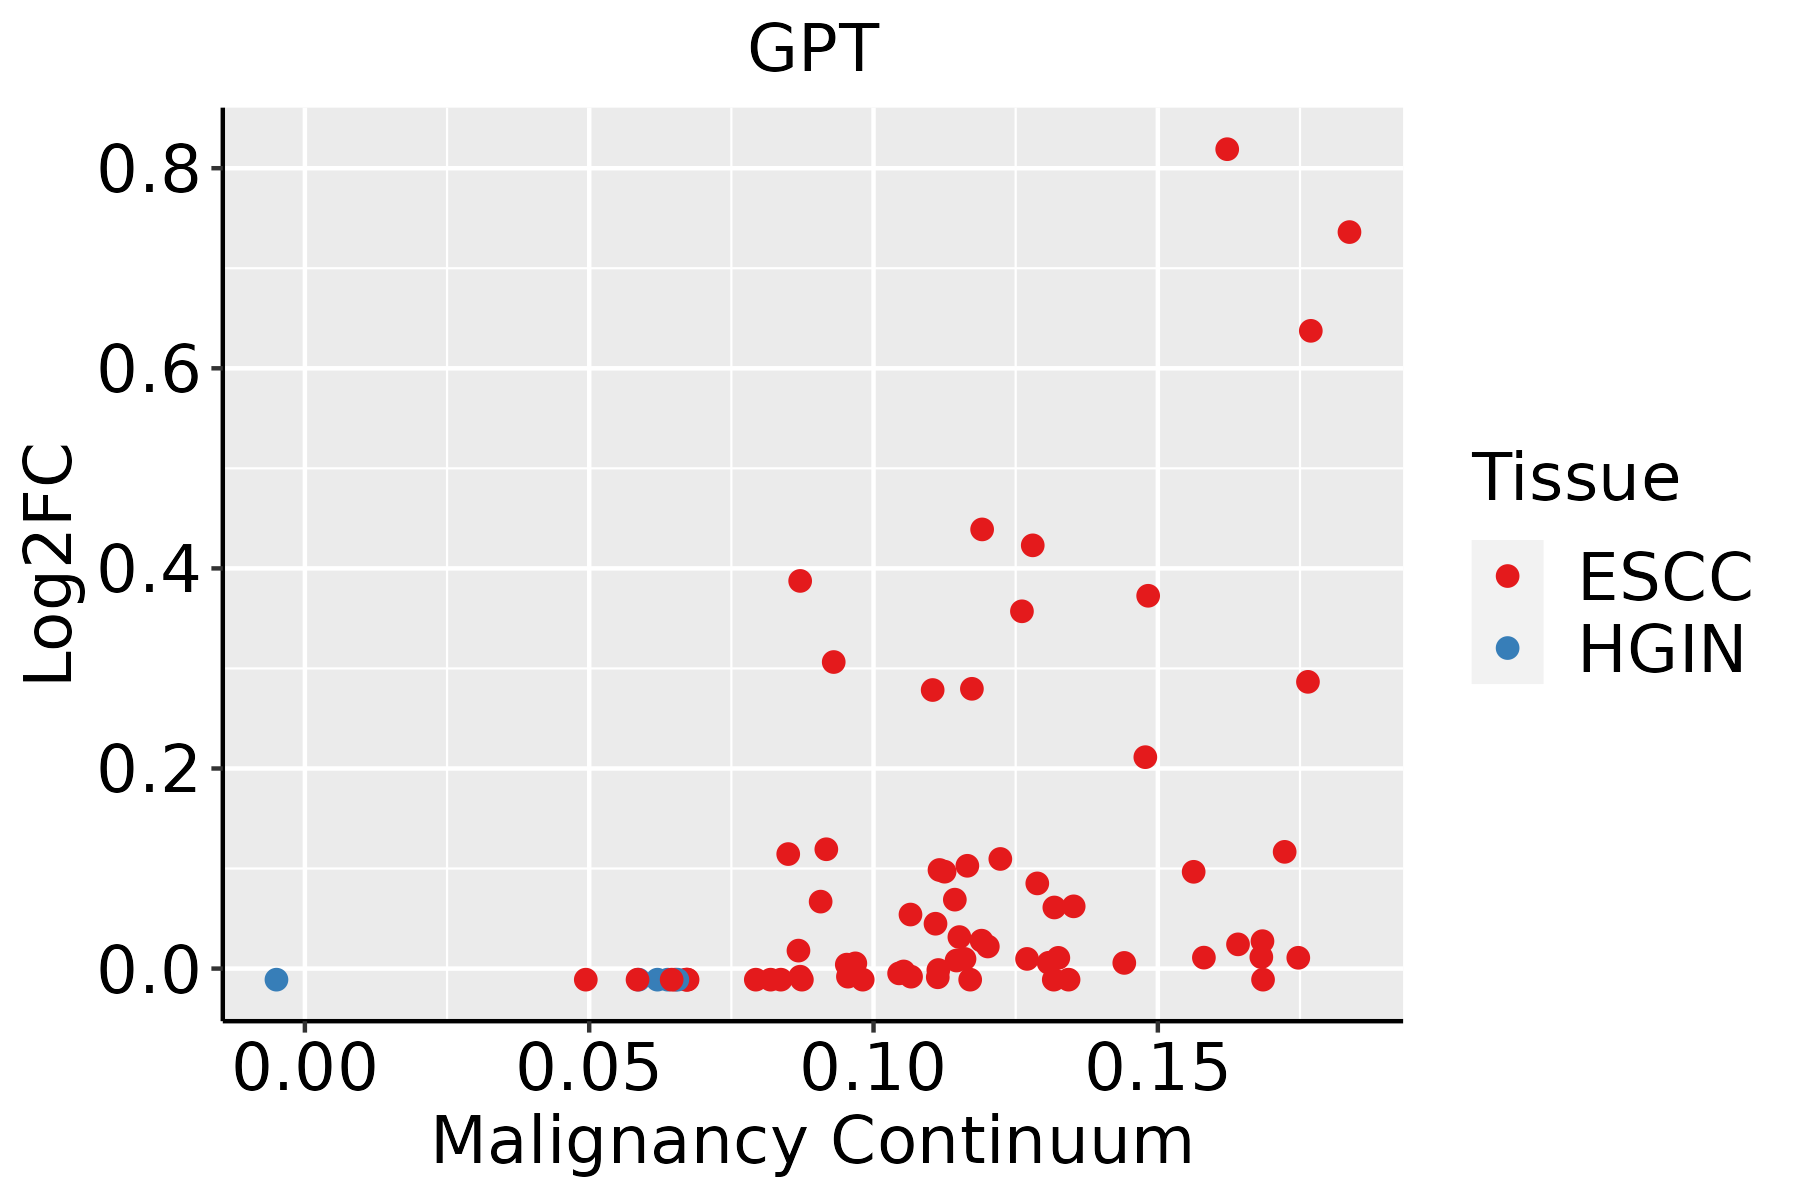 | ESCC: Esophageal squamous cell carcinoma |
| HGIN: High-grade intraepithelial neoplasias | ||
| LGIN: Low-grade intraepithelial neoplasias |
| ∗log2FC in expression of this searched gene in stem-like cells from each diseased tissue sample relative to stem-like cells in normal samples in each tissue plotted against the malignancy continuum. Samples are colored based on if they are from different disease stage. |
Top |
Malignant transformation related pathway analysis |
| Find out the enriched GO biological processes and KEGG pathways involved in transition from healthy to precancer to cancer |
| Tissue | Disease Stage | Enriched GO biological Processes |
| Colorectum | AD |  |
| Colorectum | SER |  |
| Colorectum | MSS |  |
| Colorectum | MSI-H |  |
| Colorectum | FAP |  |
| ∗Top 15 enriched GO BP terms are showed in the bar plot of each disease state in each tissue. Each row represents a significant GO biological process which is colored according to the -log10(p.adjust). |
| Page: 1 2 3 4 5 6 7 8 9 |
| GO ID | Tissue | Disease Stage | Description | Gene Ratio | Bg Ratio | pvalue | p.adjust | Count |
| GO:00362939 | Breast | Precancer | response to decreased oxygen levels | 53/1080 | 322/18723 | 4.09e-12 | 6.84e-10 | 53 |
| GO:00016669 | Breast | Precancer | response to hypoxia | 51/1080 | 307/18723 | 7.33e-12 | 1.11e-09 | 51 |
| GO:00704829 | Breast | Precancer | response to oxygen levels | 55/1080 | 347/18723 | 7.47e-12 | 1.11e-09 | 55 |
| GO:00513468 | Breast | Precancer | negative regulation of hydrolase activity | 50/1080 | 379/18723 | 3.85e-08 | 2.34e-06 | 50 |
| GO:0045766 | Breast | Precancer | positive regulation of angiogenesis | 23/1080 | 181/18723 | 3.09e-04 | 4.43e-03 | 23 |
| GO:1904018 | Breast | Precancer | positive regulation of vasculature development | 23/1080 | 181/18723 | 3.09e-04 | 4.43e-03 | 23 |
| GO:19040193 | Breast | Precancer | epithelial cell apoptotic process | 17/1080 | 121/18723 | 5.76e-04 | 7.28e-03 | 17 |
| GO:0045765 | Breast | Precancer | regulation of angiogenesis | 35/1080 | 342/18723 | 7.35e-04 | 8.80e-03 | 35 |
| GO:1901342 | Breast | Precancer | regulation of vasculature development | 35/1080 | 348/18723 | 1.00e-03 | 1.12e-02 | 35 |
| GO:19040351 | Breast | Precancer | regulation of epithelial cell apoptotic process | 14/1080 | 96/18723 | 1.18e-03 | 1.28e-02 | 14 |
| GO:005134613 | Breast | IDC | negative regulation of hydrolase activity | 71/1434 | 379/18723 | 1.33e-12 | 2.90e-10 | 71 |
| GO:007048214 | Breast | IDC | response to oxygen levels | 64/1434 | 347/18723 | 3.45e-11 | 5.57e-09 | 64 |
| GO:003629314 | Breast | IDC | response to decreased oxygen levels | 60/1434 | 322/18723 | 9.26e-11 | 1.25e-08 | 60 |
| GO:000166614 | Breast | IDC | response to hypoxia | 58/1434 | 307/18723 | 1.09e-10 | 1.38e-08 | 58 |
| GO:00457651 | Breast | IDC | regulation of angiogenesis | 45/1434 | 342/18723 | 2.57e-04 | 3.98e-03 | 45 |
| GO:19013421 | Breast | IDC | regulation of vasculature development | 45/1434 | 348/18723 | 3.78e-04 | 5.38e-03 | 45 |
| GO:00457661 | Breast | IDC | positive regulation of angiogenesis | 26/1434 | 181/18723 | 1.39e-03 | 1.43e-02 | 26 |
| GO:19040181 | Breast | IDC | positive regulation of vasculature development | 26/1434 | 181/18723 | 1.39e-03 | 1.43e-02 | 26 |
| GO:003629323 | Breast | DCIS | response to decreased oxygen levels | 60/1390 | 322/18723 | 2.64e-11 | 4.56e-09 | 60 |
| GO:007048223 | Breast | DCIS | response to oxygen levels | 63/1390 | 347/18723 | 2.66e-11 | 4.56e-09 | 63 |
| Page: 1 2 3 4 5 6 7 8 9 10 11 12 13 14 15 16 17 18 19 20 21 22 23 24 25 26 27 |
| Pathway ID | Tissue | Disease Stage | Description | Gene Ratio | Bg Ratio | pvalue | p.adjust | qvalue | Count |
| hsa01200 | Colorectum | AD | Carbon metabolism | 55/2092 | 115/8465 | 5.53e-08 | 8.42e-07 | 5.37e-07 | 55 |
| hsa01230 | Colorectum | AD | Biosynthesis of amino acids | 28/2092 | 75/8465 | 9.99e-03 | 3.89e-02 | 2.48e-02 | 28 |
| hsa012001 | Colorectum | AD | Carbon metabolism | 55/2092 | 115/8465 | 5.53e-08 | 8.42e-07 | 5.37e-07 | 55 |
| hsa012301 | Colorectum | AD | Biosynthesis of amino acids | 28/2092 | 75/8465 | 9.99e-03 | 3.89e-02 | 2.48e-02 | 28 |
| hsa012002 | Colorectum | SER | Carbon metabolism | 40/1580 | 115/8465 | 2.77e-05 | 3.41e-04 | 2.47e-04 | 40 |
| hsa012302 | Colorectum | SER | Biosynthesis of amino acids | 23/1580 | 75/8465 | 8.11e-03 | 4.14e-02 | 3.01e-02 | 23 |
| hsa012003 | Colorectum | SER | Carbon metabolism | 40/1580 | 115/8465 | 2.77e-05 | 3.41e-04 | 2.47e-04 | 40 |
| hsa012303 | Colorectum | SER | Biosynthesis of amino acids | 23/1580 | 75/8465 | 8.11e-03 | 4.14e-02 | 3.01e-02 | 23 |
| hsa012004 | Colorectum | MSS | Carbon metabolism | 43/1875 | 115/8465 | 1.37e-04 | 1.17e-03 | 7.19e-04 | 43 |
| hsa012005 | Colorectum | MSS | Carbon metabolism | 43/1875 | 115/8465 | 1.37e-04 | 1.17e-03 | 7.19e-04 | 43 |
| hsa012006 | Colorectum | FAP | Carbon metabolism | 38/1404 | 115/8465 | 1.04e-05 | 1.44e-04 | 8.76e-05 | 38 |
| hsa012007 | Colorectum | FAP | Carbon metabolism | 38/1404 | 115/8465 | 1.04e-05 | 1.44e-04 | 8.76e-05 | 38 |
| Page: 1 |
Top |
Cell-cell communication analysis |
| Identification of potential cell-cell interactions between two cell types and their ligand-receptor pairs for different disease states |
| Ligand | Receptor | LRpair | Pathway | Tissue | Disease Stage |
| Page: 1 |
Top |
Single-cell gene regulatory network inference analysis |
| Find out the significant the regulons (TFs) and the target genes of each regulon across cell types for different disease states |
| TF | Cell Type | Tissue | Disease Stage | Target Gene | RSS | Regulon Activity |
| ∗The dot plots of a searched regulon are shown for all cell subpopulations in each disease state of each tissue based on the regulon specific score inferred using pySCENIC and by calculating the average expression. |
| Page: 1 |
Top |
Somatic mutation of malignant transformation related genes |
| Annotation of somatic variants for genes involved in malignant transformation |
| Hugo Symbol | Variant Class | Variant Classification | dbSNP RS | HGVSc | HGVSp | HGVSp Short | SWISSPROT | BIOTYPE | SIFT | PolyPhen | Tumor Sample Barcode | Tissue | Histology | Sex | Age | Stage | Therapy Types | Drugs | Outcome |
| GPT | SNV | Missense_Mutation | rs529679428 | c.523N>A | p.Glu175Lys | p.E175K | P24298 | protein_coding | tolerated(0.47) | benign(0.075) | TCGA-E2-A1IN-01 | Breast | breast invasive carcinoma | Female | <65 | I/II | Hormone Therapy | arimidex | SD |
| GPT | SNV | Missense_Mutation | rs370128580 | c.22N>T | p.Arg8Trp | p.R8W | P24298 | protein_coding | deleterious(0.01) | benign(0.153) | TCGA-E9-A1R4-01 | Breast | breast invasive carcinoma | Female | >=65 | I/II | Chemotherapy | 5-fluorouracil | SD |
| GPT | SNV | Missense_Mutation | rs749597350 | c.380N>G | p.Ser127Cys | p.S127C | P24298 | protein_coding | tolerated(0.18) | benign(0.062) | TCGA-EW-A1J5-01 | Breast | breast invasive carcinoma | Female | <65 | I/II | Chemotherapy | adriamycin | SD |
| GPT | deletion | Frame_Shift_Del | novel | c.569delC | p.Pro190HisfsTer69 | p.P190Hfs*69 | P24298 | protein_coding | TCGA-EW-A2FV-01 | Breast | breast invasive carcinoma | Female | <65 | III/IV | Chemotherapy | docetaxel | SD | ||
| GPT | SNV | Missense_Mutation | rs751740696 | c.211N>A | p.Ala71Thr | p.A71T | P24298 | protein_coding | tolerated(0.06) | possibly_damaging(0.83) | TCGA-2W-A8YY-01 | Cervix | cervical & endocervical cancer | Female | <65 | I/II | Chemotherapy | cisplatin | CR |
| GPT | SNV | Missense_Mutation | rs779578484 | c.184N>A | p.Glu62Lys | p.E62K | P24298 | protein_coding | tolerated(0.21) | benign(0.092) | TCGA-VS-A8QM-01 | Cervix | cervical & endocervical cancer | Female | <65 | I/II | Chemotherapy | cisplatin | PD |
| GPT | SNV | Missense_Mutation | novel | c.1125N>A | p.Phe375Leu | p.F375L | P24298 | protein_coding | deleterious(0) | possibly_damaging(0.898) | TCGA-5M-AAT6-01 | Colorectum | colon adenocarcinoma | Female | <65 | III/IV | Unknown | Unknown | PD |
| GPT | SNV | Missense_Mutation | c.1232C>T | p.Ala411Val | p.A411V | P24298 | protein_coding | deleterious(0) | probably_damaging(0.996) | TCGA-A6-6781-01 | Colorectum | colon adenocarcinoma | Male | <65 | III/IV | Chemotherapy | oxaliplatin | SD | |
| GPT | SNV | Missense_Mutation | novel | c.557N>C | p.Ile186Thr | p.I186T | P24298 | protein_coding | deleterious(0.03) | probably_damaging(0.998) | TCGA-AA-3492-01 | Colorectum | colon adenocarcinoma | Female | >=65 | I/II | Unknown | Unknown | SD |
| GPT | SNV | Missense_Mutation | c.405C>A | p.Asp135Glu | p.D135E | P24298 | protein_coding | tolerated(0.15) | possibly_damaging(0.467) | TCGA-AY-6196-01 | Colorectum | colon adenocarcinoma | Male | <65 | III/IV | Unknown | Unknown | SD |
| Page: 1 2 3 4 |
Top |
Related drugs of malignant transformation related genes |
| Identification of chemicals and drugs interact with genes involved in malignant transfromation |
| (DGIdb 4.0) |
| Entrez ID | Symbol | Category | Interaction Types | Drug Claim Name | Drug Name | PMIDs |
| 2875 | GPT | ENZYME | PROTEASE INHIBITOR | 9769871 | ||
| 2875 | GPT | ENZYME | TACROLIMUS | TACROLIMUS | 9825815 | |
| 2875 | GPT | ENZYME | GLUCAGON | GLUCAGON | 9808480 |
| Page: 1 |

Copyright 2023-Present -The University of Texas Health Science Center at Houston |