
|
|||||
|
 | |
| |
| |
| |
| |
| |
|
Gene: GPSM3 |
Gene summary for GPSM3 |
| Gene information | Species | Human | Gene symbol | GPSM3 | Gene ID | 63940 |
| Gene name | G protein signaling modulator 3 | |
| Gene Alias | AGS4 | |
| Cytomap | 6p21.32 | |
| Gene Type | protein-coding | GO ID | GO:0001816 | UniProtAcc | A0A024RCP6 |
Top |
Malignant transformation analysis |
| Identification of the aberrant gene expression in precancerous and cancerous lesions by comparing the gene expression of stem-like cells in diseased tissues with normal stem cells |
| Entrez ID | Symbol | Replicates | Species | Organ | Tissue | Adj P-value | Log2FC | Malignancy |
| 63940 | GPSM3 | LZE4T | Human | Esophagus | ESCC | 3.18e-05 | 2.35e-01 | 0.0811 |
| 63940 | GPSM3 | LZE7T | Human | Esophagus | ESCC | 2.56e-05 | 2.67e-01 | 0.0667 |
| 63940 | GPSM3 | LZE22D1 | Human | Esophagus | HGIN | 8.03e-04 | 2.39e-01 | 0.0595 |
| 63940 | GPSM3 | LZE24T | Human | Esophagus | ESCC | 3.17e-06 | 2.09e-01 | 0.0596 |
| 63940 | GPSM3 | LZE6T | Human | Esophagus | ESCC | 2.36e-17 | 6.68e-01 | 0.0845 |
| 63940 | GPSM3 | P2T-E | Human | Esophagus | ESCC | 3.97e-04 | 1.14e-01 | 0.1177 |
| 63940 | GPSM3 | P32T-E | Human | Esophagus | ESCC | 8.40e-04 | 9.45e-02 | 0.1666 |
| 63940 | GPSM3 | P37T-E | Human | Esophagus | ESCC | 3.53e-03 | 9.15e-02 | 0.1371 |
| 63940 | GPSM3 | P56T-E | Human | Esophagus | ESCC | 1.10e-03 | 4.76e-01 | 0.1613 |
| 63940 | GPSM3 | P57T-E | Human | Esophagus | ESCC | 2.03e-09 | 2.64e-01 | 0.0926 |
| 63940 | GPSM3 | P65T-E | Human | Esophagus | ESCC | 5.29e-07 | 1.92e-01 | 0.0978 |
| 63940 | GPSM3 | P74T-E | Human | Esophagus | ESCC | 1.42e-04 | 1.53e-01 | 0.1479 |
| 63940 | GPSM3 | P75T-E | Human | Esophagus | ESCC | 2.05e-07 | 1.37e-01 | 0.1125 |
| 63940 | GPSM3 | P79T-E | Human | Esophagus | ESCC | 3.58e-28 | 5.67e-01 | 0.1154 |
| 63940 | GPSM3 | P80T-E | Human | Esophagus | ESCC | 7.90e-04 | 1.70e-01 | 0.155 |
| 63940 | GPSM3 | P89T-E | Human | Esophagus | ESCC | 4.36e-04 | 2.81e-01 | 0.1752 |
| 63940 | GPSM3 | P128T-E | Human | Esophagus | ESCC | 2.93e-10 | 2.74e-01 | 0.1241 |
| 63940 | GPSM3 | C04 | Human | Oral cavity | OSCC | 1.06e-03 | 3.56e-01 | 0.2633 |
| 63940 | GPSM3 | C21 | Human | Oral cavity | OSCC | 7.98e-51 | 1.53e+00 | 0.2678 |
| 63940 | GPSM3 | C30 | Human | Oral cavity | OSCC | 7.50e-08 | 5.17e-01 | 0.3055 |
| Page: 1 2 |
| Tissue | Expression Dynamics | Abbreviation |
| Esophagus | 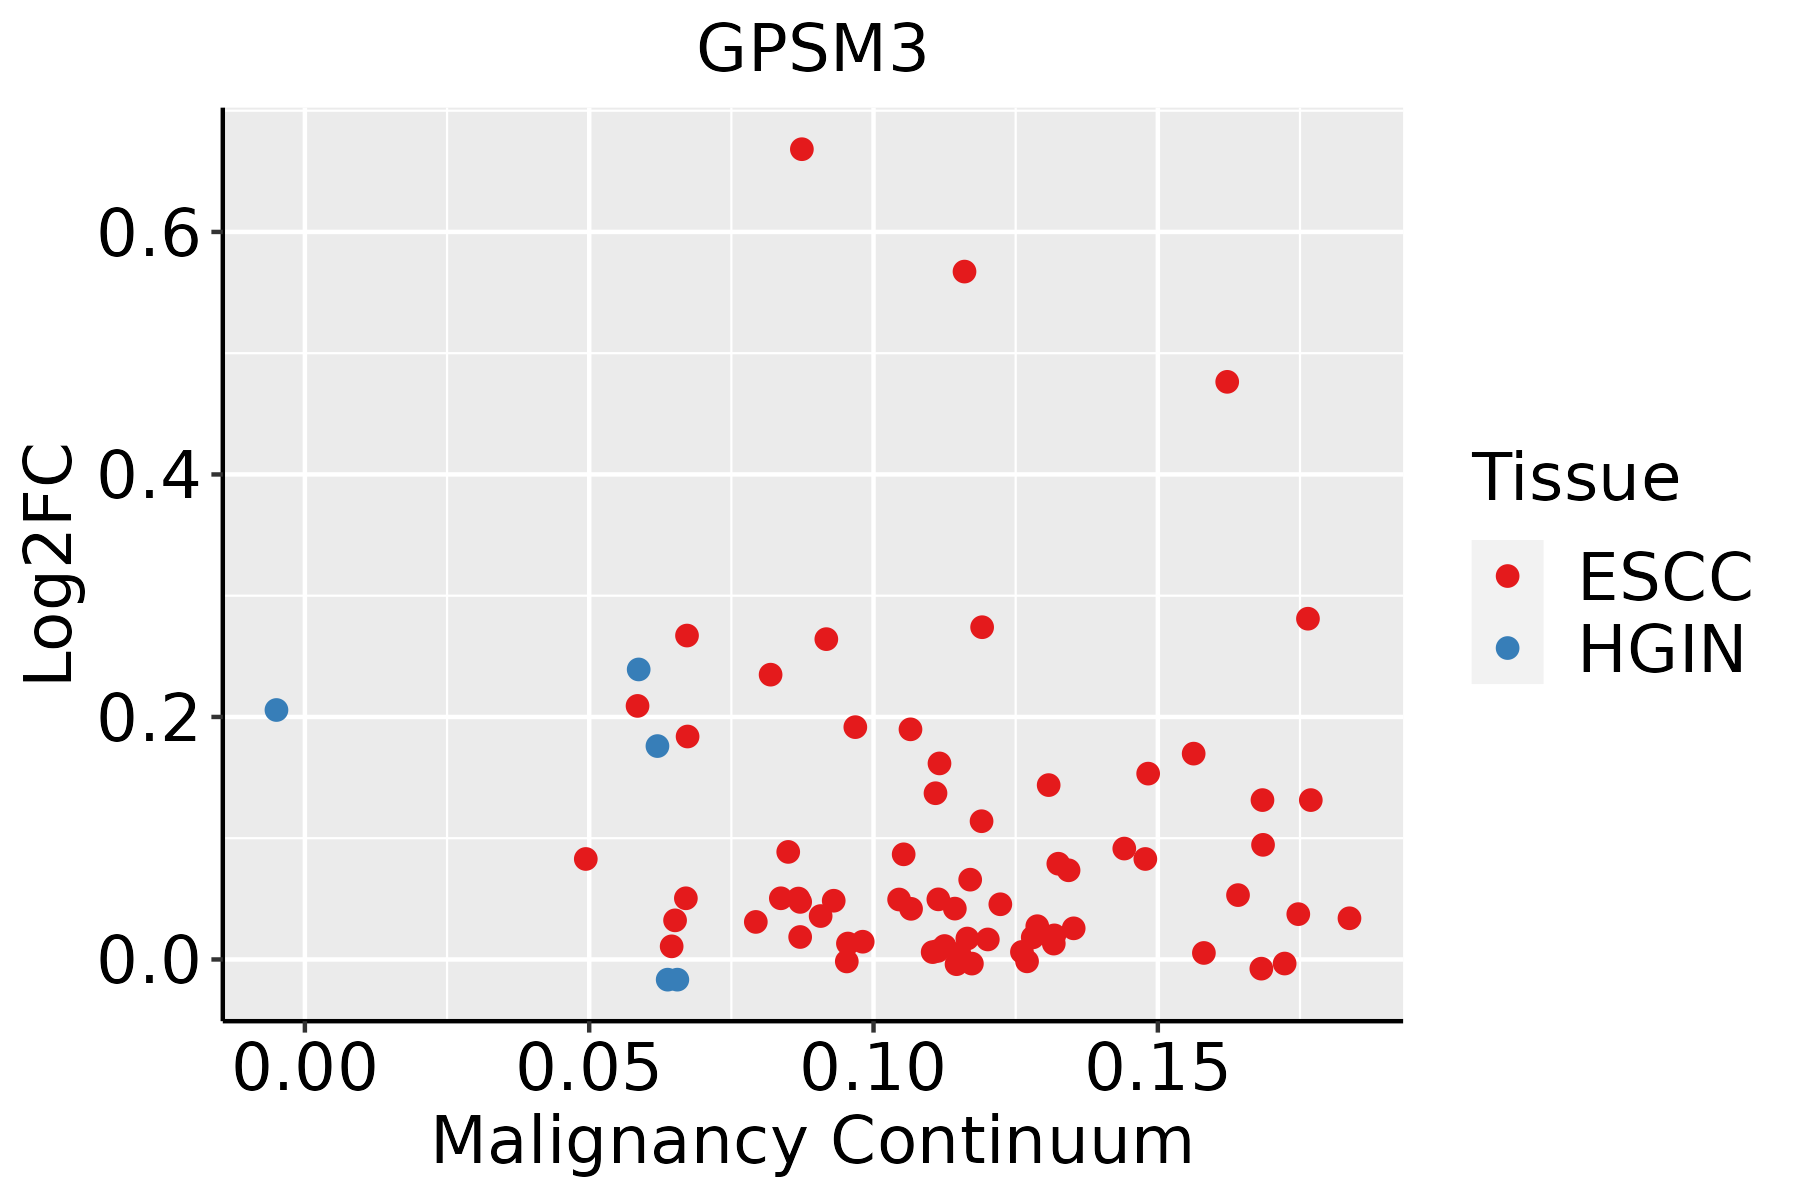 | ESCC: Esophageal squamous cell carcinoma |
| HGIN: High-grade intraepithelial neoplasias | ||
| LGIN: Low-grade intraepithelial neoplasias | ||
| Oral Cavity | 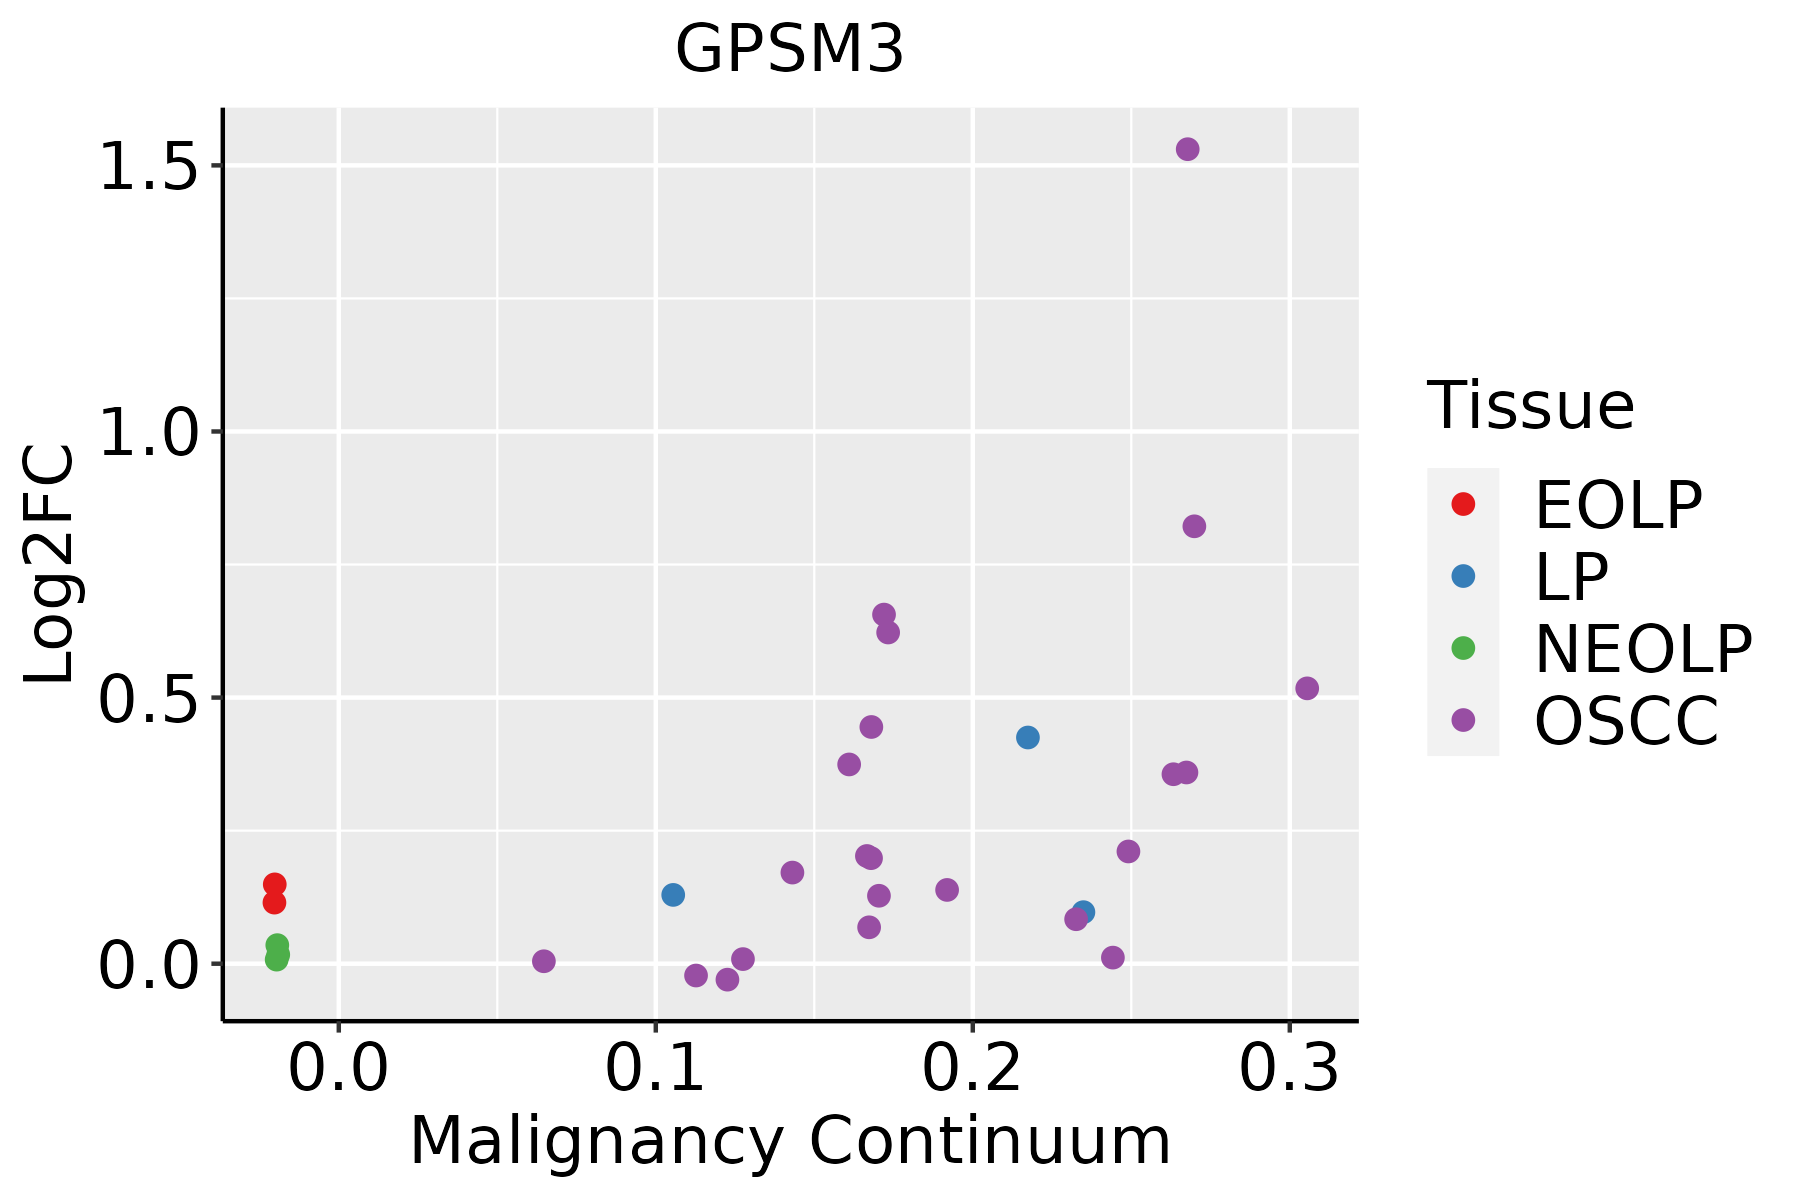 | EOLP: Erosive Oral lichen planus |
| LP: leukoplakia | ||
| NEOLP: Non-erosive oral lichen planus | ||
| OSCC: Oral squamous cell carcinoma |
| ∗log2FC in expression of this searched gene in stem-like cells from each diseased tissue sample relative to stem-like cells in normal samples in each tissue plotted against the malignancy continuum. Samples are colored based on if they are from different disease stage. |
Top |
Malignant transformation related pathway analysis |
| Find out the enriched GO biological processes and KEGG pathways involved in transition from healthy to precancer to cancer |
| Tissue | Disease Stage | Enriched GO biological Processes |
| Colorectum | AD |  |
| Colorectum | SER |  |
| Colorectum | MSS |  |
| Colorectum | MSI-H |  |
| Colorectum | FAP |  |
| ∗Top 15 enriched GO BP terms are showed in the bar plot of each disease state in each tissue. Each row represents a significant GO biological process which is colored according to the -log10(p.adjust). |
| Page: 1 2 3 4 5 6 7 8 9 |
| GO ID | Tissue | Disease Stage | Description | Gene Ratio | Bg Ratio | pvalue | p.adjust | Count |
| GO:000181916 | Esophagus | ESCC | positive regulation of cytokine production | 244/8552 | 467/18723 | 2.29e-03 | 1.01e-02 | 244 |
| GO:000268515 | Esophagus | ESCC | regulation of leukocyte migration | 114/8552 | 210/18723 | 7.26e-03 | 2.63e-02 | 114 |
| GO:000268714 | Oral cavity | OSCC | positive regulation of leukocyte migration | 78/7305 | 135/18723 | 7.43e-06 | 8.08e-05 | 78 |
| GO:000268510 | Oral cavity | OSCC | regulation of leukocyte migration | 108/7305 | 210/18723 | 1.63e-04 | 1.13e-03 | 108 |
| GO:00321037 | Oral cavity | OSCC | positive regulation of response to external stimulus | 203/7305 | 427/18723 | 1.79e-04 | 1.22e-03 | 203 |
| GO:00509216 | Oral cavity | OSCC | positive regulation of chemotaxis | 76/7305 | 141/18723 | 2.30e-04 | 1.49e-03 | 76 |
| GO:005090010 | Oral cavity | OSCC | leukocyte migration | 176/7305 | 369/18723 | 3.80e-04 | 2.31e-03 | 176 |
| GO:00026908 | Oral cavity | OSCC | positive regulation of leukocyte chemotaxis | 53/7305 | 94/18723 | 4.71e-04 | 2.79e-03 | 53 |
| GO:000181910 | Oral cavity | OSCC | positive regulation of cytokine production | 213/7305 | 467/18723 | 1.93e-03 | 8.96e-03 | 213 |
| GO:00603269 | Oral cavity | OSCC | cell chemotaxis | 146/7305 | 310/18723 | 2.13e-03 | 9.80e-03 | 146 |
| GO:00305959 | Oral cavity | OSCC | leukocyte chemotaxis | 110/7305 | 230/18723 | 3.86e-03 | 1.58e-02 | 110 |
| GO:000268810 | Oral cavity | OSCC | regulation of leukocyte chemotaxis | 62/7305 | 122/18723 | 5.22e-03 | 2.03e-02 | 62 |
| GO:00509204 | Oral cavity | OSCC | regulation of chemotaxis | 105/7305 | 223/18723 | 8.27e-03 | 3.01e-02 | 105 |
| GO:00313495 | Oral cavity | OSCC | positive regulation of defense response | 127/7305 | 278/18723 | 1.32e-02 | 4.39e-02 | 127 |
| GO:003210314 | Oral cavity | EOLP | positive regulation of response to external stimulus | 84/2218 | 427/18723 | 1.72e-06 | 3.99e-05 | 84 |
| GO:005090014 | Oral cavity | EOLP | leukocyte migration | 74/2218 | 369/18723 | 3.40e-06 | 7.35e-05 | 74 |
| GO:000181915 | Oral cavity | EOLP | positive regulation of cytokine production | 87/2218 | 467/18723 | 1.08e-05 | 1.92e-04 | 87 |
| GO:003059514 | Oral cavity | EOLP | leukocyte chemotaxis | 48/2218 | 230/18723 | 6.07e-05 | 7.64e-04 | 48 |
| GO:006032614 | Oral cavity | EOLP | cell chemotaxis | 60/2218 | 310/18723 | 8.04e-05 | 9.66e-04 | 60 |
| GO:003134912 | Oral cavity | EOLP | positive regulation of defense response | 53/2218 | 278/18723 | 3.00e-04 | 2.81e-03 | 53 |
| Page: 1 2 |
| Pathway ID | Tissue | Disease Stage | Description | Gene Ratio | Bg Ratio | pvalue | p.adjust | qvalue | Count |
| hsa046219 | Esophagus | HGIN | NOD-like receptor signaling pathway | 45/1383 | 186/8465 | 3.40e-03 | 2.54e-02 | 2.02e-02 | 45 |
| hsa0462114 | Esophagus | HGIN | NOD-like receptor signaling pathway | 45/1383 | 186/8465 | 3.40e-03 | 2.54e-02 | 2.02e-02 | 45 |
| hsa0462122 | Esophagus | ESCC | NOD-like receptor signaling pathway | 116/4205 | 186/8465 | 2.90e-04 | 1.03e-03 | 5.30e-04 | 116 |
| hsa0462132 | Esophagus | ESCC | NOD-like receptor signaling pathway | 116/4205 | 186/8465 | 2.90e-04 | 1.03e-03 | 5.30e-04 | 116 |
| hsa046218 | Oral cavity | OSCC | NOD-like receptor signaling pathway | 108/3704 | 186/8465 | 5.13e-05 | 2.07e-04 | 1.05e-04 | 108 |
| hsa0462113 | Oral cavity | OSCC | NOD-like receptor signaling pathway | 108/3704 | 186/8465 | 5.13e-05 | 2.07e-04 | 1.05e-04 | 108 |
| hsa046214 | Oral cavity | EOLP | NOD-like receptor signaling pathway | 48/1218 | 186/8465 | 2.51e-05 | 1.31e-04 | 7.70e-05 | 48 |
| hsa046215 | Oral cavity | EOLP | NOD-like receptor signaling pathway | 48/1218 | 186/8465 | 2.51e-05 | 1.31e-04 | 7.70e-05 | 48 |
| Page: 1 |
Top |
Cell-cell communication analysis |
| Identification of potential cell-cell interactions between two cell types and their ligand-receptor pairs for different disease states |
| Ligand | Receptor | LRpair | Pathway | Tissue | Disease Stage |
| Page: 1 |
Top |
Single-cell gene regulatory network inference analysis |
| Find out the significant the regulons (TFs) and the target genes of each regulon across cell types for different disease states |
| TF | Cell Type | Tissue | Disease Stage | Target Gene | RSS | Regulon Activity |
| ∗The dot plots of a searched regulon are shown for all cell subpopulations in each disease state of each tissue based on the regulon specific score inferred using pySCENIC and by calculating the average expression. |
| Page: 1 |
Top |
Somatic mutation of malignant transformation related genes |
| Annotation of somatic variants for genes involved in malignant transformation |
| Hugo Symbol | Variant Class | Variant Classification | dbSNP RS | HGVSc | HGVSp | HGVSp Short | SWISSPROT | BIOTYPE | SIFT | PolyPhen | Tumor Sample Barcode | Tissue | Histology | Sex | Age | Stage | Therapy Types | Drugs | Outcome |
| GPSM3 | SNV | Missense_Mutation | c.351G>T | p.Gln117His | p.Q117H | Q9Y4H4 | protein_coding | deleterious(0.04) | possibly_damaging(0.855) | TCGA-C8-A12Q-01 | Breast | breast invasive carcinoma | Female | >=65 | III/IV | Unknown | Unknown | PD | |
| GPSM3 | SNV | Missense_Mutation | novel | c.58N>A | p.Glu20Lys | p.E20K | Q9Y4H4 | protein_coding | deleterious_low_confidence(0.01) | benign(0.062) | TCGA-IR-A3LI-01 | Cervix | cervical & endocervical cancer | Female | <65 | I/II | Chemotherapy | cisplatin | CR |
| GPSM3 | SNV | Missense_Mutation | rs749245400 | c.137N>A | p.Arg46His | p.R46H | Q9Y4H4 | protein_coding | tolerated_low_confidence(0.15) | benign(0) | TCGA-VS-A94Z-01 | Cervix | cervical & endocervical cancer | Female | <65 | I/II | Chemotherapy | cisplatin | CR |
| GPSM3 | SNV | Missense_Mutation | novel | c.474N>G | p.His158Gln | p.H158Q | Q9Y4H4 | protein_coding | deleterious_low_confidence(0.01) | benign(0.137) | TCGA-AA-3947-01 | Colorectum | colon adenocarcinoma | Female | <65 | I/II | Unknown | Unknown | SD |
| GPSM3 | SNV | Missense_Mutation | c.70C>T | p.Pro24Ser | p.P24S | Q9Y4H4 | protein_coding | tolerated_low_confidence(0.05) | benign(0.017) | TCGA-AA-A02R-01 | Colorectum | colon adenocarcinoma | Female | >=65 | I/II | Unknown | Unknown | PD | |
| GPSM3 | SNV | Missense_Mutation | c.245C>T | p.Ala82Val | p.A82V | Q9Y4H4 | protein_coding | deleterious(0.04) | possibly_damaging(0.479) | TCGA-NH-A5IV-01 | Colorectum | colon adenocarcinoma | Female | >=65 | I/II | Unknown | Unknown | SD | |
| GPSM3 | SNV | Missense_Mutation | novel | c.101N>A | p.Arg34Gln | p.R34Q | Q9Y4H4 | protein_coding | deleterious_low_confidence(0.05) | probably_damaging(0.953) | TCGA-WS-AB45-01 | Colorectum | colon adenocarcinoma | Female | <65 | I/II | Unknown | Unknown | SD |
| GPSM3 | insertion | Frame_Shift_Ins | novel | c.262_263insC | p.Gln88ProfsTer129 | p.Q88Pfs*129 | Q9Y4H4 | protein_coding | TCGA-F4-6570-01 | Colorectum | colon adenocarcinoma | Female | >=65 | I/II | Unknown | Unknown | SD | ||
| GPSM3 | SNV | Missense_Mutation | novel | c.49N>T | p.Pro17Ser | p.P17S | Q9Y4H4 | protein_coding | tolerated_low_confidence(0.82) | benign(0) | TCGA-DF-A2KN-01 | Endometrium | uterine corpus endometrioid carcinoma | Female | Unknown | I/II | Unknown | Unknown | SD |
| GPSM3 | deletion | Frame_Shift_Del | rs752813848 | c.396delG | p.Gln133LysfsTer8 | p.Q133Kfs*8 | Q9Y4H4 | protein_coding | TCGA-AJ-A2QO-01 | Endometrium | uterine corpus endometrioid carcinoma | Female | >=65 | I/II | Unknown | Unknown | SD |
| Page: 1 2 3 4 |
Top |
Related drugs of malignant transformation related genes |
| Identification of chemicals and drugs interact with genes involved in malignant transfromation |
| (DGIdb 4.0) |
| Entrez ID | Symbol | Category | Interaction Types | Drug Claim Name | Drug Name | PMIDs |
| Page: 1 |

Copyright 2023-Present -The University of Texas Health Science Center at Houston |