
|
|||||
|
 | |
| |
| |
| |
| |
| |
|
Gene: GPSM1 |
Gene summary for GPSM1 |
| Gene information | Species | Human | Gene symbol | GPSM1 | Gene ID | 26086 |
| Gene name | G protein signaling modulator 1 | |
| Gene Alias | AGS3 | |
| Cytomap | 9q34.3 | |
| Gene Type | protein-coding | GO ID | GO:0006914 | UniProtAcc | A0A0A0MSK4 |
Top |
Malignant transformation analysis |
| Identification of the aberrant gene expression in precancerous and cancerous lesions by comparing the gene expression of stem-like cells in diseased tissues with normal stem cells |
| Entrez ID | Symbol | Replicates | Species | Organ | Tissue | Adj P-value | Log2FC | Malignancy |
| 26086 | GPSM1 | male-WTA | Human | Thyroid | PTC | 3.97e-03 | 5.19e-02 | 0.1037 |
| 26086 | GPSM1 | PTC06 | Human | Thyroid | PTC | 2.26e-06 | 1.72e-01 | 0.2057 |
| 26086 | GPSM1 | PTC07 | Human | Thyroid | PTC | 4.28e-04 | 8.30e-02 | 0.2044 |
| 26086 | GPSM1 | ATC09 | Human | Thyroid | ATC | 2.95e-02 | 1.38e-01 | 0.2871 |
| 26086 | GPSM1 | ATC12 | Human | Thyroid | ATC | 5.14e-03 | 8.62e-02 | 0.34 |
| 26086 | GPSM1 | ATC13 | Human | Thyroid | ATC | 1.55e-34 | 5.99e-01 | 0.34 |
| 26086 | GPSM1 | ATC1 | Human | Thyroid | ATC | 1.55e-03 | 1.78e-01 | 0.2878 |
| 26086 | GPSM1 | ATC2 | Human | Thyroid | ATC | 3.71e-05 | 3.58e-01 | 0.34 |
| 26086 | GPSM1 | ATC4 | Human | Thyroid | ATC | 2.34e-04 | 1.15e-01 | 0.34 |
| 26086 | GPSM1 | ATC5 | Human | Thyroid | ATC | 4.80e-33 | 6.47e-01 | 0.34 |
| Page: 1 |
| Tissue | Expression Dynamics | Abbreviation |
| Thyroid | 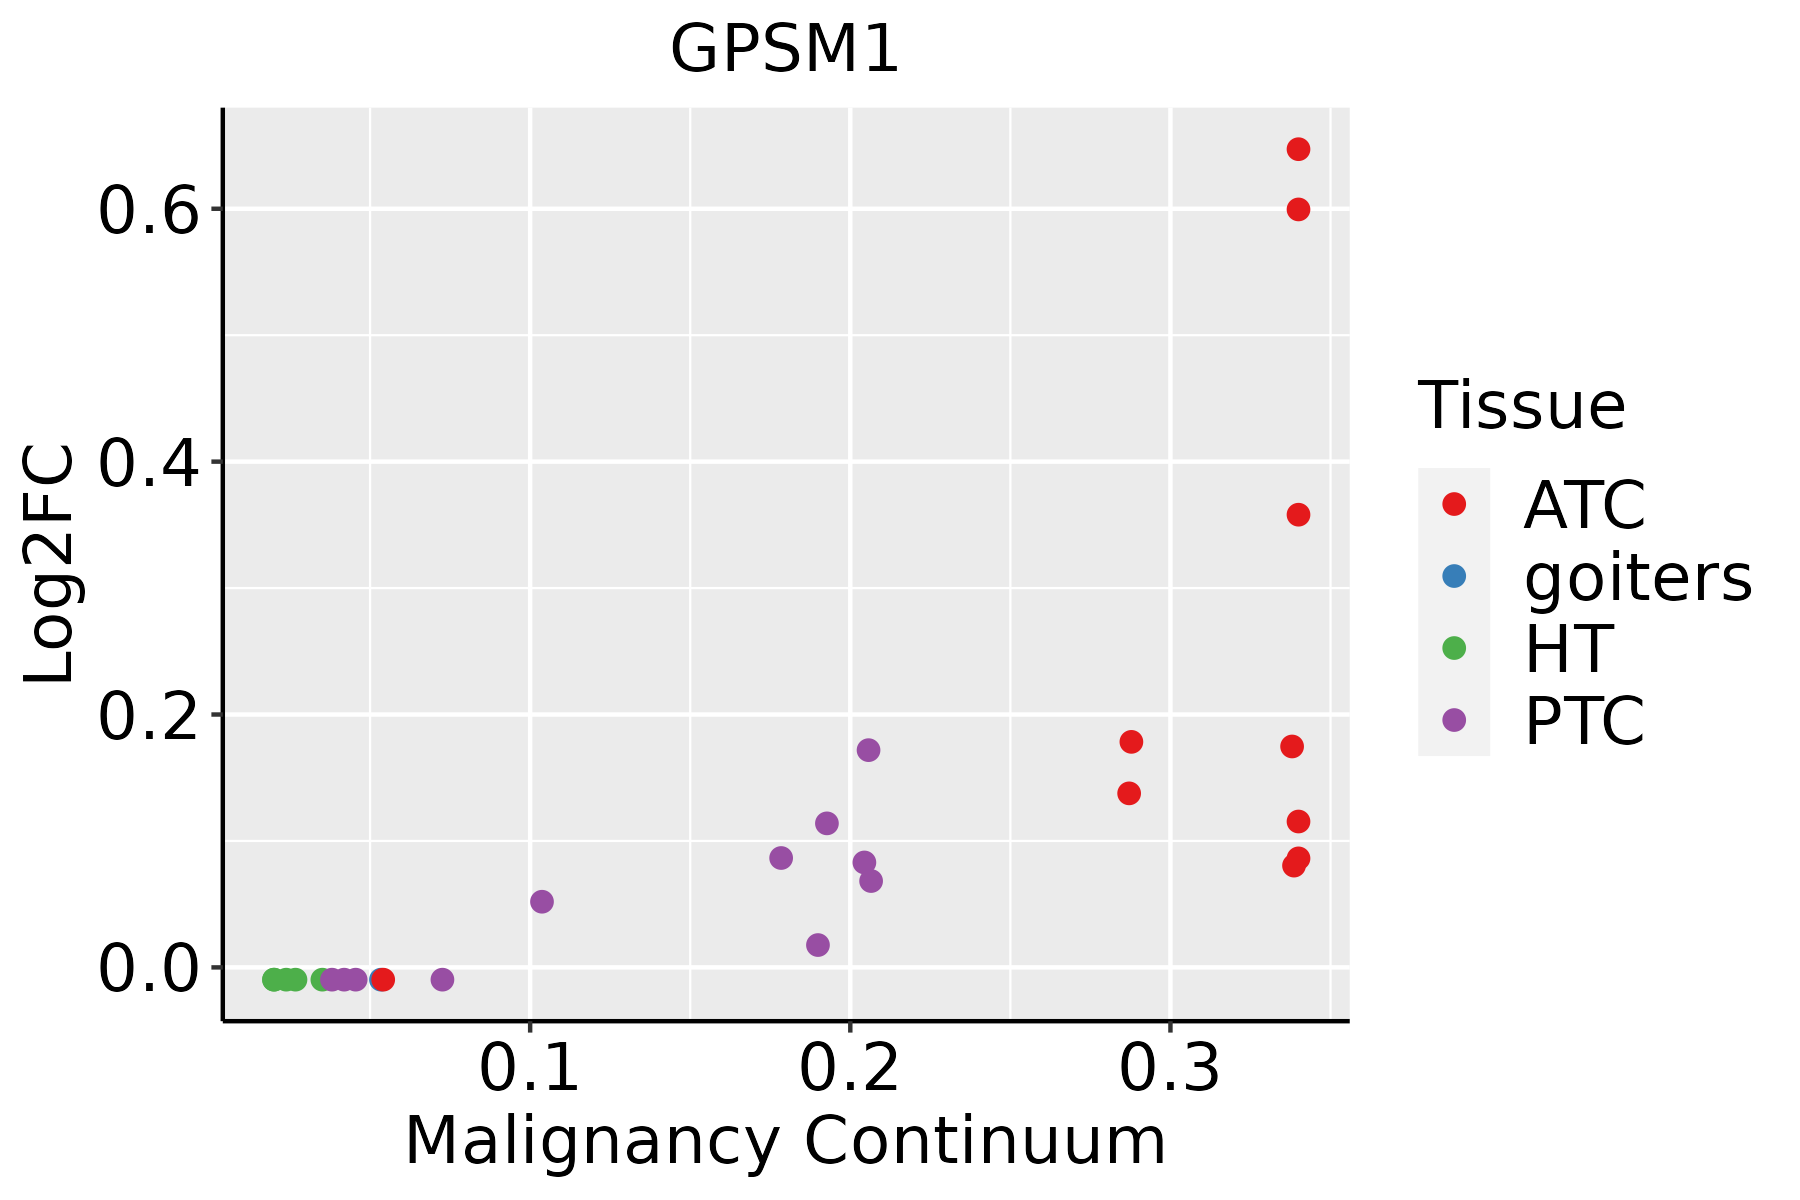 | ATC: Anaplastic thyroid cancer |
| HT: Hashimoto's thyroiditis | ||
| PTC: Papillary thyroid cancer |
| ∗log2FC in expression of this searched gene in stem-like cells from each diseased tissue sample relative to stem-like cells in normal samples in each tissue plotted against the malignancy continuum. Samples are colored based on if they are from different disease stage. |
Top |
Malignant transformation related pathway analysis |
| Find out the enriched GO biological processes and KEGG pathways involved in transition from healthy to precancer to cancer |
| Tissue | Disease Stage | Enriched GO biological Processes |
| Colorectum | AD |  |
| Colorectum | SER |  |
| Colorectum | MSS |  |
| Colorectum | MSI-H |  |
| Colorectum | FAP |  |
| ∗Top 15 enriched GO BP terms are showed in the bar plot of each disease state in each tissue. Each row represents a significant GO biological process which is colored according to the -log10(p.adjust). |
| Page: 1 2 3 4 5 6 7 8 9 |
| GO ID | Tissue | Disease Stage | Description | Gene Ratio | Bg Ratio | pvalue | p.adjust | Count |
| GO:0009896113 | Thyroid | PTC | positive regulation of catabolic process | 278/5968 | 492/18723 | 3.35e-30 | 2.64e-27 | 278 |
| GO:0031331113 | Thyroid | PTC | positive regulation of cellular catabolic process | 249/5968 | 427/18723 | 5.28e-30 | 3.58e-27 | 249 |
| GO:0016236110 | Thyroid | PTC | macroautophagy | 167/5968 | 291/18723 | 1.51e-19 | 1.91e-17 | 167 |
| GO:0051098113 | Thyroid | PTC | regulation of binding | 195/5968 | 363/18723 | 3.21e-18 | 3.37e-16 | 195 |
| GO:0010506110 | Thyroid | PTC | regulation of autophagy | 172/5968 | 317/18723 | 8.76e-17 | 7.57e-15 | 172 |
| GO:0051099113 | Thyroid | PTC | positive regulation of binding | 100/5968 | 173/18723 | 1.56e-12 | 6.96e-11 | 100 |
| GO:001624110 | Thyroid | PTC | regulation of macroautophagy | 84/5968 | 141/18723 | 1.04e-11 | 4.27e-10 | 84 |
| GO:001050810 | Thyroid | PTC | positive regulation of autophagy | 70/5968 | 124/18723 | 1.30e-08 | 3.08e-07 | 70 |
| GO:004308718 | Thyroid | PTC | regulation of GTPase activity | 148/5968 | 348/18723 | 1.63e-05 | 1.71e-04 | 148 |
| GO:00162395 | Thyroid | PTC | positive regulation of macroautophagy | 36/5968 | 63/18723 | 2.98e-05 | 2.86e-04 | 36 |
| GO:1904424 | Thyroid | PTC | regulation of GTP binding | 11/5968 | 15/18723 | 1.19e-03 | 6.84e-03 | 11 |
| GO:0051346112 | Thyroid | PTC | negative regulation of hydrolase activity | 146/5968 | 379/18723 | 3.33e-03 | 1.62e-02 | 146 |
| GO:0009896210 | Thyroid | ATC | positive regulation of catabolic process | 290/6293 | 492/18723 | 2.15e-31 | 1.94e-28 | 290 |
| GO:0031331210 | Thyroid | ATC | positive regulation of cellular catabolic process | 258/6293 | 427/18723 | 2.09e-30 | 1.65e-27 | 258 |
| GO:005109834 | Thyroid | ATC | regulation of binding | 203/6293 | 363/18723 | 1.18e-18 | 1.55e-16 | 203 |
| GO:001623623 | Thyroid | ATC | macroautophagy | 169/6293 | 291/18723 | 6.56e-18 | 7.69e-16 | 169 |
| GO:001050632 | Thyroid | ATC | regulation of autophagy | 180/6293 | 317/18723 | 1.34e-17 | 1.46e-15 | 180 |
| GO:005109934 | Thyroid | ATC | positive regulation of binding | 103/6293 | 173/18723 | 2.19e-12 | 9.05e-11 | 103 |
| GO:001624115 | Thyroid | ATC | regulation of macroautophagy | 86/6293 | 141/18723 | 2.35e-11 | 8.24e-10 | 86 |
| GO:001050817 | Thyroid | ATC | positive regulation of autophagy | 73/6293 | 124/18723 | 6.74e-09 | 1.46e-07 | 73 |
| Page: 1 2 |
| Pathway ID | Tissue | Disease Stage | Description | Gene Ratio | Bg Ratio | pvalue | p.adjust | qvalue | Count |
| Page: 1 |
Top |
Cell-cell communication analysis |
| Identification of potential cell-cell interactions between two cell types and their ligand-receptor pairs for different disease states |
| Ligand | Receptor | LRpair | Pathway | Tissue | Disease Stage |
| Page: 1 |
Top |
Single-cell gene regulatory network inference analysis |
| Find out the significant the regulons (TFs) and the target genes of each regulon across cell types for different disease states |
| TF | Cell Type | Tissue | Disease Stage | Target Gene | RSS | Regulon Activity |
| ∗The dot plots of a searched regulon are shown for all cell subpopulations in each disease state of each tissue based on the regulon specific score inferred using pySCENIC and by calculating the average expression. |
| Page: 1 |
Top |
Somatic mutation of malignant transformation related genes |
| Annotation of somatic variants for genes involved in malignant transformation |
| Hugo Symbol | Variant Class | Variant Classification | dbSNP RS | HGVSc | HGVSp | HGVSp Short | SWISSPROT | BIOTYPE | SIFT | PolyPhen | Tumor Sample Barcode | Tissue | Histology | Sex | Age | Stage | Therapy Types | Drugs | Outcome |
| GPSM1 | SNV | Missense_Mutation | c.178N>A | p.Glu60Lys | p.E60K | protein_coding | deleterious(0) | possibly_damaging(0.884) | TCGA-D8-A1XM-01 | Breast | breast invasive carcinoma | Female | <65 | I/II | Unknown | Unknown | SD | ||
| GPSM1 | deletion | In_Frame_Del | c.918_938delNNNNNNNNNNNNNNNNNNNNN | p.Ala308_Arg314del | p.A308_R314del | protein_coding | TCGA-BH-A0BZ-01 | Breast | breast invasive carcinoma | Female | <65 | III/IV | Chemotherapy | doxorubicin | CR | ||||
| GPSM1 | SNV | Missense_Mutation | novel | c.1807C>T | p.Leu603Phe | p.L603F | protein_coding | deleterious(0) | probably_damaging(0.988) | TCGA-EA-A3HS-01 | Cervix | cervical & endocervical cancer | Female | <65 | I/II | Unknown | Unknown | SD | |
| GPSM1 | SNV | Missense_Mutation | novel | c.982N>A | p.Glu328Lys | p.E328K | protein_coding | deleterious(0) | possibly_damaging(0.614) | TCGA-VS-A9V3-01 | Cervix | cervical & endocervical cancer | Female | <65 | I/II | Chemotherapy | cisplatin | PD | |
| GPSM1 | SNV | Missense_Mutation | c.770N>G | p.Asn257Ser | p.N257S | protein_coding | deleterious(0) | probably_damaging(0.953) | TCGA-A6-5665-01 | Colorectum | colon adenocarcinoma | Female | >=65 | I/II | Unknown | Unknown | PD | ||
| GPSM1 | SNV | Missense_Mutation | rs782663989 | c.1784C>T | p.Pro595Leu | p.P595L | protein_coding | deleterious(0.04) | probably_damaging(1) | TCGA-AU-6004-01 | Colorectum | colon adenocarcinoma | Female | >=65 | I/II | Unknown | Unknown | SD | |
| GPSM1 | SNV | Missense_Mutation | rs782116136 | c.1653N>A | p.Phe551Leu | p.F551L | protein_coding | tolerated(0.36) | benign(0.028) | TCGA-AZ-4315-01 | Colorectum | colon adenocarcinoma | Male | <65 | I/II | Unknown | Unknown | SD | |
| GPSM1 | SNV | Missense_Mutation | rs764332882 | c.1946N>A | p.Arg649Gln | p.R649Q | protein_coding | deleterious(0) | probably_damaging(1) | TCGA-AZ-6601-01 | Colorectum | colon adenocarcinoma | Male | >=65 | I/II | Unknown | Unknown | PD | |
| GPSM1 | SNV | Missense_Mutation | novel | c.967N>A | p.Ala323Thr | p.A323T | protein_coding | tolerated(0.58) | benign(0.02) | TCGA-CK-4951-01 | Colorectum | colon adenocarcinoma | Female | >=65 | I/II | Unknown | Unknown | PD | |
| GPSM1 | SNV | Missense_Mutation | novel | c.1220A>T | p.Lys407Met | p.K407M | protein_coding | deleterious(0.04) | probably_damaging(0.979) | TCGA-CM-4743-01 | Colorectum | colon adenocarcinoma | Male | >=65 | I/II | Chemotherapy | capecitabine | SD |
| Page: 1 2 3 4 5 6 |
Top |
Related drugs of malignant transformation related genes |
| Identification of chemicals and drugs interact with genes involved in malignant transfromation |
| (DGIdb 4.0) |
| Entrez ID | Symbol | Category | Interaction Types | Drug Claim Name | Drug Name | PMIDs |
| Page: 1 |

Copyright 2023-Present -The University of Texas Health Science Center at Houston |