
|
|||||
|
 | |
| |
| |
| |
| |
| |
|
Gene: GPRC5C |
Gene summary for GPRC5C |
| Gene information | Species | Human | Gene symbol | GPRC5C | Gene ID | 55890 |
| Gene name | G protein-coupled receptor class C group 5 member C | |
| Gene Alias | RAIG-3 | |
| Cytomap | 17q25.1 | |
| Gene Type | protein-coding | GO ID | GO:0001932 | UniProtAcc | A0A024R8N9 |
Top |
Malignant transformation analysis |
| Identification of the aberrant gene expression in precancerous and cancerous lesions by comparing the gene expression of stem-like cells in diseased tissues with normal stem cells |
| Entrez ID | Symbol | Replicates | Species | Organ | Tissue | Adj P-value | Log2FC | Malignancy |
| 55890 | GPRC5C | HTA11_2487_2000001011 | Human | Colorectum | SER | 4.64e-04 | 3.67e-01 | -0.1808 |
| 55890 | GPRC5C | HTA11_1938_2000001011 | Human | Colorectum | AD | 1.51e-02 | 3.08e-01 | -0.0811 |
| 55890 | GPRC5C | HTA11_347_2000001011 | Human | Colorectum | AD | 6.56e-16 | 5.47e-01 | -0.1954 |
| 55890 | GPRC5C | HTA11_83_2000001011 | Human | Colorectum | SER | 4.03e-02 | 3.01e-01 | -0.1526 |
| 55890 | GPRC5C | HTA11_696_2000001011 | Human | Colorectum | AD | 9.66e-15 | 4.74e-01 | -0.1464 |
| 55890 | GPRC5C | HTA11_866_2000001011 | Human | Colorectum | AD | 2.64e-09 | 3.96e-01 | -0.1001 |
| 55890 | GPRC5C | HTA11_1391_2000001011 | Human | Colorectum | AD | 7.74e-03 | 3.76e-01 | -0.059 |
| 55890 | GPRC5C | HTA11_5212_2000001011 | Human | Colorectum | AD | 4.58e-04 | 4.66e-01 | -0.2061 |
| 55890 | GPRC5C | HTA11_866_3004761011 | Human | Colorectum | AD | 1.18e-03 | 3.10e-01 | 0.096 |
| 55890 | GPRC5C | HTA11_10623_2000001011 | Human | Colorectum | AD | 1.23e-04 | 3.95e-01 | -0.0177 |
| 55890 | GPRC5C | HTA11_99999971662_82457 | Human | Colorectum | MSS | 9.70e-04 | 2.20e-01 | 0.3859 |
| 55890 | GPRC5C | LZE4T | Human | Esophagus | ESCC | 6.00e-07 | 5.30e-02 | 0.0811 |
| 55890 | GPRC5C | LZE8T | Human | Esophagus | ESCC | 1.64e-04 | 2.38e-01 | 0.067 |
| 55890 | GPRC5C | LZE20T | Human | Esophagus | ESCC | 1.56e-03 | 1.31e-01 | 0.0662 |
| 55890 | GPRC5C | LZE24T | Human | Esophagus | ESCC | 1.76e-10 | 3.06e-01 | 0.0596 |
| 55890 | GPRC5C | LZE21T | Human | Esophagus | ESCC | 2.47e-03 | 1.44e-01 | 0.0655 |
| 55890 | GPRC5C | P1T-E | Human | Esophagus | ESCC | 8.82e-08 | 7.29e-01 | 0.0875 |
| 55890 | GPRC5C | P2T-E | Human | Esophagus | ESCC | 2.26e-21 | 4.48e-01 | 0.1177 |
| 55890 | GPRC5C | P4T-E | Human | Esophagus | ESCC | 2.70e-07 | 1.51e-01 | 0.1323 |
| 55890 | GPRC5C | P5T-E | Human | Esophagus | ESCC | 3.06e-03 | -4.29e-02 | 0.1327 |
| Page: 1 2 3 4 5 |
| Tissue | Expression Dynamics | Abbreviation |
| Colorectum (GSE201348) |  | FAP: Familial adenomatous polyposis |
| CRC: Colorectal cancer | ||
| Colorectum (HTA11) | 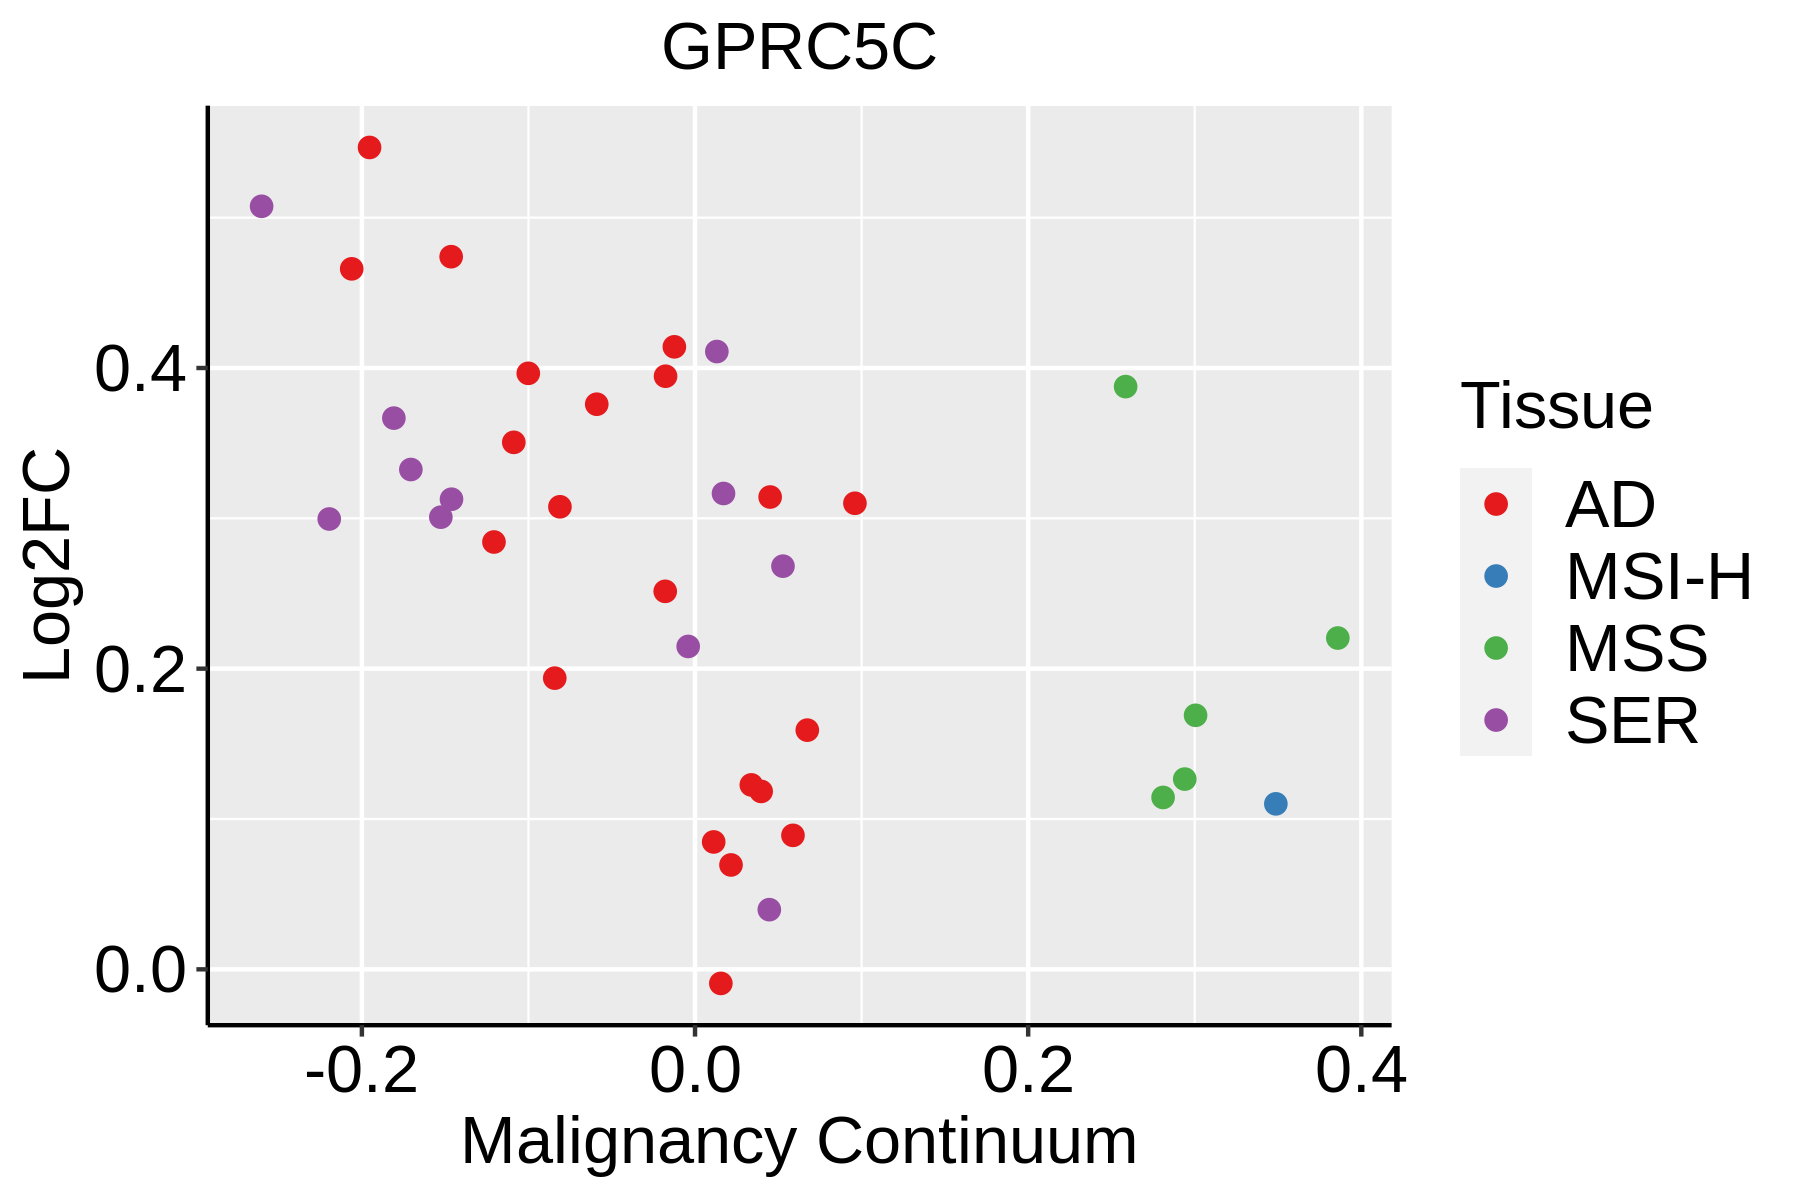 | AD: Adenomas |
| SER: Sessile serrated lesions | ||
| MSI-H: Microsatellite-high colorectal cancer | ||
| MSS: Microsatellite stable colorectal cancer | ||
| Esophagus |  | ESCC: Esophageal squamous cell carcinoma |
| HGIN: High-grade intraepithelial neoplasias | ||
| LGIN: Low-grade intraepithelial neoplasias | ||
| Liver | 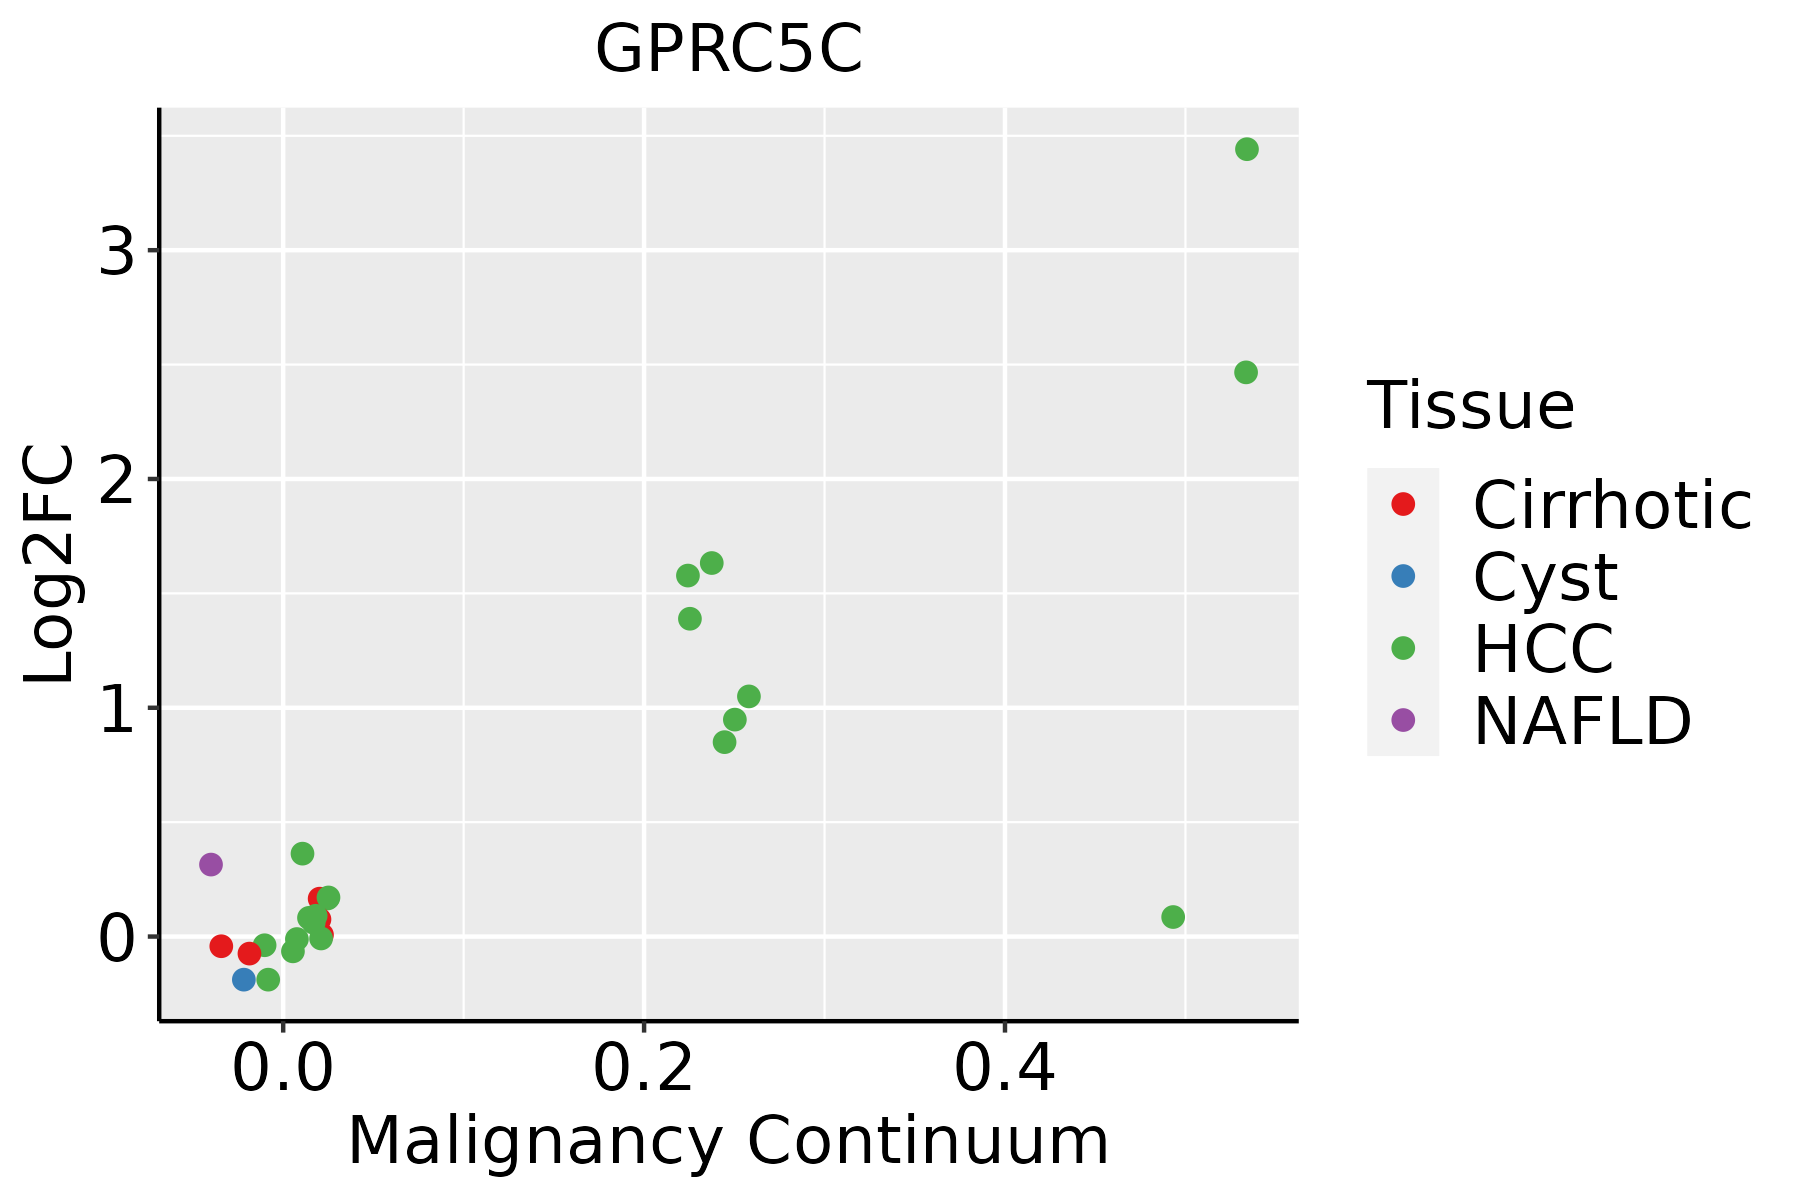 | HCC: Hepatocellular carcinoma |
| NAFLD: Non-alcoholic fatty liver disease | ||
| Skin | 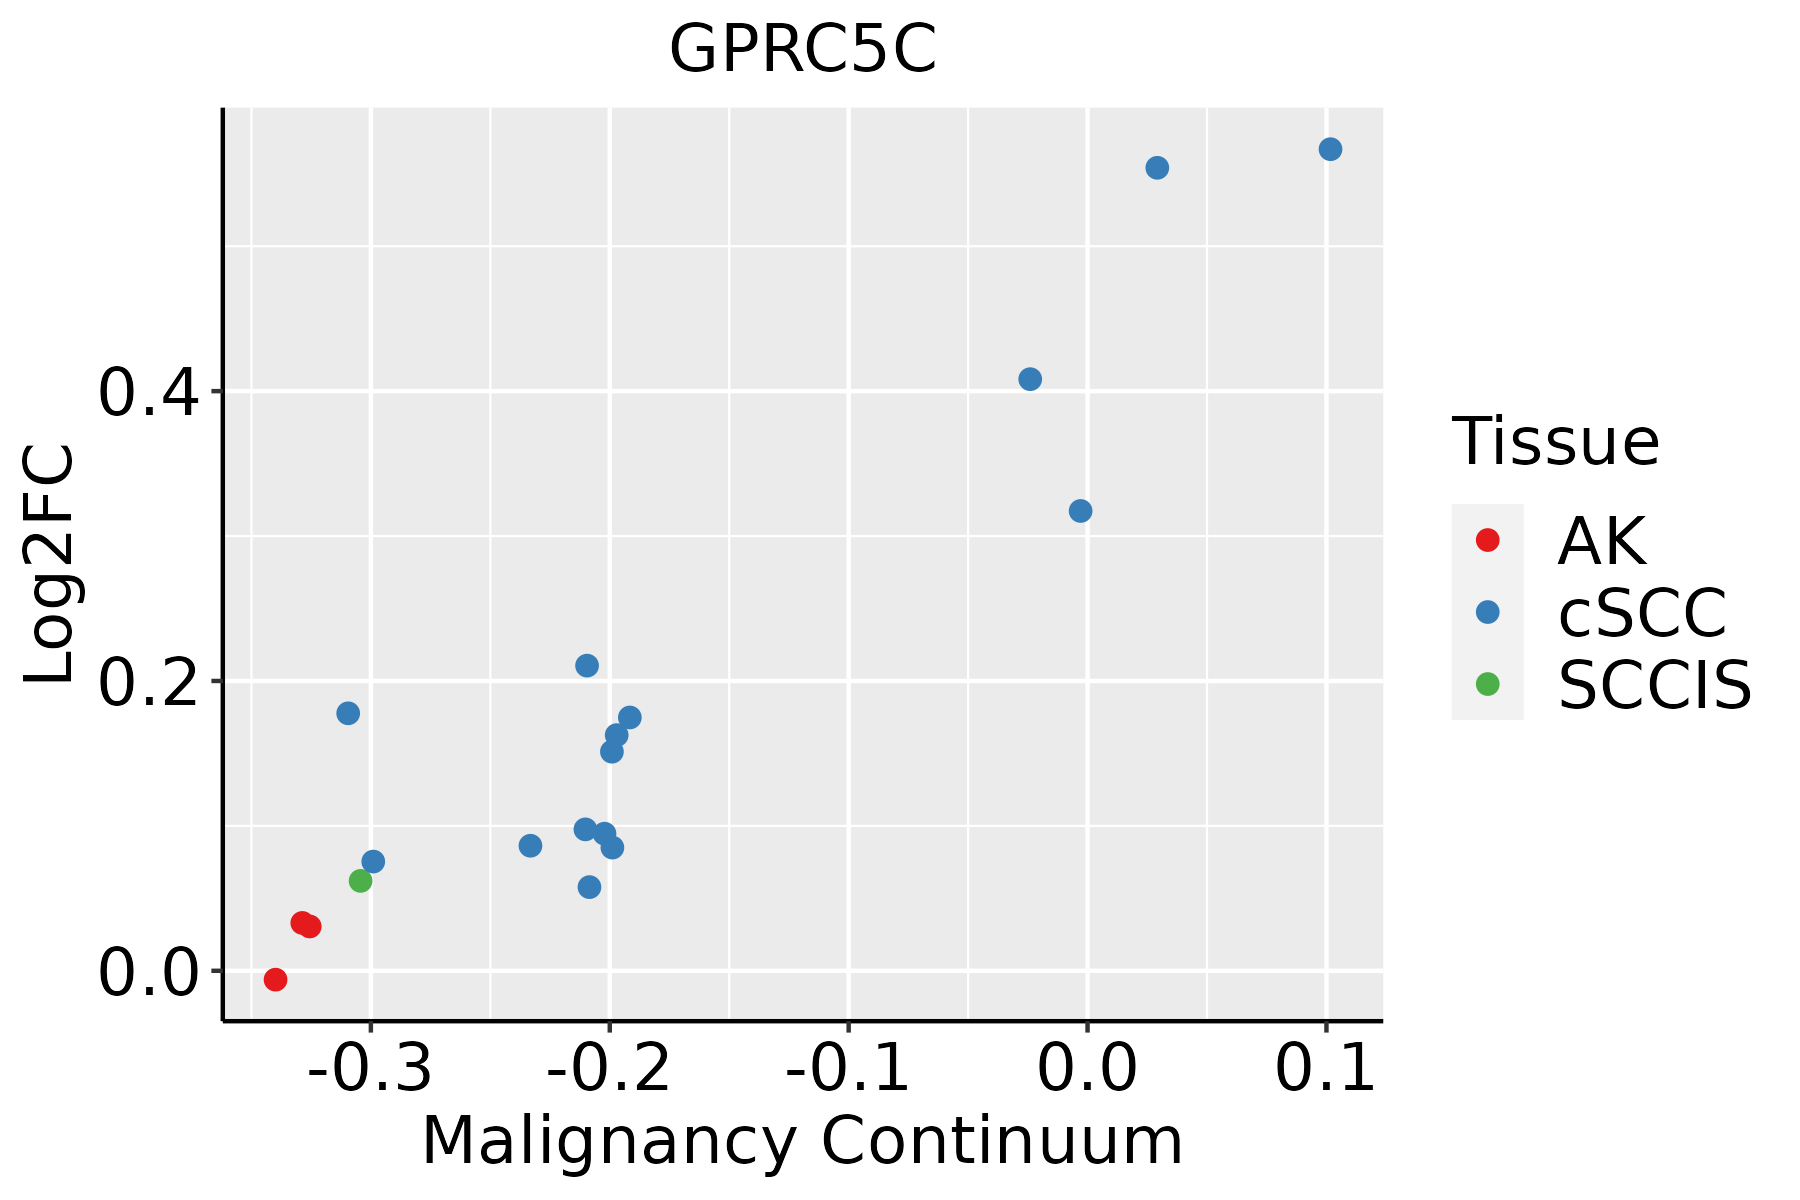 | AK: Actinic keratosis |
| cSCC: Cutaneous squamous cell carcinoma | ||
| SCCIS:squamous cell carcinoma in situ | ||
| Thyroid |  | ATC: Anaplastic thyroid cancer |
| HT: Hashimoto's thyroiditis | ||
| PTC: Papillary thyroid cancer |
| ∗log2FC in expression of this searched gene in stem-like cells from each diseased tissue sample relative to stem-like cells in normal samples in each tissue plotted against the malignancy continuum. Samples are colored based on if they are from different disease stage. |
Top |
Malignant transformation related pathway analysis |
| Find out the enriched GO biological processes and KEGG pathways involved in transition from healthy to precancer to cancer |
| Tissue | Disease Stage | Enriched GO biological Processes |
| Colorectum | AD |  |
| Colorectum | SER |  |
| Colorectum | MSS |  |
| Colorectum | MSI-H |  |
| Colorectum | FAP |  |
| ∗Top 15 enriched GO BP terms are showed in the bar plot of each disease state in each tissue. Each row represents a significant GO biological process which is colored according to the -log10(p.adjust). |
| Page: 1 2 3 4 5 6 7 8 9 |
| GO ID | Tissue | Disease Stage | Description | Gene Ratio | Bg Ratio | pvalue | p.adjust | Count |
| GO:0033674 | Colorectum | AD | positive regulation of kinase activity | 131/3918 | 467/18723 | 1.28e-04 | 1.85e-03 | 131 |
| GO:0045860 | Colorectum | AD | positive regulation of protein kinase activity | 107/3918 | 386/18723 | 8.01e-04 | 7.92e-03 | 107 |
| GO:00336741 | Colorectum | SER | positive regulation of kinase activity | 95/2897 | 467/18723 | 2.62e-03 | 2.41e-02 | 95 |
| GO:00458601 | Colorectum | SER | positive regulation of protein kinase activity | 79/2897 | 386/18723 | 4.85e-03 | 3.79e-02 | 79 |
| GO:00336742 | Colorectum | MSS | positive regulation of kinase activity | 122/3467 | 467/18723 | 2.50e-05 | 5.21e-04 | 122 |
| GO:00458602 | Colorectum | MSS | positive regulation of protein kinase activity | 102/3467 | 386/18723 | 6.93e-05 | 1.20e-03 | 102 |
| GO:004586018 | Esophagus | ESCC | positive regulation of protein kinase activity | 219/8552 | 386/18723 | 6.91e-06 | 6.97e-05 | 219 |
| GO:003367420 | Esophagus | ESCC | positive regulation of kinase activity | 260/8552 | 467/18723 | 7.26e-06 | 7.22e-05 | 260 |
| GO:004586011 | Liver | Cirrhotic | positive regulation of protein kinase activity | 117/4634 | 386/18723 | 7.07e-03 | 3.41e-02 | 117 |
| GO:004586021 | Liver | HCC | positive regulation of protein kinase activity | 194/7958 | 386/18723 | 1.16e-03 | 6.54e-03 | 194 |
| GO:003367411 | Liver | HCC | positive regulation of kinase activity | 230/7958 | 467/18723 | 1.72e-03 | 8.95e-03 | 230 |
| GO:00321471 | Liver | HCC | activation of protein kinase activity | 72/7958 | 134/18723 | 5.61e-03 | 2.33e-02 | 72 |
| GO:003367425 | Skin | cSCC | positive regulation of kinase activity | 148/4864 | 467/18723 | 3.00e-03 | 1.66e-02 | 148 |
| GO:004586025 | Skin | cSCC | positive regulation of protein kinase activity | 123/4864 | 386/18723 | 5.23e-03 | 2.64e-02 | 123 |
| GO:0045860111 | Thyroid | PTC | positive regulation of protein kinase activity | 176/5968 | 386/18723 | 8.89e-09 | 2.17e-07 | 176 |
| GO:0033674111 | Thyroid | PTC | positive regulation of kinase activity | 201/5968 | 467/18723 | 1.95e-07 | 3.54e-06 | 201 |
| GO:00321472 | Thyroid | PTC | activation of protein kinase activity | 60/5968 | 134/18723 | 1.15e-03 | 6.71e-03 | 60 |
| GO:004586026 | Thyroid | ATC | positive regulation of protein kinase activity | 185/6293 | 386/18723 | 3.00e-09 | 7.02e-08 | 185 |
| GO:003367427 | Thyroid | ATC | positive regulation of kinase activity | 212/6293 | 467/18723 | 5.89e-08 | 1.05e-06 | 212 |
| GO:003214711 | Thyroid | ATC | activation of protein kinase activity | 65/6293 | 134/18723 | 2.44e-04 | 1.57e-03 | 65 |
| Page: 1 |
| Pathway ID | Tissue | Disease Stage | Description | Gene Ratio | Bg Ratio | pvalue | p.adjust | qvalue | Count |
| Page: 1 |
Top |
Cell-cell communication analysis |
| Identification of potential cell-cell interactions between two cell types and their ligand-receptor pairs for different disease states |
| Ligand | Receptor | LRpair | Pathway | Tissue | Disease Stage |
| Page: 1 |
Top |
Single-cell gene regulatory network inference analysis |
| Find out the significant the regulons (TFs) and the target genes of each regulon across cell types for different disease states |
| TF | Cell Type | Tissue | Disease Stage | Target Gene | RSS | Regulon Activity |
| ∗The dot plots of a searched regulon are shown for all cell subpopulations in each disease state of each tissue based on the regulon specific score inferred using pySCENIC and by calculating the average expression. |
| Page: 1 |
Top |
Somatic mutation of malignant transformation related genes |
| Annotation of somatic variants for genes involved in malignant transformation |
| Hugo Symbol | Variant Class | Variant Classification | dbSNP RS | HGVSc | HGVSp | HGVSp Short | SWISSPROT | BIOTYPE | SIFT | PolyPhen | Tumor Sample Barcode | Tissue | Histology | Sex | Age | Stage | Therapy Types | Drugs | Outcome |
| GPRC5C | SNV | Missense_Mutation | c.1427N>G | p.Ser476Cys | p.S476C | protein_coding | tolerated_low_confidence(0.19) | possibly_damaging(0.885) | TCGA-AC-A23H-01 | Breast | breast invasive carcinoma | Female | >=65 | I/II | Unknown | Unknown | PD | ||
| GPRC5C | SNV | Missense_Mutation | rs745465035 | c.490N>T | p.Arg164Trp | p.R164W | protein_coding | deleterious(0) | probably_damaging(1) | TCGA-AN-A046-01 | Breast | breast invasive carcinoma | Female | >=65 | I/II | Unknown | Unknown | SD | |
| GPRC5C | SNV | Missense_Mutation | c.1429C>G | p.Gln477Glu | p.Q477E | protein_coding | deleterious_low_confidence(0.01) | benign(0.431) | TCGA-EK-A3GJ-01 | Cervix | cervical & endocervical cancer | Female | <65 | I/II | Unknown | Unknown | SD | ||
| GPRC5C | SNV | Missense_Mutation | c.1274N>C | p.Lys425Thr | p.K425T | protein_coding | deleterious(0) | probably_damaging(0.913) | TCGA-A6-6142-01 | Colorectum | colon adenocarcinoma | Female | <65 | I/II | Chemotherapy | fluorouracil | PD | ||
| GPRC5C | SNV | Missense_Mutation | rs551384896 | c.269N>A | p.Arg90His | p.R90H | protein_coding | deleterious(0) | possibly_damaging(0.795) | TCGA-AA-3855-01 | Colorectum | colon adenocarcinoma | Male | >=65 | I/II | Unknown | Unknown | SD | |
| GPRC5C | SNV | Missense_Mutation | rs374834578 | c.676N>T | p.Arg226Trp | p.R226W | protein_coding | deleterious(0) | probably_damaging(1) | TCGA-CA-6717-01 | Colorectum | colon adenocarcinoma | Male | <65 | I/II | Chemotherapy | oxaliplatin | CR | |
| GPRC5C | SNV | Missense_Mutation | c.201G>T | p.Trp67Cys | p.W67C | protein_coding | tolerated(0.19) | possibly_damaging(0.579) | TCGA-D5-6928-01 | Colorectum | colon adenocarcinoma | Male | >=65 | I/II | Unknown | Unknown | SD | ||
| GPRC5C | SNV | Missense_Mutation | c.824C>A | p.Ala275Asp | p.A275D | protein_coding | deleterious(0.02) | possibly_damaging(0.642) | TCGA-AG-A01W-01 | Colorectum | rectum adenocarcinoma | Female | >=65 | I/II | Chemotherapy | 5-fluorouracil | CR | ||
| GPRC5C | SNV | Missense_Mutation | rs775061799 | c.892N>A | p.Val298Ile | p.V298I | protein_coding | tolerated(1) | benign(0.003) | TCGA-EI-6882-01 | Colorectum | rectum adenocarcinoma | Male | <65 | I/II | Unknown | Unknown | SD | |
| GPRC5C | SNV | Missense_Mutation | rs751199319 | c.688N>A | p.Glu230Lys | p.E230K | protein_coding | tolerated(0.78) | benign(0.005) | TCGA-EI-6917-01 | Colorectum | rectum adenocarcinoma | Male | <65 | III/IV | Chemotherapy | 5fluorouracil+oxaciplatina+l-folinian | SD |
| Page: 1 2 3 4 5 6 |
Top |
Related drugs of malignant transformation related genes |
| Identification of chemicals and drugs interact with genes involved in malignant transfromation |
| (DGIdb 4.0) |
| Entrez ID | Symbol | Category | Interaction Types | Drug Claim Name | Drug Name | PMIDs |
| Page: 1 |

Copyright 2023-Present -The University of Texas Health Science Center at Houston |