
|
|||||
|
 | |
| |
| |
| |
| |
| |
|
Gene: GPRC5B |
Gene summary for GPRC5B |
| Gene information | Species | Human | Gene symbol | GPRC5B | Gene ID | 51704 |
| Gene name | G protein-coupled receptor class C group 5 member B | |
| Gene Alias | RAIG-2 | |
| Cytomap | 16p12.3 | |
| Gene Type | protein-coding | GO ID | GO:0001816 | UniProtAcc | B7Z831 |
Top |
Malignant transformation analysis |
| Identification of the aberrant gene expression in precancerous and cancerous lesions by comparing the gene expression of stem-like cells in diseased tissues with normal stem cells |
| Entrez ID | Symbol | Replicates | Species | Organ | Tissue | Adj P-value | Log2FC | Malignancy |
| 51704 | GPRC5B | P2T-E | Human | Esophagus | ESCC | 1.09e-27 | 5.65e-01 | 0.1177 |
| 51704 | GPRC5B | P4T-E | Human | Esophagus | ESCC | 3.25e-06 | 1.55e-01 | 0.1323 |
| 51704 | GPRC5B | P5T-E | Human | Esophagus | ESCC | 9.48e-06 | 1.30e-02 | 0.1327 |
| 51704 | GPRC5B | P8T-E | Human | Esophagus | ESCC | 9.71e-27 | 4.03e-01 | 0.0889 |
| 51704 | GPRC5B | P10T-E | Human | Esophagus | ESCC | 1.79e-03 | 4.37e-02 | 0.116 |
| 51704 | GPRC5B | P12T-E | Human | Esophagus | ESCC | 2.75e-15 | 4.00e-01 | 0.1122 |
| 51704 | GPRC5B | P15T-E | Human | Esophagus | ESCC | 7.43e-24 | 5.59e-01 | 0.1149 |
| 51704 | GPRC5B | P16T-E | Human | Esophagus | ESCC | 1.18e-28 | 6.91e-01 | 0.1153 |
| 51704 | GPRC5B | P22T-E | Human | Esophagus | ESCC | 2.53e-04 | 1.04e-01 | 0.1236 |
| 51704 | GPRC5B | P26T-E | Human | Esophagus | ESCC | 3.99e-20 | 3.35e-01 | 0.1276 |
| 51704 | GPRC5B | P27T-E | Human | Esophagus | ESCC | 4.77e-11 | 3.23e-01 | 0.1055 |
| 51704 | GPRC5B | P28T-E | Human | Esophagus | ESCC | 6.72e-06 | 5.81e-02 | 0.1149 |
| 51704 | GPRC5B | P30T-E | Human | Esophagus | ESCC | 5.40e-13 | 5.37e-01 | 0.137 |
| 51704 | GPRC5B | P31T-E | Human | Esophagus | ESCC | 7.16e-07 | 7.22e-02 | 0.1251 |
| 51704 | GPRC5B | P37T-E | Human | Esophagus | ESCC | 9.00e-05 | 3.95e-02 | 0.1371 |
| 51704 | GPRC5B | P40T-E | Human | Esophagus | ESCC | 3.33e-02 | 2.16e-01 | 0.109 |
| 51704 | GPRC5B | P42T-E | Human | Esophagus | ESCC | 7.38e-03 | 1.20e-01 | 0.1175 |
| 51704 | GPRC5B | P48T-E | Human | Esophagus | ESCC | 9.75e-04 | 1.33e-01 | 0.0959 |
| 51704 | GPRC5B | P49T-E | Human | Esophagus | ESCC | 1.09e-03 | 1.04e+00 | 0.1768 |
| 51704 | GPRC5B | P54T-E | Human | Esophagus | ESCC | 2.21e-02 | 3.52e-02 | 0.0975 |
| Page: 1 2 |
| Tissue | Expression Dynamics | Abbreviation |
| Esophagus | 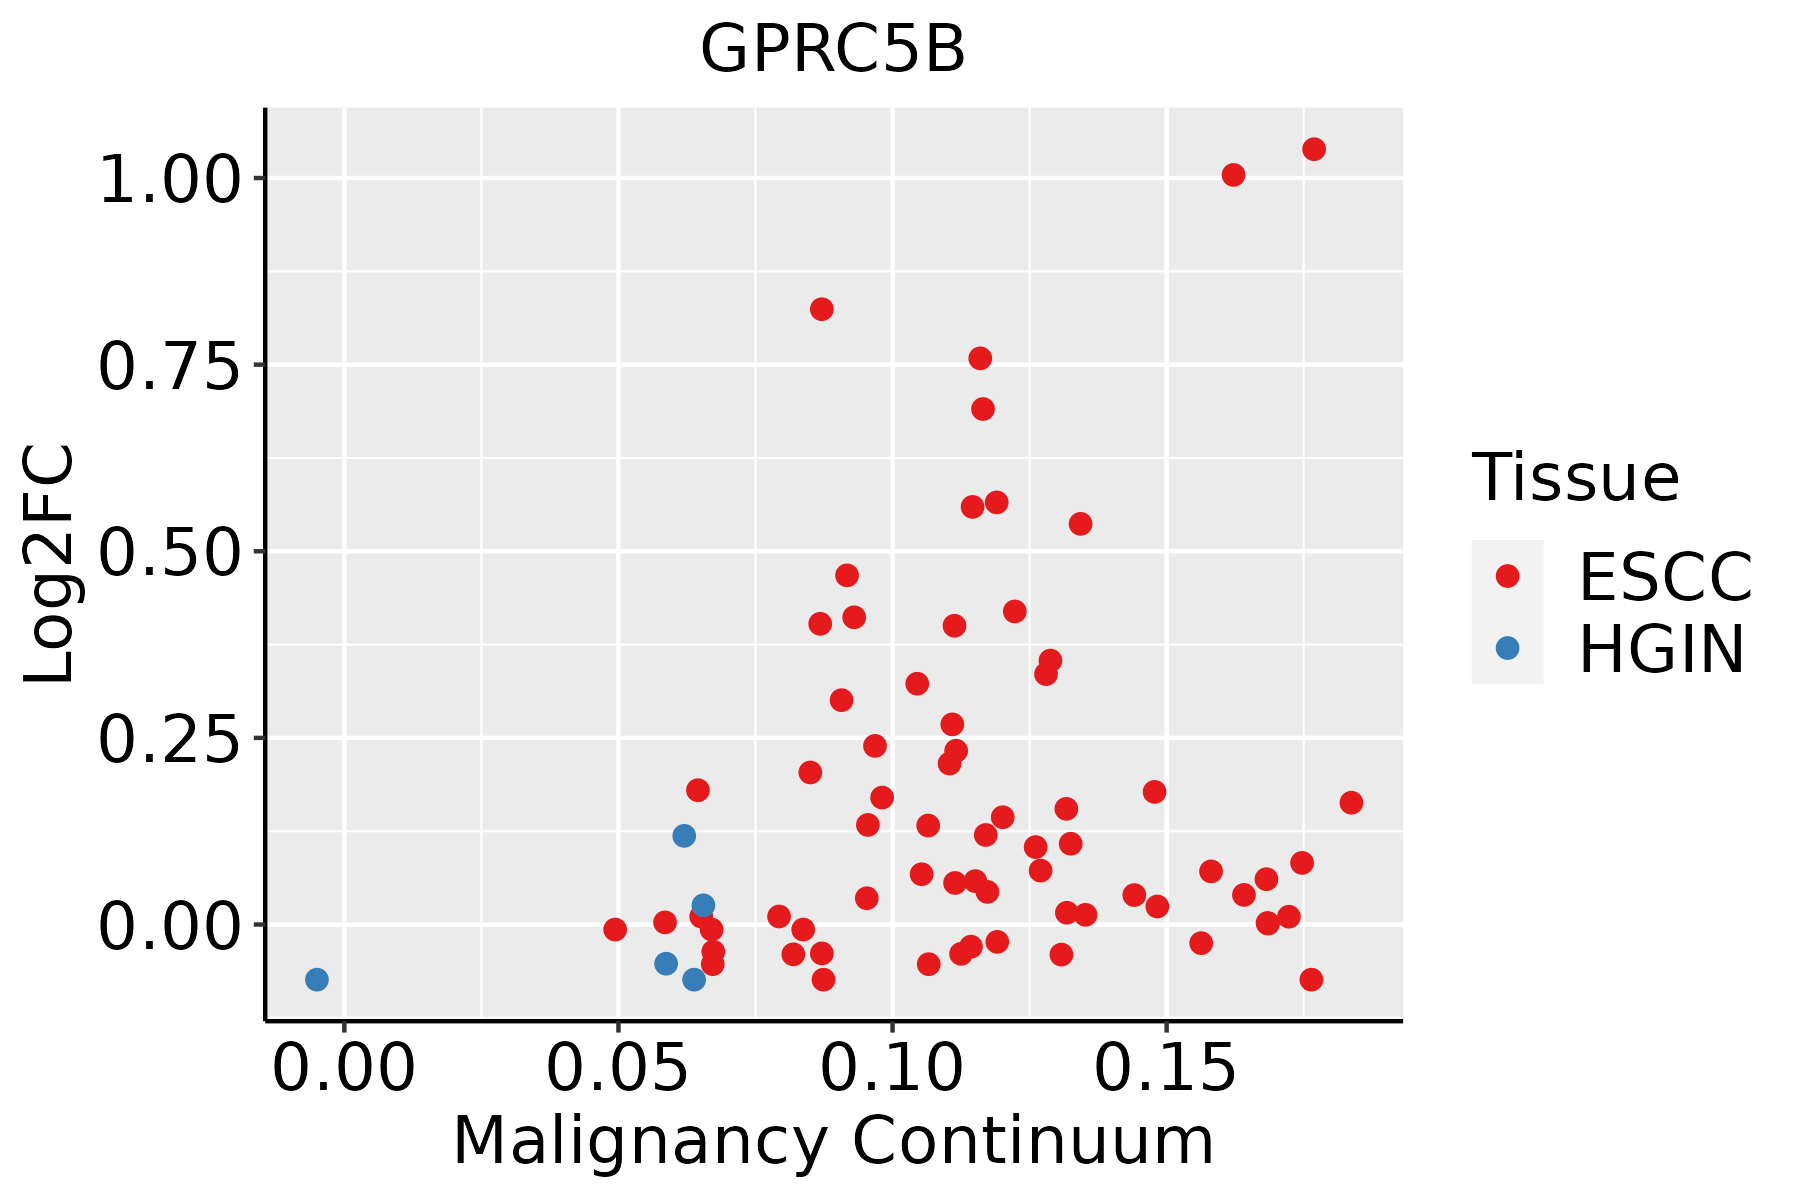 | ESCC: Esophageal squamous cell carcinoma |
| HGIN: High-grade intraepithelial neoplasias | ||
| LGIN: Low-grade intraepithelial neoplasias | ||
| Thyroid |  | ATC: Anaplastic thyroid cancer |
| HT: Hashimoto's thyroiditis | ||
| PTC: Papillary thyroid cancer |
| ∗log2FC in expression of this searched gene in stem-like cells from each diseased tissue sample relative to stem-like cells in normal samples in each tissue plotted against the malignancy continuum. Samples are colored based on if they are from different disease stage. |
Top |
Malignant transformation related pathway analysis |
| Find out the enriched GO biological processes and KEGG pathways involved in transition from healthy to precancer to cancer |
| Tissue | Disease Stage | Enriched GO biological Processes |
| Colorectum | AD |  |
| Colorectum | SER |  |
| Colorectum | MSS |  |
| Colorectum | MSI-H |  |
| Colorectum | FAP |  |
| ∗Top 15 enriched GO BP terms are showed in the bar plot of each disease state in each tissue. Each row represents a significant GO biological process which is colored according to the -log10(p.adjust). |
| Page: 1 2 3 4 5 6 7 8 9 |
| GO ID | Tissue | Disease Stage | Description | Gene Ratio | Bg Ratio | pvalue | p.adjust | Count |
| GO:004312318 | Esophagus | ESCC | positive regulation of I-kappaB kinase/NF-kappaB signaling | 132/8552 | 186/18723 | 2.07e-12 | 8.58e-11 | 132 |
| GO:0043122110 | Esophagus | ESCC | regulation of I-kappaB kinase/NF-kappaB signaling | 167/8552 | 249/18723 | 6.11e-12 | 2.32e-10 | 167 |
| GO:000724919 | Esophagus | ESCC | I-kappaB kinase/NF-kappaB signaling | 183/8552 | 281/18723 | 3.02e-11 | 1.01e-09 | 183 |
| GO:001605517 | Esophagus | ESCC | Wnt signaling pathway | 268/8552 | 444/18723 | 2.32e-10 | 6.58e-09 | 268 |
| GO:019873817 | Esophagus | ESCC | cell-cell signaling by wnt | 269/8552 | 446/18723 | 2.41e-10 | 6.79e-09 | 269 |
| GO:003011117 | Esophagus | ESCC | regulation of Wnt signaling pathway | 194/8552 | 328/18723 | 5.39e-07 | 7.14e-06 | 194 |
| GO:006007016 | Esophagus | ESCC | canonical Wnt signaling pathway | 180/8552 | 303/18723 | 9.15e-07 | 1.17e-05 | 180 |
| GO:006082817 | Esophagus | ESCC | regulation of canonical Wnt signaling pathway | 153/8552 | 253/18723 | 1.38e-06 | 1.67e-05 | 153 |
| GO:004586018 | Esophagus | ESCC | positive regulation of protein kinase activity | 219/8552 | 386/18723 | 6.91e-06 | 6.97e-05 | 219 |
| GO:003367420 | Esophagus | ESCC | positive regulation of kinase activity | 260/8552 | 467/18723 | 7.26e-06 | 7.22e-05 | 260 |
| GO:009026316 | Esophagus | ESCC | positive regulation of canonical Wnt signaling pathway | 69/8552 | 106/18723 | 4.22e-05 | 3.39e-04 | 69 |
| GO:003017716 | Esophagus | ESCC | positive regulation of Wnt signaling pathway | 87/8552 | 140/18723 | 6.18e-05 | 4.73e-04 | 87 |
| GO:00182124 | Esophagus | ESCC | peptidyl-tyrosine modification | 202/8552 | 378/18723 | 1.34e-03 | 6.39e-03 | 202 |
| GO:00181084 | Esophagus | ESCC | peptidyl-tyrosine phosphorylation | 200/8552 | 375/18723 | 1.60e-03 | 7.45e-03 | 200 |
| GO:00507303 | Esophagus | ESCC | regulation of peptidyl-tyrosine phosphorylation | 144/8552 | 264/18723 | 2.22e-03 | 9.78e-03 | 144 |
| GO:00610972 | Esophagus | ESCC | regulation of protein tyrosine kinase activity | 55/8552 | 90/18723 | 2.27e-03 | 9.99e-03 | 55 |
| GO:000181916 | Esophagus | ESCC | positive regulation of cytokine production | 244/8552 | 467/18723 | 2.29e-03 | 1.01e-02 | 244 |
| GO:0016055110 | Thyroid | PTC | Wnt signaling pathway | 217/5968 | 444/18723 | 3.71e-14 | 2.30e-12 | 217 |
| GO:0198738110 | Thyroid | PTC | cell-cell signaling by wnt | 217/5968 | 446/18723 | 6.68e-14 | 3.73e-12 | 217 |
| GO:0030111110 | Thyroid | PTC | regulation of Wnt signaling pathway | 163/5968 | 328/18723 | 1.05e-11 | 4.29e-10 | 163 |
| Page: 1 2 3 |
| Pathway ID | Tissue | Disease Stage | Description | Gene Ratio | Bg Ratio | pvalue | p.adjust | qvalue | Count |
| Page: 1 |
Top |
Cell-cell communication analysis |
| Identification of potential cell-cell interactions between two cell types and their ligand-receptor pairs for different disease states |
| Ligand | Receptor | LRpair | Pathway | Tissue | Disease Stage |
| Page: 1 |
Top |
Single-cell gene regulatory network inference analysis |
| Find out the significant the regulons (TFs) and the target genes of each regulon across cell types for different disease states |
| TF | Cell Type | Tissue | Disease Stage | Target Gene | RSS | Regulon Activity |
| ∗The dot plots of a searched regulon are shown for all cell subpopulations in each disease state of each tissue based on the regulon specific score inferred using pySCENIC and by calculating the average expression. |
| Page: 1 |
Top |
Somatic mutation of malignant transformation related genes |
| Annotation of somatic variants for genes involved in malignant transformation |
| Hugo Symbol | Variant Class | Variant Classification | dbSNP RS | HGVSc | HGVSp | HGVSp Short | SWISSPROT | BIOTYPE | SIFT | PolyPhen | Tumor Sample Barcode | Tissue | Histology | Sex | Age | Stage | Therapy Types | Drugs | Outcome |
| GPRC5B | SNV | Missense_Mutation | c.27N>A | p.Met9Ile | p.M9I | Q9NZH0 | protein_coding | deleterious(0.01) | possibly_damaging(0.885) | TCGA-AC-A23H-01 | Breast | breast invasive carcinoma | Female | >=65 | I/II | Unknown | Unknown | PD | |
| GPRC5B | insertion | Frame_Shift_Ins | novel | c.882_883insTT | p.Thr295LeufsTer114 | p.T295Lfs*114 | Q9NZH0 | protein_coding | TCGA-A8-A0A4-01 | Breast | breast invasive carcinoma | Female | >=65 | I/II | Hormone Therapy | tamoxiphen | CR | ||
| GPRC5B | insertion | Frame_Shift_Ins | novel | c.881_882insGGTTGTTTGTTTGTCTGTTTGTTTGAGACAGATTTTCGCT | p.Cys294TrpfsTer60 | p.C294Wfs*60 | Q9NZH0 | protein_coding | TCGA-A8-A0A4-01 | Breast | breast invasive carcinoma | Female | >=65 | I/II | Hormone Therapy | tamoxiphen | CR | ||
| GPRC5B | deletion | In_Frame_Del | c.187_204delGCCGGGGCGGGCGCCCTG | p.Ala63_Leu68del | p.A63_L68del | Q9NZH0 | protein_coding | TCGA-E2-A158-01 | Breast | breast invasive carcinoma | Female | <65 | I/II | Chemotherapy | arimidex | SD | |||
| GPRC5B | deletion | Frame_Shift_Del | novel | c.915delC | p.Asn306ThrfsTer102 | p.N306Tfs*102 | Q9NZH0 | protein_coding | TCGA-EW-A2FV-01 | Breast | breast invasive carcinoma | Female | <65 | III/IV | Chemotherapy | docetaxel | SD | ||
| GPRC5B | SNV | Missense_Mutation | rs760463381 | c.1105G>A | p.Ala369Thr | p.A369T | Q9NZH0 | protein_coding | tolerated(0.11) | benign(0.207) | TCGA-2W-A8YY-01 | Cervix | cervical & endocervical cancer | Female | <65 | I/II | Chemotherapy | cisplatin | CR |
| GPRC5B | SNV | Missense_Mutation | rs148205185 | c.355G>A | p.Glu119Lys | p.E119K | Q9NZH0 | protein_coding | tolerated(0.24) | probably_damaging(0.995) | TCGA-EK-A2PG-01 | Cervix | cervical & endocervical cancer | Female | >=65 | I/II | Unknown | Unknown | SD |
| GPRC5B | SNV | Missense_Mutation | c.622N>C | p.Met208Leu | p.M208L | Q9NZH0 | protein_coding | tolerated(0.42) | possibly_damaging(0.881) | TCGA-EK-A2RA-01 | Cervix | cervical & endocervical cancer | Female | >=65 | I/II | Unknown | Unknown | SD | |
| GPRC5B | SNV | Missense_Mutation | novel | c.34N>T | p.His12Tyr | p.H12Y | Q9NZH0 | protein_coding | tolerated(0.54) | benign(0) | TCGA-MA-AA3W-01 | Cervix | cervical & endocervical cancer | Female | <65 | I/II | Chemotherapy | cisplatin | CR |
| GPRC5B | SNV | Missense_Mutation | novel | c.751N>G | p.Met251Val | p.M251V | Q9NZH0 | protein_coding | tolerated(0.2) | benign(0.013) | TCGA-A6-2686-01 | Colorectum | colon adenocarcinoma | Female | >=65 | I/II | Unknown | Unknown | SD |
| Page: 1 2 3 4 5 6 7 |
Top |
Related drugs of malignant transformation related genes |
| Identification of chemicals and drugs interact with genes involved in malignant transfromation |
| (DGIdb 4.0) |
| Entrez ID | Symbol | Category | Interaction Types | Drug Claim Name | Drug Name | PMIDs |
| Page: 1 |

Copyright 2023-Present -The University of Texas Health Science Center at Houston |