
|
|||||
|
 | |
| |
| |
| |
| |
| |
|
Gene: GPR89A |
Gene summary for GPR89A |
| Gene information | Species | Human | Gene symbol | GPR89A | Gene ID | 653519 |
| Gene name | G protein-coupled receptor 89A | |
| Gene Alias | GPHR | |
| Cytomap | 1q21.1 | |
| Gene Type | protein-coding | GO ID | GO:0001775 | UniProtAcc | B7ZAQ6 |
Top |
Malignant transformation analysis |
| Identification of the aberrant gene expression in precancerous and cancerous lesions by comparing the gene expression of stem-like cells in diseased tissues with normal stem cells |
| Entrez ID | Symbol | Replicates | Species | Organ | Tissue | Adj P-value | Log2FC | Malignancy |
| 653519 | GPR89A | LZE4T | Human | Esophagus | ESCC | 2.43e-06 | 3.72e-01 | 0.0811 |
| 653519 | GPR89A | LZE5T | Human | Esophagus | ESCC | 5.04e-06 | 3.97e-01 | 0.0514 |
| 653519 | GPR89A | LZE7T | Human | Esophagus | ESCC | 1.13e-07 | 3.24e-01 | 0.0667 |
| 653519 | GPR89A | LZE8T | Human | Esophagus | ESCC | 1.33e-03 | 1.24e-01 | 0.067 |
| 653519 | GPR89A | LZE20T | Human | Esophagus | ESCC | 2.80e-02 | 1.75e-01 | 0.0662 |
| 653519 | GPR89A | LZE24T | Human | Esophagus | ESCC | 5.89e-13 | 2.86e-01 | 0.0596 |
| 653519 | GPR89A | LZE6T | Human | Esophagus | ESCC | 2.29e-03 | 2.68e-01 | 0.0845 |
| 653519 | GPR89A | P2T-E | Human | Esophagus | ESCC | 5.02e-33 | 5.29e-01 | 0.1177 |
| 653519 | GPR89A | P4T-E | Human | Esophagus | ESCC | 1.52e-18 | 4.75e-01 | 0.1323 |
| 653519 | GPR89A | P5T-E | Human | Esophagus | ESCC | 2.37e-22 | 3.57e-01 | 0.1327 |
| 653519 | GPR89A | P8T-E | Human | Esophagus | ESCC | 5.82e-17 | 2.26e-01 | 0.0889 |
| 653519 | GPR89A | P9T-E | Human | Esophagus | ESCC | 3.34e-06 | 2.53e-01 | 0.1131 |
| 653519 | GPR89A | P10T-E | Human | Esophagus | ESCC | 7.83e-29 | 4.50e-01 | 0.116 |
| 653519 | GPR89A | P11T-E | Human | Esophagus | ESCC | 2.48e-12 | 5.07e-01 | 0.1426 |
| 653519 | GPR89A | P12T-E | Human | Esophagus | ESCC | 6.67e-22 | 3.38e-01 | 0.1122 |
| 653519 | GPR89A | P15T-E | Human | Esophagus | ESCC | 5.09e-18 | 4.65e-01 | 0.1149 |
| 653519 | GPR89A | P16T-E | Human | Esophagus | ESCC | 8.49e-21 | 4.59e-01 | 0.1153 |
| 653519 | GPR89A | P17T-E | Human | Esophagus | ESCC | 4.88e-06 | 3.44e-01 | 0.1278 |
| 653519 | GPR89A | P19T-E | Human | Esophagus | ESCC | 4.39e-03 | 2.39e-01 | 0.1662 |
| 653519 | GPR89A | P20T-E | Human | Esophagus | ESCC | 9.37e-20 | 4.50e-01 | 0.1124 |
| Page: 1 2 3 4 |
| Tissue | Expression Dynamics | Abbreviation |
| Esophagus | 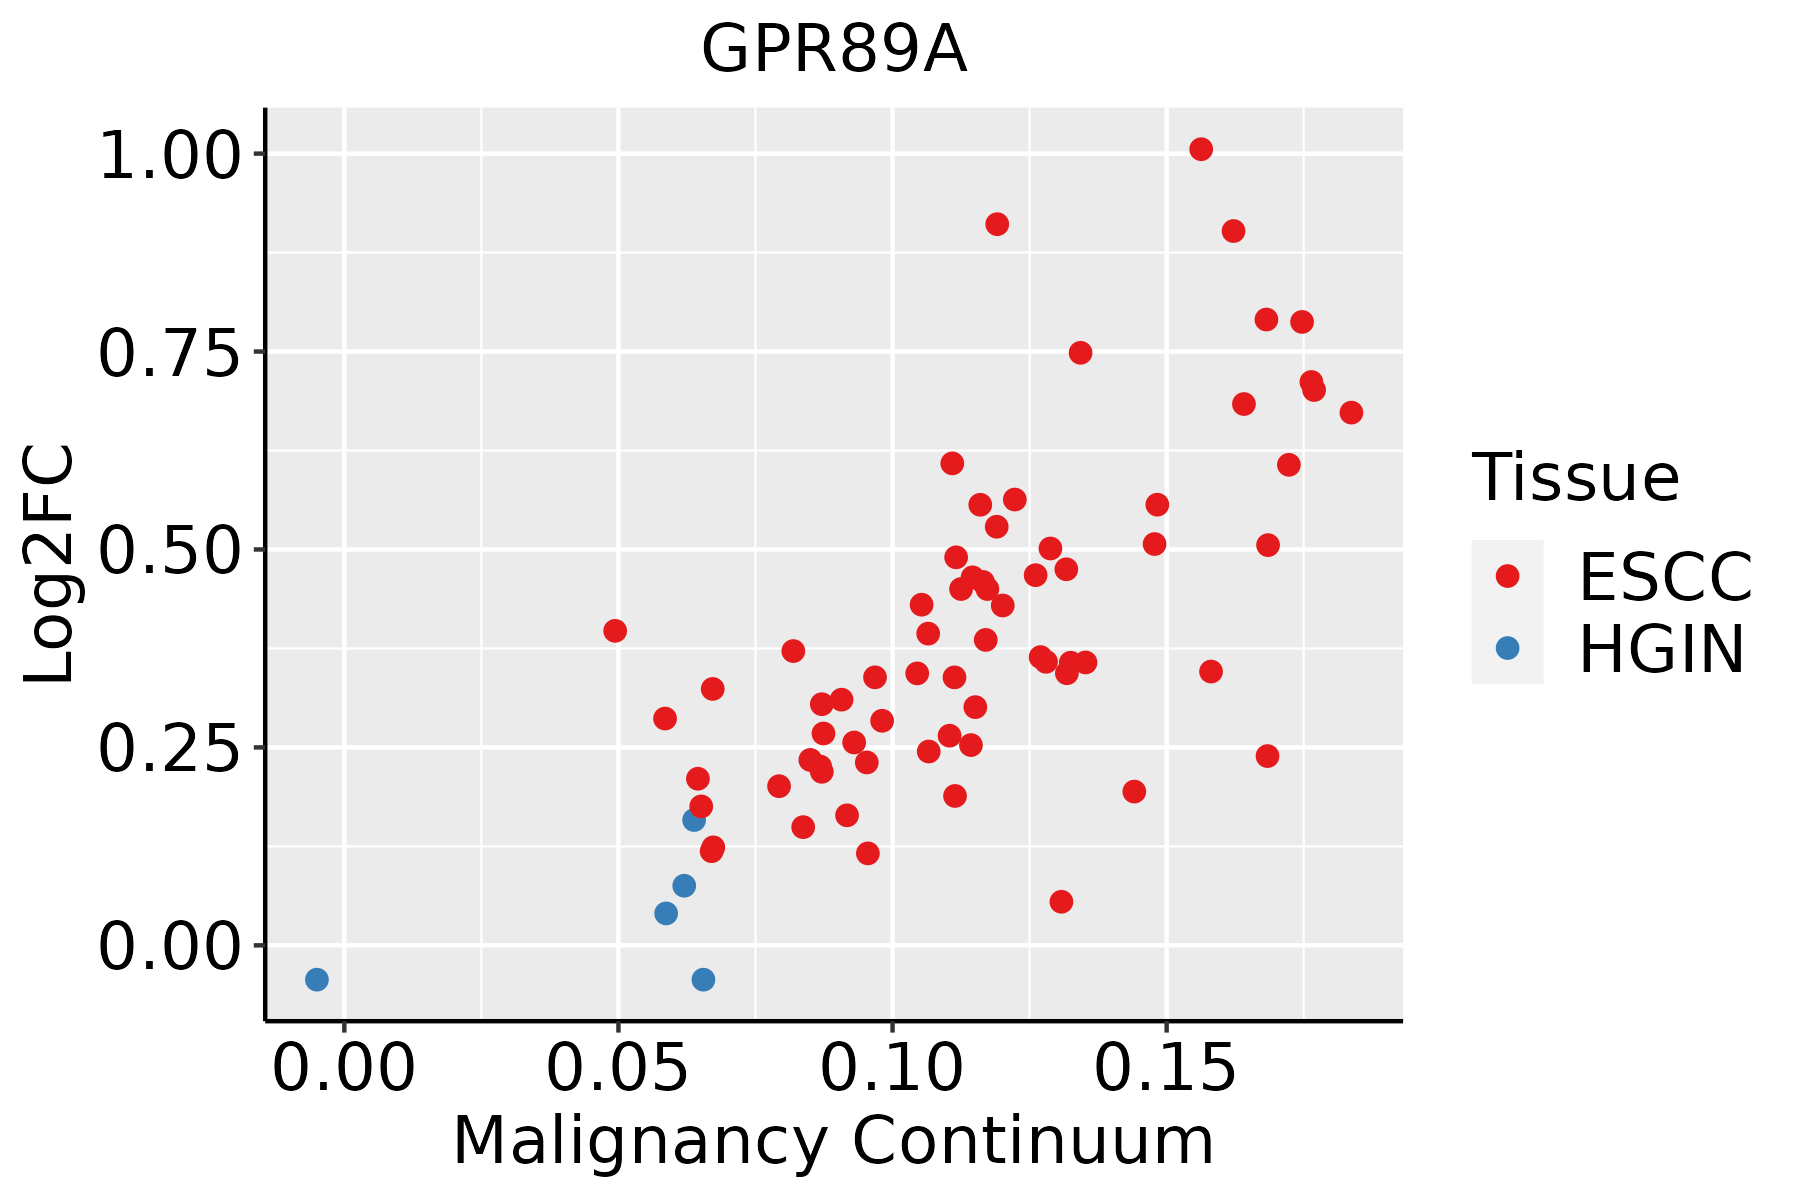 | ESCC: Esophageal squamous cell carcinoma |
| HGIN: High-grade intraepithelial neoplasias | ||
| LGIN: Low-grade intraepithelial neoplasias | ||
| Oral Cavity | 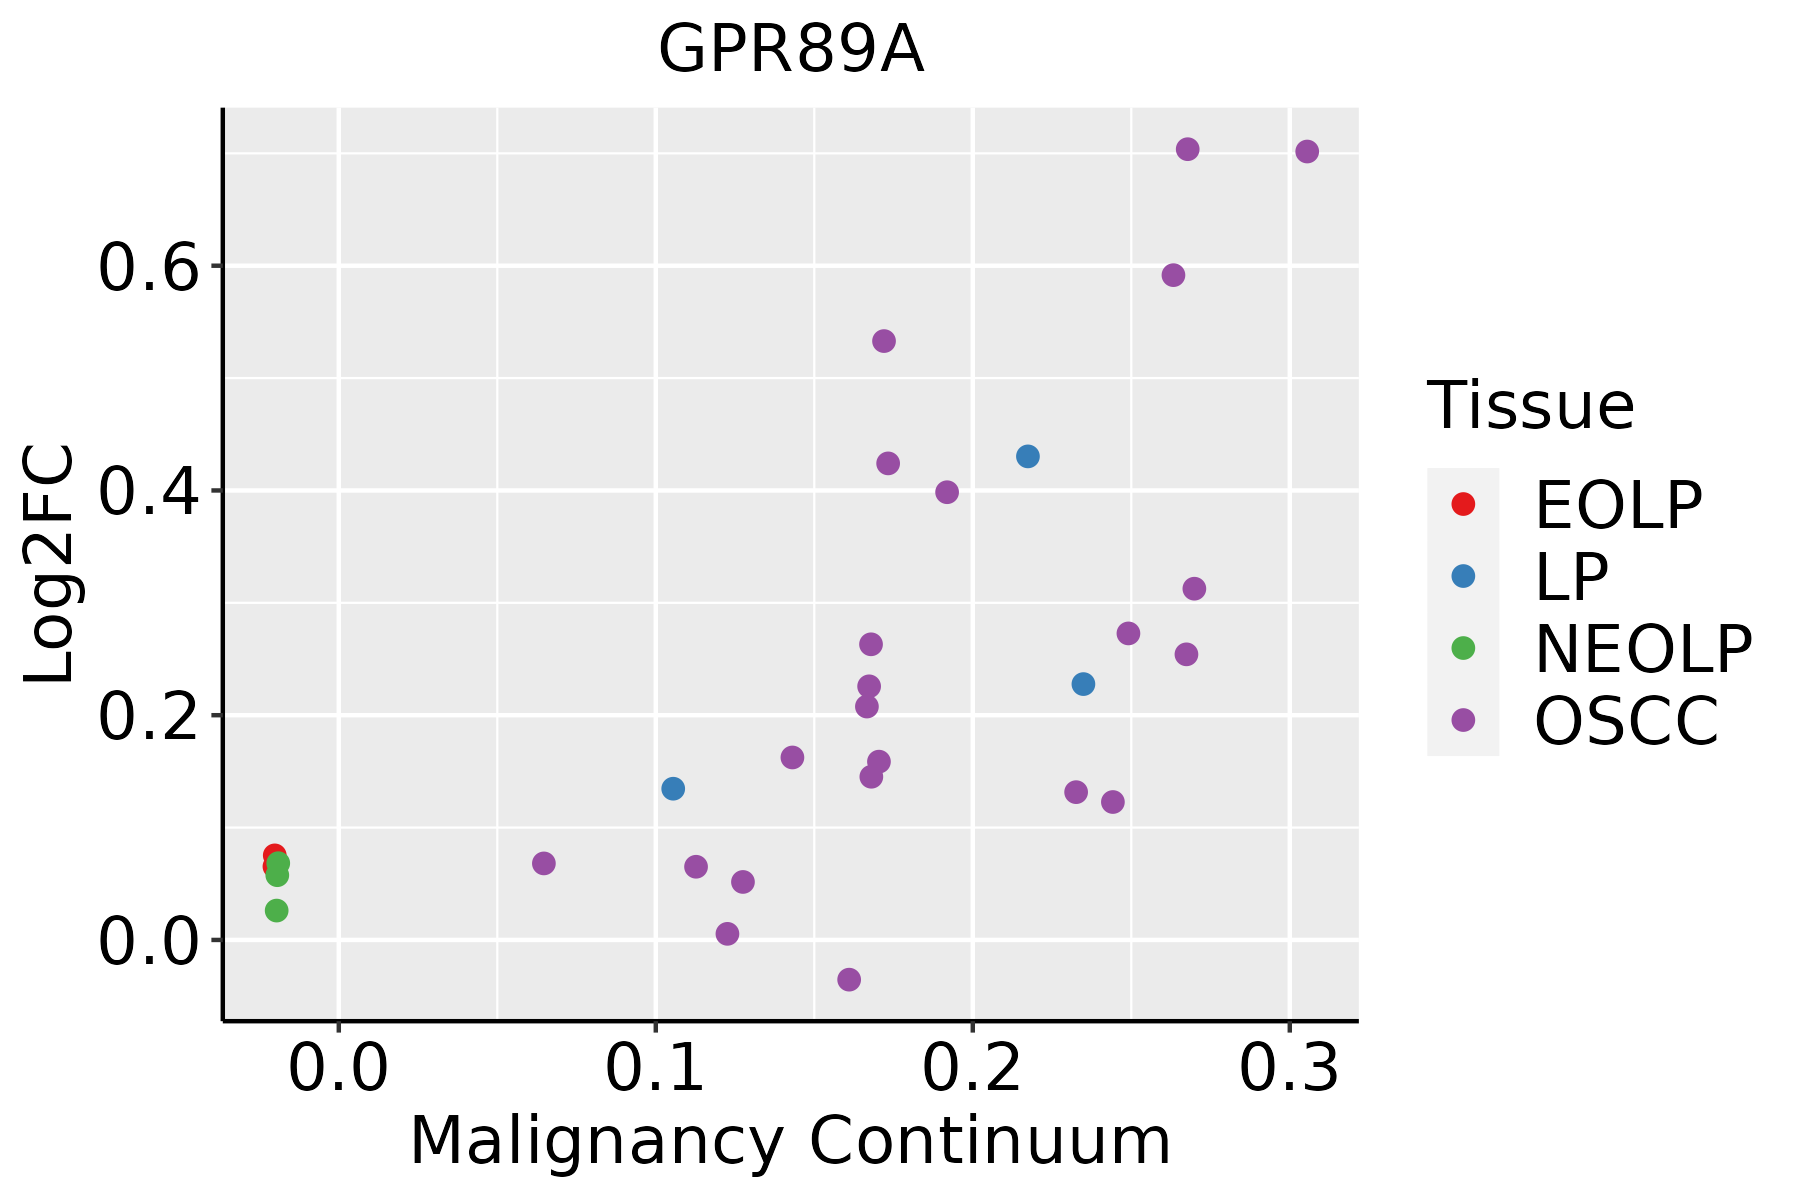 | EOLP: Erosive Oral lichen planus |
| LP: leukoplakia | ||
| NEOLP: Non-erosive oral lichen planus | ||
| OSCC: Oral squamous cell carcinoma |
| ∗log2FC in expression of this searched gene in stem-like cells from each diseased tissue sample relative to stem-like cells in normal samples in each tissue plotted against the malignancy continuum. Samples are colored based on if they are from different disease stage. |
Top |
Malignant transformation related pathway analysis |
| Find out the enriched GO biological processes and KEGG pathways involved in transition from healthy to precancer to cancer |
| Tissue | Disease Stage | Enriched GO biological Processes |
| Colorectum | AD |  |
| Colorectum | SER |  |
| Colorectum | MSS |  |
| Colorectum | MSI-H |  |
| Colorectum | FAP |  |
| ∗Top 15 enriched GO BP terms are showed in the bar plot of each disease state in each tissue. Each row represents a significant GO biological process which is colored according to the -log10(p.adjust). |
| Page: 1 2 3 4 5 6 7 8 9 |
| GO ID | Tissue | Disease Stage | Description | Gene Ratio | Bg Ratio | pvalue | p.adjust | Count |
| GO:004312318 | Esophagus | ESCC | positive regulation of I-kappaB kinase/NF-kappaB signaling | 132/8552 | 186/18723 | 2.07e-12 | 8.58e-11 | 132 |
| GO:0043122110 | Esophagus | ESCC | regulation of I-kappaB kinase/NF-kappaB signaling | 167/8552 | 249/18723 | 6.11e-12 | 2.32e-10 | 167 |
| GO:000724919 | Esophagus | ESCC | I-kappaB kinase/NF-kappaB signaling | 183/8552 | 281/18723 | 3.02e-11 | 1.01e-09 | 183 |
| GO:004211018 | Esophagus | ESCC | T cell activation | 256/8552 | 487/18723 | 1.18e-03 | 5.87e-03 | 256 |
| GO:19031317 | Esophagus | ESCC | mononuclear cell differentiation | 226/8552 | 426/18723 | 1.20e-03 | 5.88e-03 | 226 |
| GO:00514521 | Esophagus | ESCC | intracellular pH reduction | 29/8552 | 42/18723 | 1.87e-03 | 8.46e-03 | 29 |
| GO:00458511 | Esophagus | ESCC | pH reduction | 31/8552 | 46/18723 | 2.42e-03 | 1.06e-02 | 31 |
| GO:00302176 | Esophagus | ESCC | T cell differentiation | 137/8552 | 257/18723 | 8.09e-03 | 2.87e-02 | 137 |
| GO:00300984 | Esophagus | ESCC | lymphocyte differentiation | 192/8552 | 374/18723 | 1.52e-02 | 4.93e-02 | 192 |
| GO:004312218 | Oral cavity | OSCC | regulation of I-kappaB kinase/NF-kappaB signaling | 155/7305 | 249/18723 | 7.79e-14 | 4.14e-12 | 155 |
| GO:004312310 | Oral cavity | OSCC | positive regulation of I-kappaB kinase/NF-kappaB signaling | 122/7305 | 186/18723 | 1.68e-13 | 8.52e-12 | 122 |
| GO:000724910 | Oral cavity | OSCC | I-kappaB kinase/NF-kappaB signaling | 169/7305 | 281/18723 | 4.69e-13 | 2.25e-11 | 169 |
| GO:004211016 | Oral cavity | OSCC | T cell activation | 245/7305 | 487/18723 | 2.00e-07 | 3.22e-06 | 245 |
| GO:19031316 | Oral cavity | OSCC | mononuclear cell differentiation | 210/7305 | 426/18723 | 8.44e-06 | 9.02e-05 | 210 |
| GO:00300983 | Oral cavity | OSCC | lymphocyte differentiation | 179/7305 | 374/18723 | 2.74e-04 | 1.74e-03 | 179 |
| GO:00302175 | Oral cavity | OSCC | T cell differentiation | 126/7305 | 257/18723 | 6.51e-04 | 3.66e-03 | 126 |
| GO:004211023 | Oral cavity | EOLP | T cell activation | 111/2218 | 487/18723 | 4.67e-12 | 8.17e-10 | 111 |
| GO:190313114 | Oral cavity | EOLP | mononuclear cell differentiation | 88/2218 | 426/18723 | 1.07e-07 | 3.61e-06 | 88 |
| GO:004312223 | Oral cavity | EOLP | regulation of I-kappaB kinase/NF-kappaB signaling | 58/2218 | 249/18723 | 2.72e-07 | 8.22e-06 | 58 |
| GO:000724924 | Oral cavity | EOLP | I-kappaB kinase/NF-kappaB signaling | 62/2218 | 281/18723 | 8.00e-07 | 2.02e-05 | 62 |
| Page: 1 2 |
| Pathway ID | Tissue | Disease Stage | Description | Gene Ratio | Bg Ratio | pvalue | p.adjust | qvalue | Count |
| Page: 1 |
Top |
Cell-cell communication analysis |
| Identification of potential cell-cell interactions between two cell types and their ligand-receptor pairs for different disease states |
| Ligand | Receptor | LRpair | Pathway | Tissue | Disease Stage |
| Page: 1 |
Top |
Single-cell gene regulatory network inference analysis |
| Find out the significant the regulons (TFs) and the target genes of each regulon across cell types for different disease states |
| TF | Cell Type | Tissue | Disease Stage | Target Gene | RSS | Regulon Activity |
| ∗The dot plots of a searched regulon are shown for all cell subpopulations in each disease state of each tissue based on the regulon specific score inferred using pySCENIC and by calculating the average expression. |
| Page: 1 |
Top |
Somatic mutation of malignant transformation related genes |
| Annotation of somatic variants for genes involved in malignant transformation |
| Hugo Symbol | Variant Class | Variant Classification | dbSNP RS | HGVSc | HGVSp | HGVSp Short | SWISSPROT | BIOTYPE | SIFT | PolyPhen | Tumor Sample Barcode | Tissue | Histology | Sex | Age | Stage | Therapy Types | Drugs | Outcome |
| GPR89A | SNV | Missense_Mutation | c.1007N>G | p.Val336Gly | p.V336G | B7ZAQ6 | protein_coding | deleterious(0) | probably_damaging(0.977) | TCGA-A2-A0T2-01 | Breast | breast invasive carcinoma | Female | >=65 | III/IV | Chemotherapy | xeloda | PD | |
| GPR89A | SNV | Missense_Mutation | c.1007T>G | p.Val336Gly | p.V336G | B7ZAQ6 | protein_coding | deleterious(0) | probably_damaging(0.977) | TCGA-A2-A1G4-01 | Breast | breast invasive carcinoma | Female | >=65 | III/IV | Chemotherapy | adriamycin | SD | |
| GPR89A | SNV | Missense_Mutation | novel | c.1009A>G | p.Lys337Glu | p.K337E | B7ZAQ6 | protein_coding | tolerated(0.72) | benign(0.233) | TCGA-A2-A1G4-01 | Breast | breast invasive carcinoma | Female | >=65 | III/IV | Chemotherapy | adriamycin | SD |
| GPR89A | SNV | Missense_Mutation | c.1007T>G | p.Val336Gly | p.V336G | B7ZAQ6 | protein_coding | deleterious(0) | probably_damaging(0.977) | TCGA-A2-A25A-01 | Breast | breast invasive carcinoma | Female | <65 | I/II | Unspecific | Cytoxan | SD | |
| GPR89A | SNV | Missense_Mutation | novel | c.1009A>G | p.Lys337Glu | p.K337E | B7ZAQ6 | protein_coding | tolerated(0.72) | benign(0.233) | TCGA-A2-A25A-01 | Breast | breast invasive carcinoma | Female | <65 | I/II | Unspecific | Cytoxan | SD |
| GPR89A | SNV | Missense_Mutation | c.1007N>G | p.Val336Gly | p.V336G | B7ZAQ6 | protein_coding | deleterious(0) | probably_damaging(0.977) | TCGA-AQ-A1H3-01 | Breast | breast invasive carcinoma | Female | <65 | III/IV | Chemotherapy | adriamycin | SD | |
| GPR89A | SNV | Missense_Mutation | novel | c.1009N>G | p.Lys337Glu | p.K337E | B7ZAQ6 | protein_coding | tolerated(0.72) | benign(0.233) | TCGA-AQ-A1H3-01 | Breast | breast invasive carcinoma | Female | <65 | III/IV | Chemotherapy | adriamycin | SD |
| GPR89A | SNV | Missense_Mutation | novel | c.451G>C | p.Gly151Arg | p.G151R | B7ZAQ6 | protein_coding | deleterious(0) | probably_damaging(0.965) | TCGA-B6-A0RU-01 | Breast | breast invasive carcinoma | Female | <65 | I/II | Unknown | Unknown | PD |
| GPR89A | SNV | Missense_Mutation | c.1007N>G | p.Val336Gly | p.V336G | B7ZAQ6 | protein_coding | deleterious(0) | probably_damaging(0.977) | TCGA-B6-A1KN-01 | Breast | breast invasive carcinoma | Female | <65 | III/IV | Unknown | Unknown | SD | |
| GPR89A | SNV | Missense_Mutation | c.1007N>G | p.Val336Gly | p.V336G | B7ZAQ6 | protein_coding | deleterious(0) | probably_damaging(0.977) | TCGA-BH-A1EX-01 | Breast | breast invasive carcinoma | Female | >=65 | I/II | Unknown | Unknown | PD |
| Page: 1 2 3 4 5 6 |
Top |
Related drugs of malignant transformation related genes |
| Identification of chemicals and drugs interact with genes involved in malignant transfromation |
| (DGIdb 4.0) |
| Entrez ID | Symbol | Category | Interaction Types | Drug Claim Name | Drug Name | PMIDs |
| Page: 1 |

Copyright 2023-Present -The University of Texas Health Science Center at Houston |