
|
|||||
|
 | |
| |
| |
| |
| |
| |
|
Gene: GPR87 |
Gene summary for GPR87 |
| Gene information | Species | Human | Gene symbol | GPR87 | Gene ID | 53836 |
| Gene name | G protein-coupled receptor 87 | |
| Gene Alias | FKSG78 | |
| Cytomap | 3q25.1 | |
| Gene Type | protein-coding | GO ID | GO:0007154 | UniProtAcc | Q9BY21 |
Top |
Malignant transformation analysis |
| Identification of the aberrant gene expression in precancerous and cancerous lesions by comparing the gene expression of stem-like cells in diseased tissues with normal stem cells |
| Entrez ID | Symbol | Replicates | Species | Organ | Tissue | Adj P-value | Log2FC | Malignancy |
| 53836 | GPR87 | CCI_2 | Human | Cervix | CC | 3.22e-05 | 5.15e-01 | 0.5249 |
| 53836 | GPR87 | Tumor | Human | Cervix | CC | 1.18e-15 | 4.45e-01 | 0.1241 |
| 53836 | GPR87 | sample1 | Human | Cervix | CC | 9.20e-08 | 3.69e-01 | 0.0959 |
| 53836 | GPR87 | sample3 | Human | Cervix | CC | 4.35e-32 | 5.27e-01 | 0.1387 |
| 53836 | GPR87 | L1 | Human | Cervix | CC | 1.49e-05 | 4.36e-01 | 0.0802 |
| 53836 | GPR87 | T1 | Human | Cervix | CC | 3.50e-15 | 4.25e-01 | 0.0918 |
| 53836 | GPR87 | T3 | Human | Cervix | CC | 3.48e-25 | 5.29e-01 | 0.1389 |
| 53836 | GPR87 | LZE4T | Human | Esophagus | ESCC | 1.10e-20 | 6.21e-01 | 0.0811 |
| 53836 | GPR87 | LZE7T | Human | Esophagus | ESCC | 5.88e-03 | 9.37e-02 | 0.0667 |
| 53836 | GPR87 | LZE8T | Human | Esophagus | ESCC | 2.26e-08 | 4.20e-01 | 0.067 |
| 53836 | GPR87 | LZE20T | Human | Esophagus | ESCC | 1.87e-04 | 3.01e-01 | 0.0662 |
| 53836 | GPR87 | LZE24T | Human | Esophagus | ESCC | 5.87e-07 | 3.76e-01 | 0.0596 |
| 53836 | GPR87 | LZE21T | Human | Esophagus | ESCC | 1.93e-05 | 6.94e-01 | 0.0655 |
| 53836 | GPR87 | LZE6T | Human | Esophagus | ESCC | 7.40e-06 | 2.87e-01 | 0.0845 |
| 53836 | GPR87 | P1T-E | Human | Esophagus | ESCC | 1.93e-03 | 5.20e-01 | 0.0875 |
| 53836 | GPR87 | P2T-E | Human | Esophagus | ESCC | 3.07e-22 | 6.91e-01 | 0.1177 |
| 53836 | GPR87 | P4T-E | Human | Esophagus | ESCC | 5.35e-24 | 6.26e-01 | 0.1323 |
| 53836 | GPR87 | P5T-E | Human | Esophagus | ESCC | 6.93e-34 | 8.36e-01 | 0.1327 |
| 53836 | GPR87 | P8T-E | Human | Esophagus | ESCC | 1.49e-18 | 6.33e-01 | 0.0889 |
| 53836 | GPR87 | P9T-E | Human | Esophagus | ESCC | 1.12e-12 | 3.47e-01 | 0.1131 |
| Page: 1 2 3 4 5 6 |
| Tissue | Expression Dynamics | Abbreviation |
| Cervix |  | CC: Cervix cancer |
| HSIL_HPV: HPV-infected high-grade squamous intraepithelial lesions | ||
| N_HPV: HPV-infected normal cervix | ||
| Esophagus | 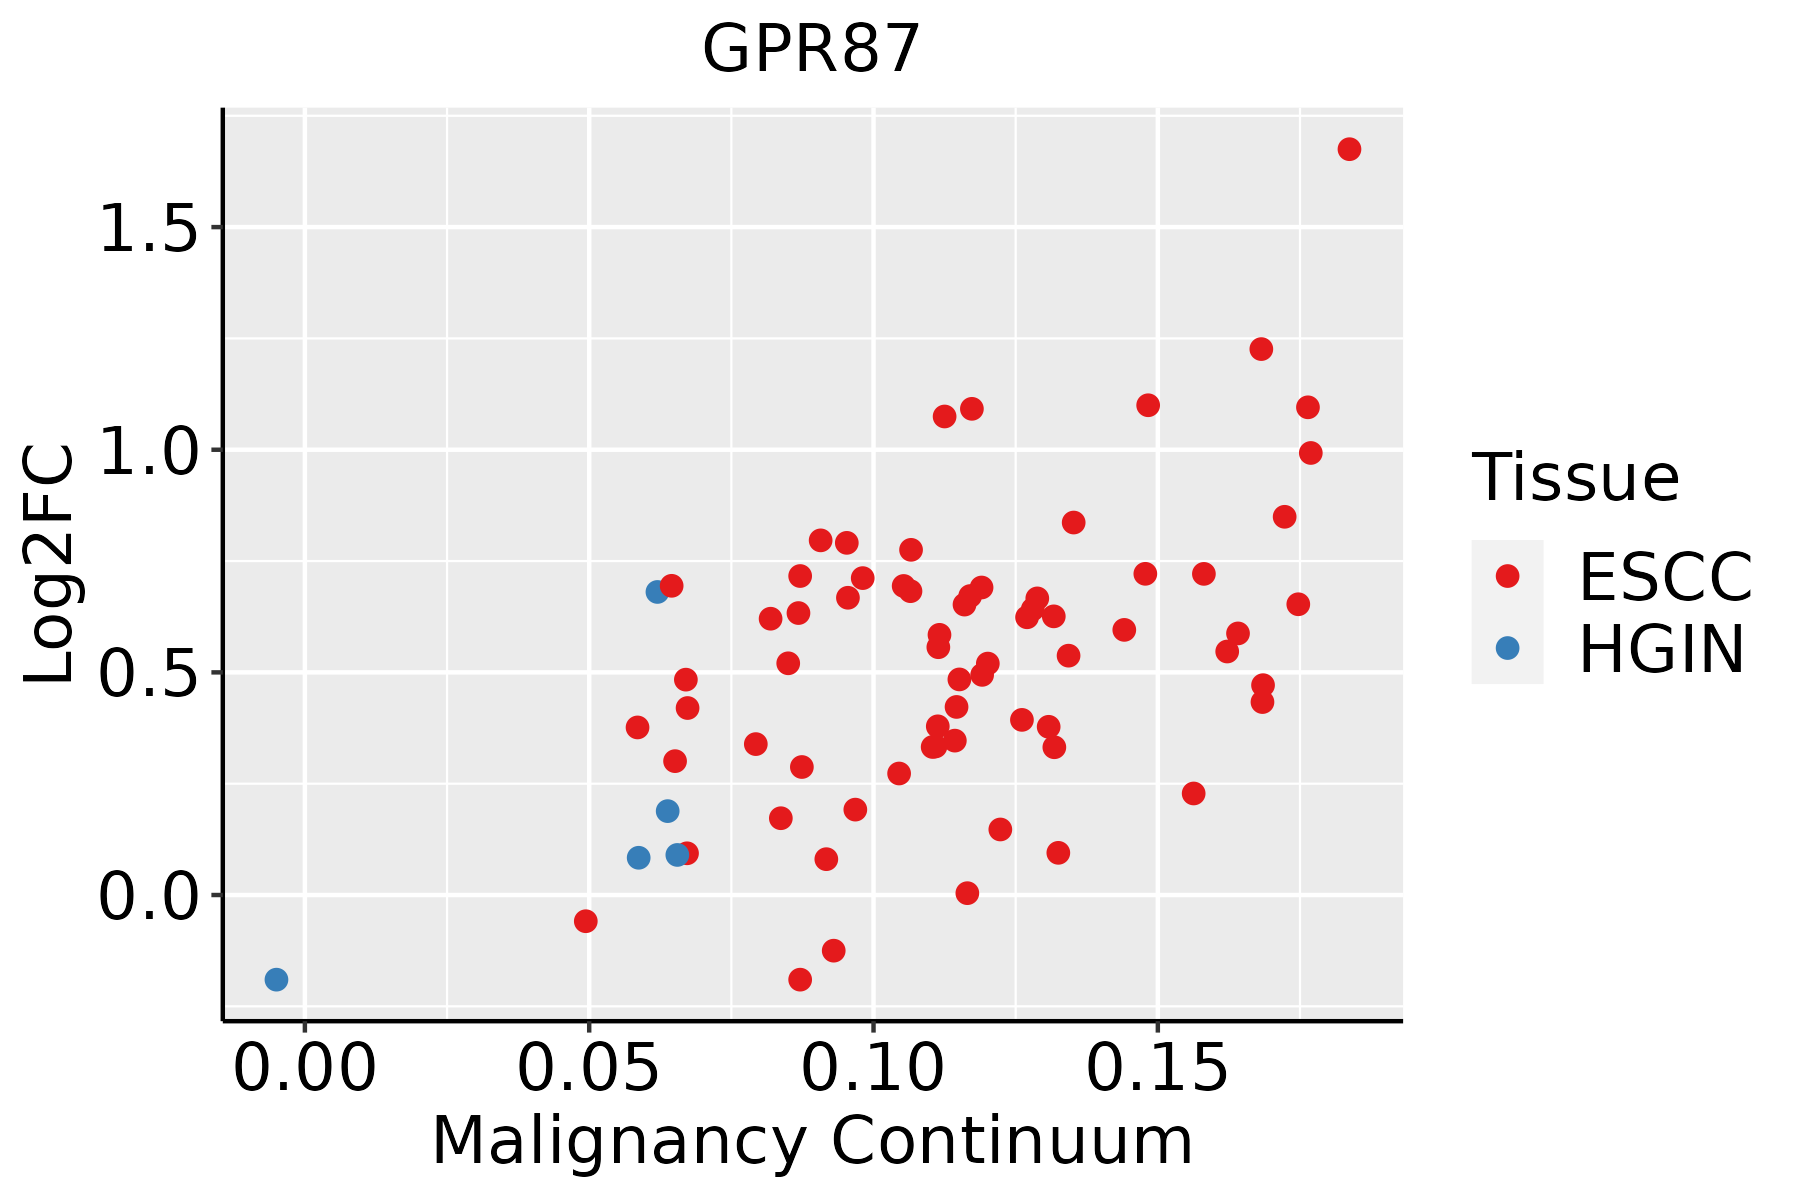 | ESCC: Esophageal squamous cell carcinoma |
| HGIN: High-grade intraepithelial neoplasias | ||
| LGIN: Low-grade intraepithelial neoplasias | ||
| Oral Cavity | 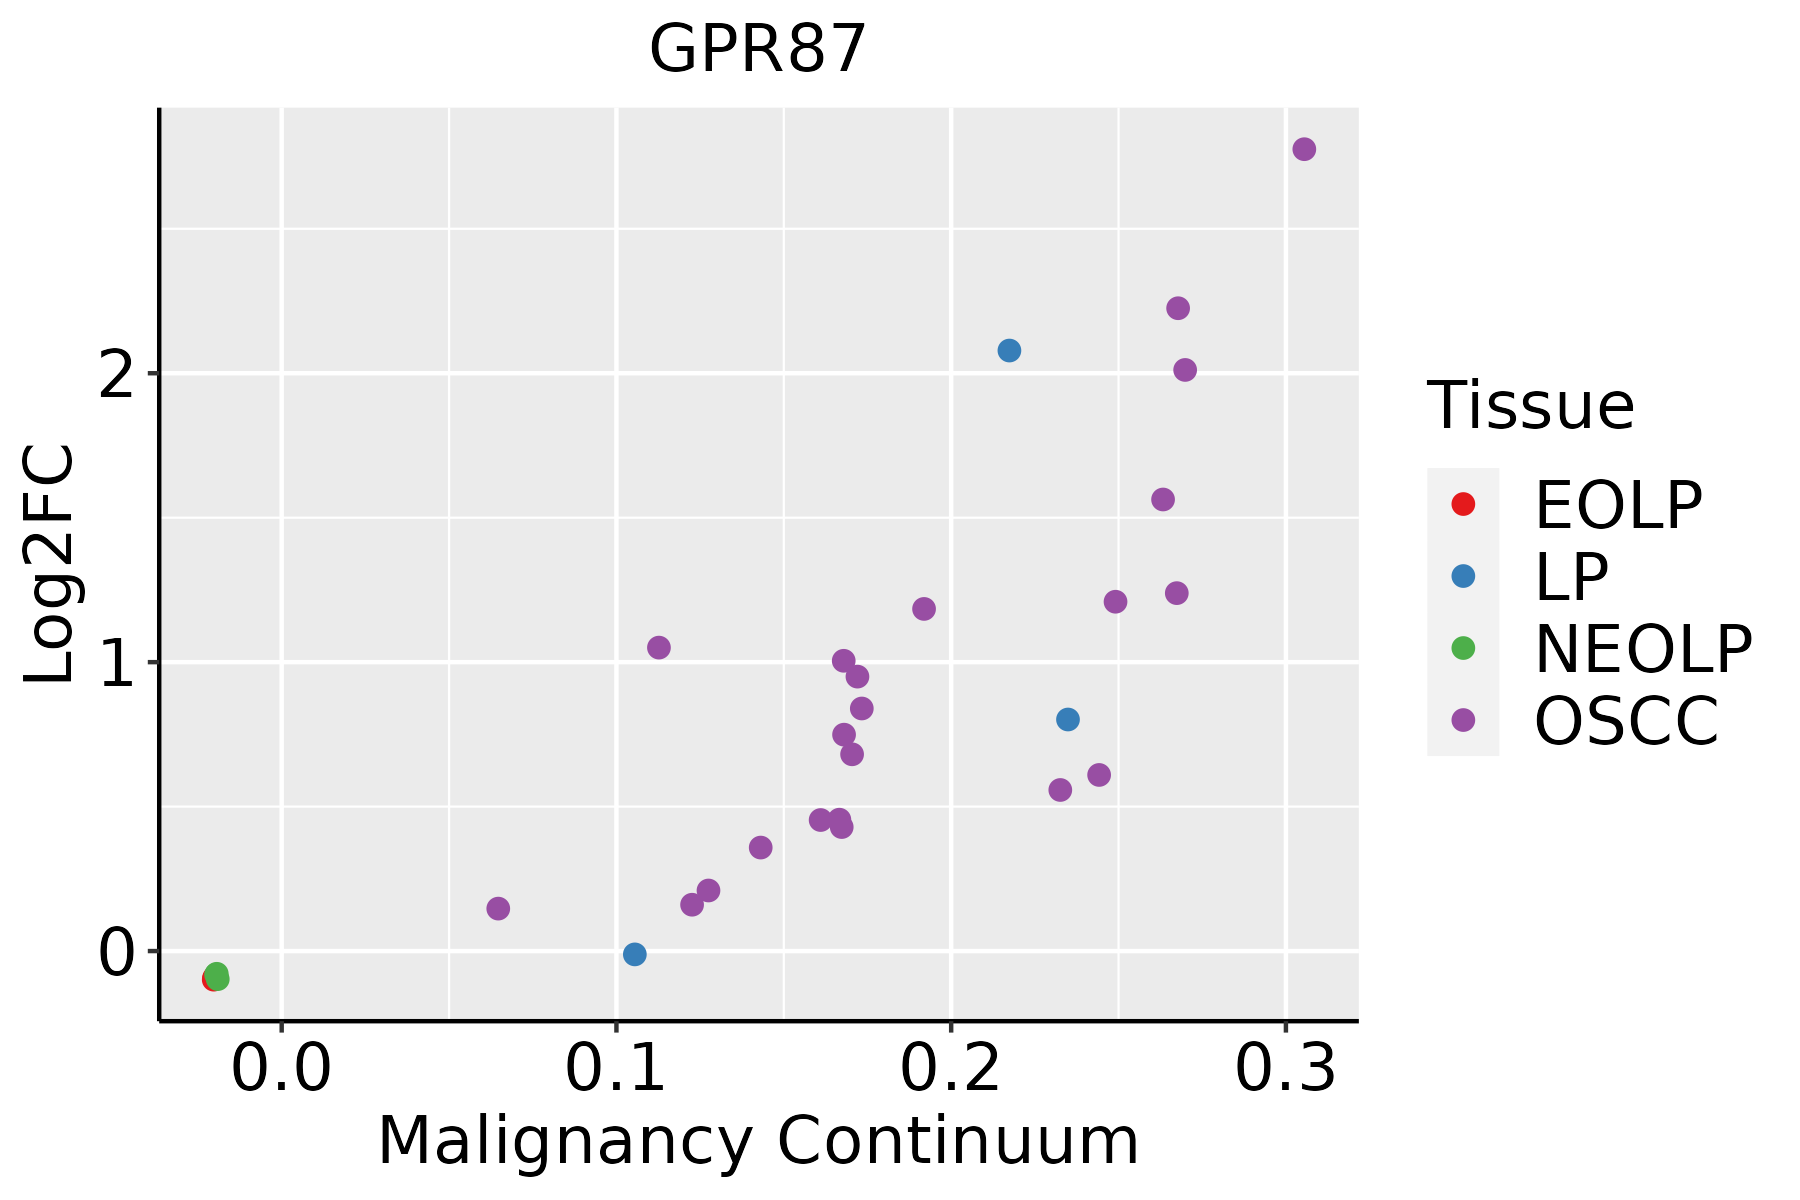 | EOLP: Erosive Oral lichen planus |
| LP: leukoplakia | ||
| NEOLP: Non-erosive oral lichen planus | ||
| OSCC: Oral squamous cell carcinoma | ||
| Prostate |  | BPH: Benign Prostatic Hyperplasia |
| Skin | 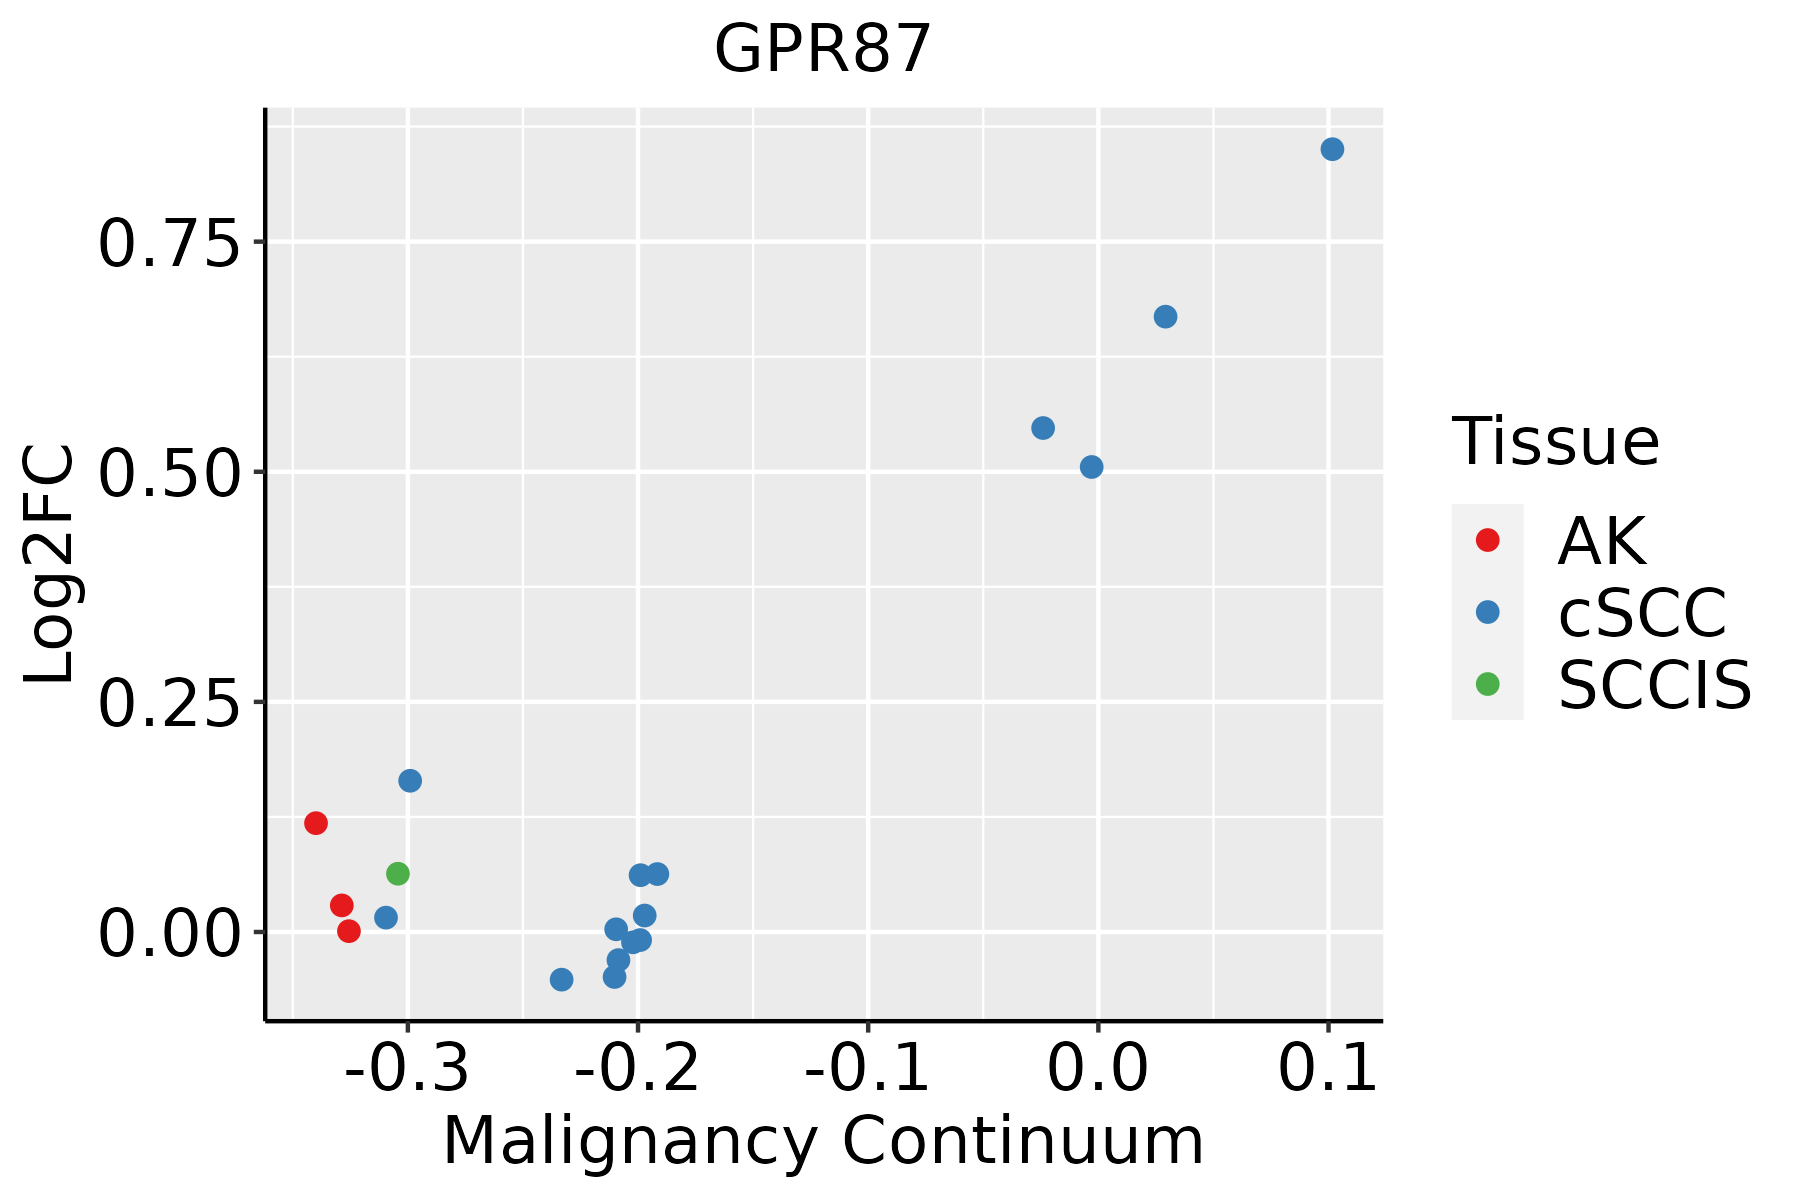 | AK: Actinic keratosis |
| cSCC: Cutaneous squamous cell carcinoma | ||
| SCCIS:squamous cell carcinoma in situ |
| ∗log2FC in expression of this searched gene in stem-like cells from each diseased tissue sample relative to stem-like cells in normal samples in each tissue plotted against the malignancy continuum. Samples are colored based on if they are from different disease stage. |
Top |
Malignant transformation related pathway analysis |
| Find out the enriched GO biological processes and KEGG pathways involved in transition from healthy to precancer to cancer |
| Tissue | Disease Stage | Enriched GO biological Processes |
| Colorectum | AD |  |
| Colorectum | SER |  |
| Colorectum | MSS |  |
| Colorectum | MSI-H |  |
| Colorectum | FAP |  |
| ∗Top 15 enriched GO BP terms are showed in the bar plot of each disease state in each tissue. Each row represents a significant GO biological process which is colored according to the -log10(p.adjust). |
| Page: 1 2 3 4 5 6 7 8 9 |
| GO ID | Tissue | Disease Stage | Description | Gene Ratio | Bg Ratio | pvalue | p.adjust | Count |
| Page: 1 |
| Pathway ID | Tissue | Disease Stage | Description | Gene Ratio | Bg Ratio | pvalue | p.adjust | qvalue | Count |
| Page: 1 |
Top |
Cell-cell communication analysis |
| Identification of potential cell-cell interactions between two cell types and their ligand-receptor pairs for different disease states |
| Ligand | Receptor | LRpair | Pathway | Tissue | Disease Stage |
| Page: 1 |
Top |
Single-cell gene regulatory network inference analysis |
| Find out the significant the regulons (TFs) and the target genes of each regulon across cell types for different disease states |
| TF | Cell Type | Tissue | Disease Stage | Target Gene | RSS | Regulon Activity |
| ∗The dot plots of a searched regulon are shown for all cell subpopulations in each disease state of each tissue based on the regulon specific score inferred using pySCENIC and by calculating the average expression. |
| Page: 1 |
Top |
Somatic mutation of malignant transformation related genes |
| Annotation of somatic variants for genes involved in malignant transformation |
| Hugo Symbol | Variant Class | Variant Classification | dbSNP RS | HGVSc | HGVSp | HGVSp Short | SWISSPROT | BIOTYPE | SIFT | PolyPhen | Tumor Sample Barcode | Tissue | Histology | Sex | Age | Stage | Therapy Types | Drugs | Outcome |
| GPR87 | SNV | Missense_Mutation | rs765905861 | c.17C>T | p.Thr6Met | p.T6M | Q9BY21 | protein_coding | deleterious_low_confidence(0.02) | benign(0.178) | TCGA-A2-A0YH-01 | Breast | breast invasive carcinoma | Female | <65 | III/IV | Chemotherapy | adriamycin | SD |
| GPR87 | SNV | Missense_Mutation | c.299A>G | p.His100Arg | p.H100R | Q9BY21 | protein_coding | tolerated(0.34) | benign(0) | TCGA-A8-A09Z-01 | Breast | breast invasive carcinoma | Female | >=65 | I/II | Unknown | Unknown | SD | |
| GPR87 | SNV | Missense_Mutation | novel | c.853N>C | p.Asp285His | p.D285H | Q9BY21 | protein_coding | deleterious(0.03) | probably_damaging(0.989) | TCGA-BH-A0B6-01 | Breast | breast invasive carcinoma | Female | <65 | I/II | Unknown | Unknown | SD |
| GPR87 | insertion | Frame_Shift_Ins | novel | c.359_360insAA | p.Phe121SerfsTer15 | p.F121Sfs*15 | Q9BY21 | protein_coding | TCGA-AC-A3QQ-01 | Breast | breast invasive carcinoma | Female | <65 | I/II | Unknown | Unknown | SD | ||
| GPR87 | SNV | Missense_Mutation | c.168N>A | p.Ser56Arg | p.S56R | Q9BY21 | protein_coding | deleterious(0) | possibly_damaging(0.806) | TCGA-AA-3684-01 | Colorectum | colon adenocarcinoma | Female | >=65 | III/IV | Unknown | Unknown | SD | |
| GPR87 | SNV | Missense_Mutation | c.371N>G | p.Asn124Ser | p.N124S | Q9BY21 | protein_coding | tolerated(0.27) | benign(0.026) | TCGA-AA-3811-01 | Colorectum | colon adenocarcinoma | Female | >=65 | III/IV | Unknown | Unknown | PD | |
| GPR87 | SNV | Missense_Mutation | c.929N>C | p.Asp310Ala | p.D310A | Q9BY21 | protein_coding | deleterious(0) | probably_damaging(0.999) | TCGA-AA-3977-01 | Colorectum | colon adenocarcinoma | Male | >=65 | I/II | Unknown | Unknown | SD | |
| GPR87 | SNV | Missense_Mutation | rs778550664 | c.911C>T | p.Ala304Val | p.A304V | Q9BY21 | protein_coding | deleterious(0) | probably_damaging(0.99) | TCGA-AA-A01Z-01 | Colorectum | colon adenocarcinoma | Male | >=65 | I/II | Unknown | Unknown | PD |
| GPR87 | SNV | Missense_Mutation | novel | c.890N>G | p.Glu297Gly | p.E297G | Q9BY21 | protein_coding | deleterious(0) | probably_damaging(0.989) | TCGA-CA-6717-01 | Colorectum | colon adenocarcinoma | Male | <65 | I/II | Chemotherapy | oxaliplatin | CR |
| GPR87 | SNV | Missense_Mutation | rs777076331 | c.652N>A | p.Val218Met | p.V218M | Q9BY21 | protein_coding | deleterious(0) | probably_damaging(0.963) | TCGA-CA-6717-01 | Colorectum | colon adenocarcinoma | Male | <65 | I/II | Chemotherapy | oxaliplatin | CR |
| Page: 1 2 3 4 5 |
Top |
Related drugs of malignant transformation related genes |
| Identification of chemicals and drugs interact with genes involved in malignant transfromation |
| (DGIdb 4.0) |
| Entrez ID | Symbol | Category | Interaction Types | Drug Claim Name | Drug Name | PMIDs |
| 53836 | GPR87 | G PROTEIN COUPLED RECEPTOR, DRUGGABLE GENOME | antagonist | 135650457 | ||
| 53836 | GPR87 | G PROTEIN COUPLED RECEPTOR, DRUGGABLE GENOME | antagonist | 135650190 | ||
| 53836 | GPR87 | G PROTEIN COUPLED RECEPTOR, DRUGGABLE GENOME | agonist | 135651509 |
| Page: 1 |

Copyright 2023-Present -The University of Texas Health Science Center at Houston |