
|
|||||
|
 | |
| |
| |
| |
| |
| |
|
Gene: GPR39 |
Gene summary for GPR39 |
| Gene information | Species | Human | Gene symbol | GPR39 | Gene ID | 2863 |
| Gene name | G protein-coupled receptor 39 | |
| Gene Alias | GPR39 | |
| Cytomap | 2q21.2 | |
| Gene Type | protein-coding | GO ID | GO:0007154 | UniProtAcc | O43194 |
Top |
Malignant transformation analysis |
| Identification of the aberrant gene expression in precancerous and cancerous lesions by comparing the gene expression of stem-like cells in diseased tissues with normal stem cells |
| Entrez ID | Symbol | Replicates | Species | Organ | Tissue | Adj P-value | Log2FC | Malignancy |
| 2863 | GPR39 | CCI_2 | Human | Cervix | CC | 1.53e-06 | 7.07e-01 | 0.5249 |
| 2863 | GPR39 | CCI_3 | Human | Cervix | CC | 1.67e-10 | 6.19e-01 | 0.516 |
| 2863 | GPR39 | HTA11_3410_2000001011 | Human | Colorectum | AD | 5.47e-20 | -6.42e-01 | 0.0155 |
| 2863 | GPR39 | HTA11_2487_2000001011 | Human | Colorectum | SER | 2.74e-02 | -4.57e-01 | -0.1808 |
| 2863 | GPR39 | HTA11_3361_2000001011 | Human | Colorectum | AD | 2.51e-03 | -5.73e-01 | -0.1207 |
| 2863 | GPR39 | HTA11_696_2000001011 | Human | Colorectum | AD | 1.60e-03 | -3.45e-01 | -0.1464 |
| 2863 | GPR39 | HTA11_866_2000001011 | Human | Colorectum | AD | 1.72e-02 | -3.34e-01 | -0.1001 |
| 2863 | GPR39 | HTA11_5212_2000001011 | Human | Colorectum | AD | 4.63e-02 | -6.06e-01 | -0.2061 |
| 2863 | GPR39 | HTA11_5216_2000001011 | Human | Colorectum | SER | 1.89e-02 | -8.14e-01 | -0.1462 |
| 2863 | GPR39 | HTA11_9341_2000001011 | Human | Colorectum | SER | 4.44e-02 | -8.10e-01 | -0.00410000000000005 |
| 2863 | GPR39 | HTA11_7862_2000001011 | Human | Colorectum | AD | 5.85e-04 | -7.10e-01 | -0.0179 |
| 2863 | GPR39 | HTA11_866_3004761011 | Human | Colorectum | AD | 7.86e-13 | -6.75e-01 | 0.096 |
| 2863 | GPR39 | HTA11_8622_2000001021 | Human | Colorectum | SER | 4.68e-06 | -8.19e-01 | 0.0528 |
| 2863 | GPR39 | HTA11_10711_2000001011 | Human | Colorectum | AD | 2.95e-03 | -4.55e-01 | 0.0338 |
| 2863 | GPR39 | HTA11_7696_3000711011 | Human | Colorectum | AD | 4.59e-09 | -4.70e-01 | 0.0674 |
| 2863 | GPR39 | HTA11_6818_2000001011 | Human | Colorectum | AD | 3.40e-05 | -7.05e-01 | 0.0112 |
| 2863 | GPR39 | HTA11_99999970781_79442 | Human | Colorectum | MSS | 4.85e-27 | -6.67e-01 | 0.294 |
| 2863 | GPR39 | HTA11_99999971662_82457 | Human | Colorectum | MSS | 9.91e-15 | -5.55e-01 | 0.3859 |
| 2863 | GPR39 | HTA11_99999973899_84307 | Human | Colorectum | MSS | 4.19e-05 | -7.31e-01 | 0.2585 |
| 2863 | GPR39 | HTA11_99999974143_84620 | Human | Colorectum | MSS | 9.59e-18 | -6.26e-01 | 0.3005 |
| Page: 1 2 3 |
| Tissue | Expression Dynamics | Abbreviation |
| Cervix | 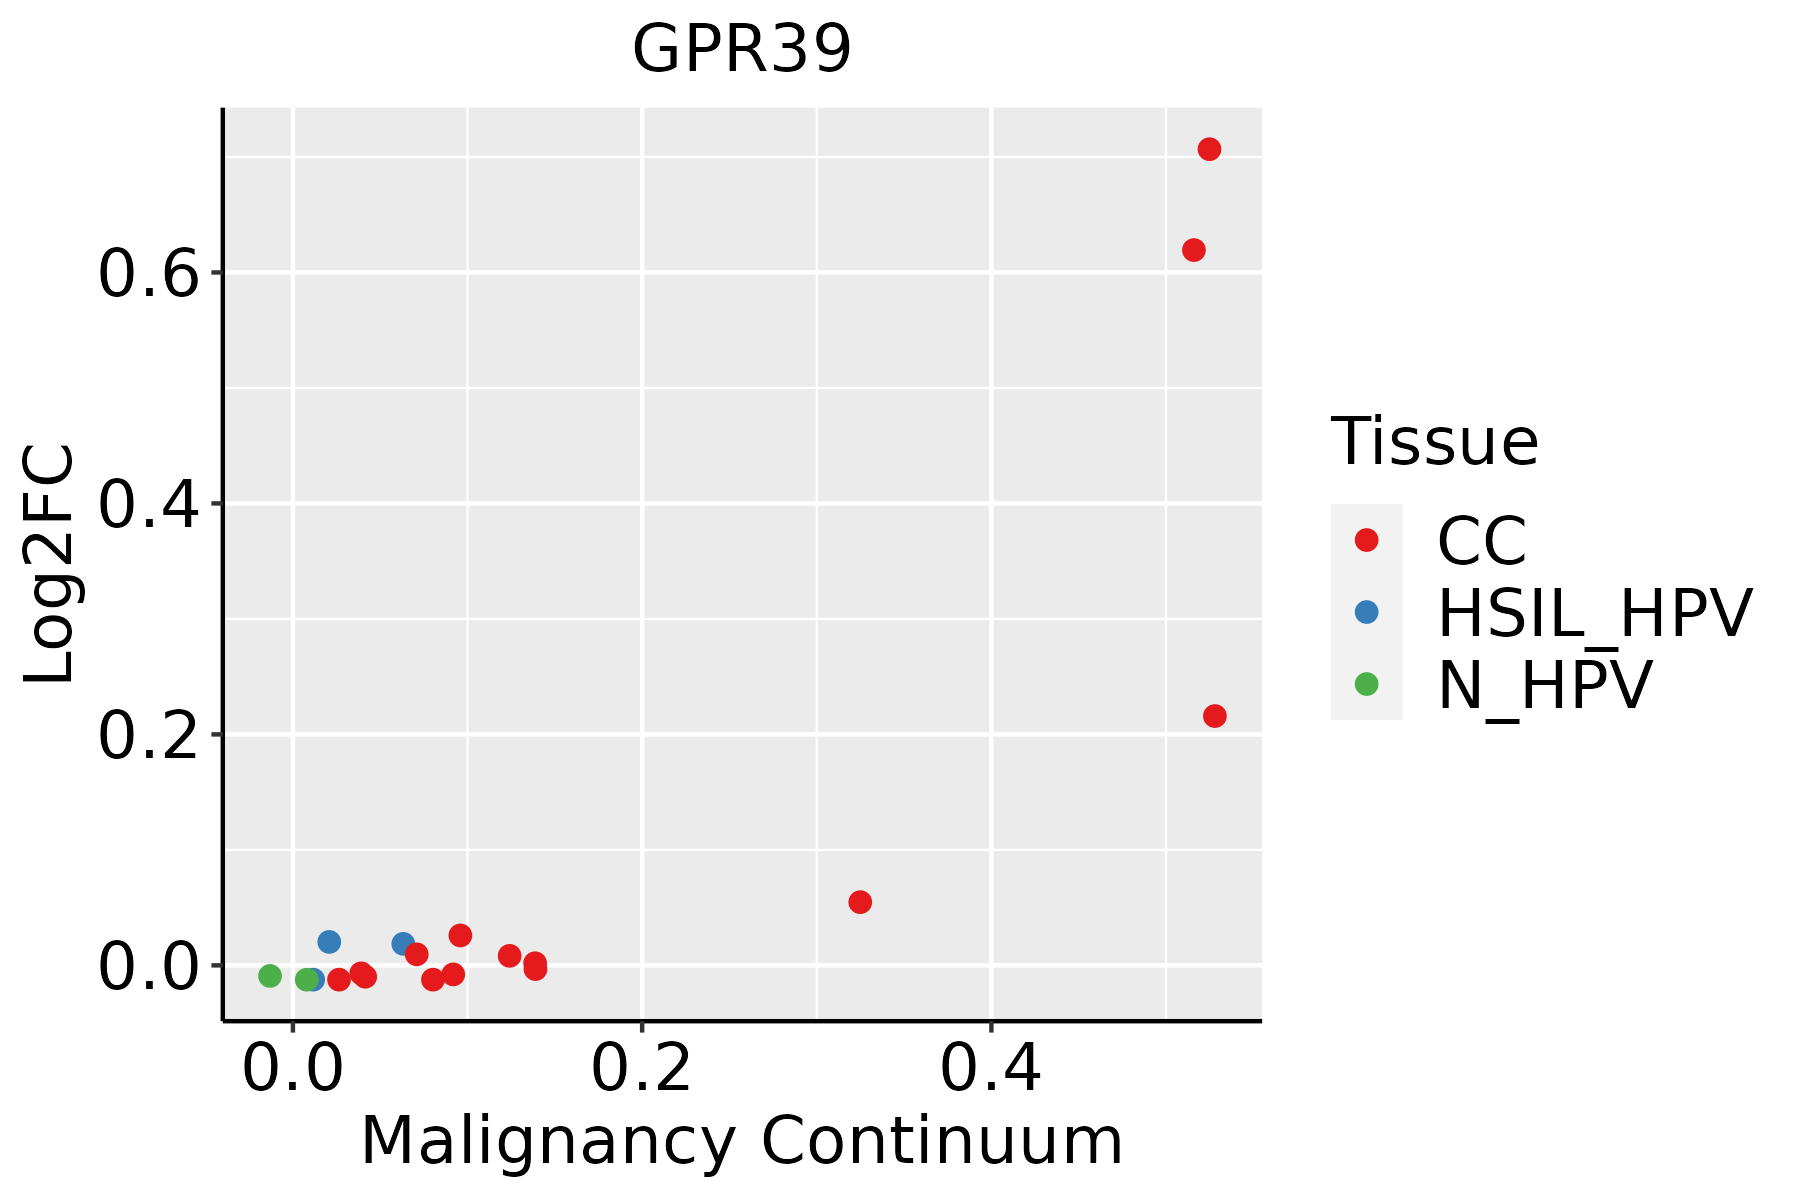 | CC: Cervix cancer |
| HSIL_HPV: HPV-infected high-grade squamous intraepithelial lesions | ||
| N_HPV: HPV-infected normal cervix | ||
| Colorectum (GSE201348) |  | FAP: Familial adenomatous polyposis |
| CRC: Colorectal cancer | ||
| Colorectum (HTA11) |  | AD: Adenomas |
| SER: Sessile serrated lesions | ||
| MSI-H: Microsatellite-high colorectal cancer | ||
| MSS: Microsatellite stable colorectal cancer | ||
| Lung | 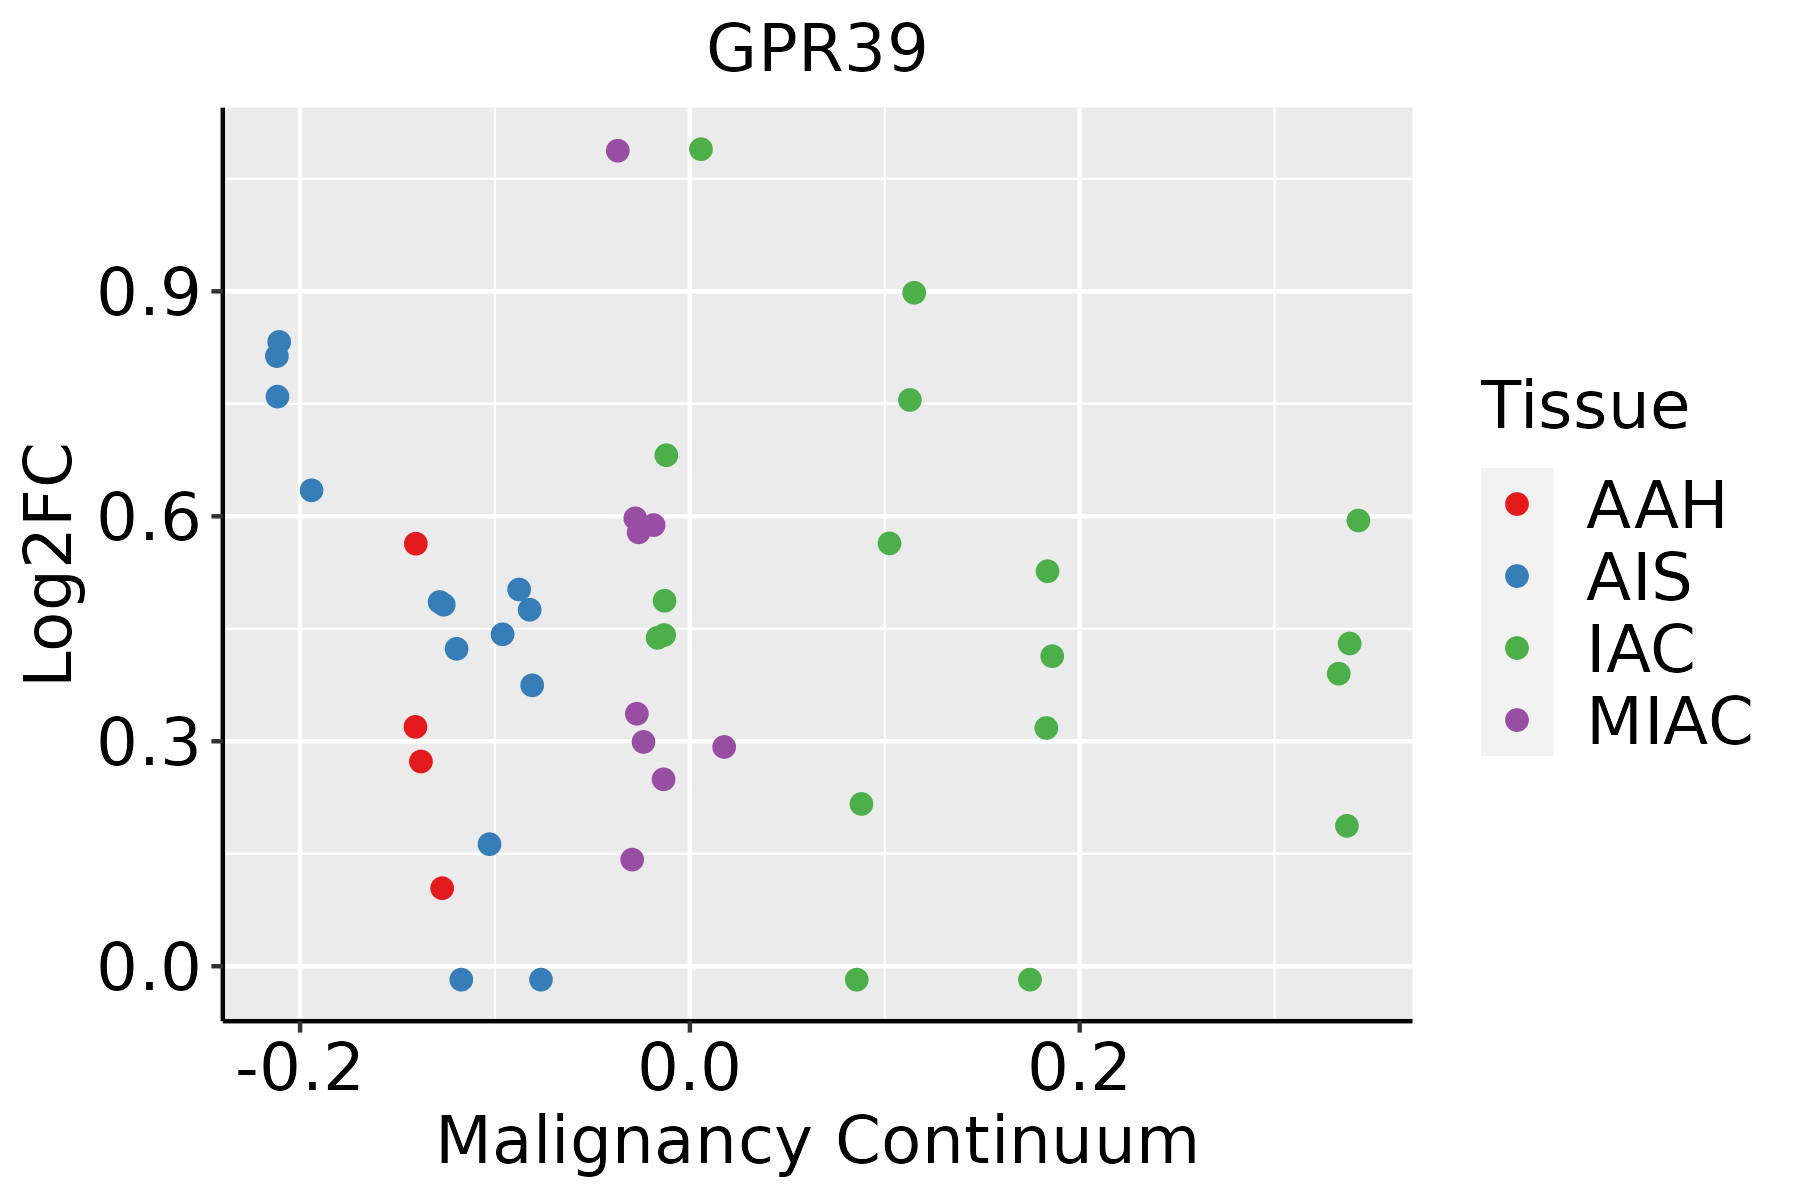 | AAH: Atypical adenomatous hyperplasia |
| AIS: Adenocarcinoma in situ | ||
| IAC: Invasive lung adenocarcinoma | ||
| MIA: Minimally invasive adenocarcinoma |
| ∗log2FC in expression of this searched gene in stem-like cells from each diseased tissue sample relative to stem-like cells in normal samples in each tissue plotted against the malignancy continuum. Samples are colored based on if they are from different disease stage. |
Top |
Malignant transformation related pathway analysis |
| Find out the enriched GO biological processes and KEGG pathways involved in transition from healthy to precancer to cancer |
| Tissue | Disease Stage | Enriched GO biological Processes |
| Colorectum | AD |  |
| Colorectum | SER |  |
| Colorectum | MSS |  |
| Colorectum | MSI-H |  |
| Colorectum | FAP |  |
| ∗Top 15 enriched GO BP terms are showed in the bar plot of each disease state in each tissue. Each row represents a significant GO biological process which is colored according to the -log10(p.adjust). |
| Page: 1 2 3 4 5 6 7 8 9 |
| GO ID | Tissue | Disease Stage | Description | Gene Ratio | Bg Ratio | pvalue | p.adjust | Count |
| Page: 1 |
| Pathway ID | Tissue | Disease Stage | Description | Gene Ratio | Bg Ratio | pvalue | p.adjust | qvalue | Count |
| Page: 1 |
Top |
Cell-cell communication analysis |
| Identification of potential cell-cell interactions between two cell types and their ligand-receptor pairs for different disease states |
| Ligand | Receptor | LRpair | Pathway | Tissue | Disease Stage |
| Page: 1 |
Top |
Single-cell gene regulatory network inference analysis |
| Find out the significant the regulons (TFs) and the target genes of each regulon across cell types for different disease states |
| TF | Cell Type | Tissue | Disease Stage | Target Gene | RSS | Regulon Activity |
| ∗The dot plots of a searched regulon are shown for all cell subpopulations in each disease state of each tissue based on the regulon specific score inferred using pySCENIC and by calculating the average expression. |
| Page: 1 |
Top |
Somatic mutation of malignant transformation related genes |
| Annotation of somatic variants for genes involved in malignant transformation |
| Hugo Symbol | Variant Class | Variant Classification | dbSNP RS | HGVSc | HGVSp | HGVSp Short | SWISSPROT | BIOTYPE | SIFT | PolyPhen | Tumor Sample Barcode | Tissue | Histology | Sex | Age | Stage | Therapy Types | Drugs | Outcome |
| GPR39 | SNV | Missense_Mutation | c.1124N>A | p.Arg375His | p.R375H | O43194 | protein_coding | deleterious(0.02) | possibly_damaging(0.813) | TCGA-AN-A046-01 | Breast | breast invasive carcinoma | Female | >=65 | I/II | Unknown | Unknown | SD | |
| GPR39 | SNV | Missense_Mutation | novel | c.285N>G | p.Ile95Met | p.I95M | O43194 | protein_coding | deleterious(0) | probably_damaging(1) | TCGA-BH-A2L8-01 | Breast | breast invasive carcinoma | Female | <65 | I/II | Chemotherapy | cytoxan | CR |
| GPR39 | SNV | Missense_Mutation | novel | c.586N>C | p.Thr196Pro | p.T196P | O43194 | protein_coding | tolerated(0.27) | benign(0.007) | TCGA-C8-A27A-01 | Breast | breast invasive carcinoma | Female | <65 | I/II | Chemotherapy | 5-fluorouracil | CR |
| GPR39 | SNV | Missense_Mutation | novel | c.1112A>T | p.Glu371Val | p.E371V | O43194 | protein_coding | deleterious(0.01) | benign(0.109) | TCGA-PE-A5DC-01 | Breast | breast invasive carcinoma | Female | >=65 | III/IV | Unknown | Unknown | SD |
| GPR39 | SNV | Missense_Mutation | novel | c.1246N>A | p.Glu416Lys | p.E416K | O43194 | protein_coding | deleterious(0.01) | benign(0.01) | TCGA-Z7-A8R6-01 | Breast | breast invasive carcinoma | Female | <65 | I/II | Chemotherapy | taxol | CR |
| GPR39 | insertion | Nonsense_Mutation | novel | c.476_477insTCAATTTTAGTATATGTGCTGCCAAAGTGAG | p.Trp160GlnfsTer3 | p.W160Qfs*3 | O43194 | protein_coding | TCGA-A8-A09Q-01 | Breast | breast invasive carcinoma | Female | >=65 | III/IV | Hormone Therapy | anastrozole | SD | ||
| GPR39 | deletion | Frame_Shift_Del | novel | c.420delC | p.Phe141SerfsTer12 | p.F141Sfs*12 | O43194 | protein_coding | TCGA-D8-A27V-01 | Breast | breast invasive carcinoma | Female | <65 | I/II | Hormone Therapy | tamoxiphen | SD | ||
| GPR39 | SNV | Missense_Mutation | c.1169N>A | p.Arg390His | p.R390H | O43194 | protein_coding | deleterious(0.01) | possibly_damaging(0.765) | TCGA-EA-A3HQ-01 | Cervix | cervical & endocervical cancer | Female | <65 | I/II | Unknown | Unknown | SD | |
| GPR39 | SNV | Missense_Mutation | c.1193G>T | p.Arg398Leu | p.R398L | O43194 | protein_coding | deleterious(0.01) | benign(0.168) | TCGA-EK-A2RC-01 | Cervix | cervical & endocervical cancer | Female | <65 | I/II | Unknown | Unknown | SD | |
| GPR39 | SNV | Missense_Mutation | novel | c.1007N>C | p.Ser336Thr | p.S336T | O43194 | protein_coding | deleterious(0) | probably_damaging(0.999) | TCGA-VS-A9U5-01 | Cervix | cervical & endocervical cancer | Female | <65 | I/II | Chemotherapy | cisplatin | CR |
| Page: 1 2 3 4 5 6 7 |
Top |
Related drugs of malignant transformation related genes |
| Identification of chemicals and drugs interact with genes involved in malignant transfromation |
| (DGIdb 4.0) |
| Entrez ID | Symbol | Category | Interaction Types | Drug Claim Name | Drug Name | PMIDs |
| 2863 | GPR39 | G PROTEIN COUPLED RECEPTOR, DRUGGABLE GENOME, CELL SURFACE | agonist | 135652747 | ||
| 2863 | GPR39 | G PROTEIN COUPLED RECEPTOR, DRUGGABLE GENOME, CELL SURFACE | agonist | 223366134 | ||
| 2863 | GPR39 | G PROTEIN COUPLED RECEPTOR, DRUGGABLE GENOME, CELL SURFACE | agonist | 223366131 |
| Page: 1 |

Copyright 2023-Present -The University of Texas Health Science Center at Houston |