
|
|||||
|
 | |
| |
| |
| |
| |
| |
|
Gene: GPR183 |
Gene summary for GPR183 |
| Gene information | Species | Human | Gene symbol | GPR183 | Gene ID | 1880 |
| Gene name | G protein-coupled receptor 183 | |
| Gene Alias | EBI2 | |
| Cytomap | 13q32.3 | |
| Gene Type | protein-coding | GO ID | GO:0000165 | UniProtAcc | A0A024RDX2 |
Top |
Malignant transformation analysis |
| Identification of the aberrant gene expression in precancerous and cancerous lesions by comparing the gene expression of stem-like cells in diseased tissues with normal stem cells |
| Entrez ID | Symbol | Replicates | Species | Organ | Tissue | Adj P-value | Log2FC | Malignancy |
| 1880 | GPR183 | C21 | Human | Oral cavity | OSCC | 7.83e-10 | 5.09e-01 | 0.2678 |
| 1880 | GPR183 | C30 | Human | Oral cavity | OSCC | 2.87e-11 | 5.17e-01 | 0.3055 |
| 1880 | GPR183 | C51 | Human | Oral cavity | OSCC | 8.35e-07 | 3.39e-01 | 0.2674 |
| 1880 | GPR183 | C06 | Human | Oral cavity | OSCC | 1.47e-03 | 8.47e-01 | 0.2699 |
| 1880 | GPR183 | C09 | Human | Oral cavity | OSCC | 6.40e-07 | 3.07e-01 | 0.1431 |
| 1880 | GPR183 | LN46 | Human | Oral cavity | OSCC | 1.51e-11 | 5.55e-01 | 0.1666 |
| 1880 | GPR183 | EOLP-1 | Human | Oral cavity | EOLP | 4.98e-09 | 6.32e-01 | -0.0202 |
| Page: 1 |
| Tissue | Expression Dynamics | Abbreviation |
| Oral Cavity | 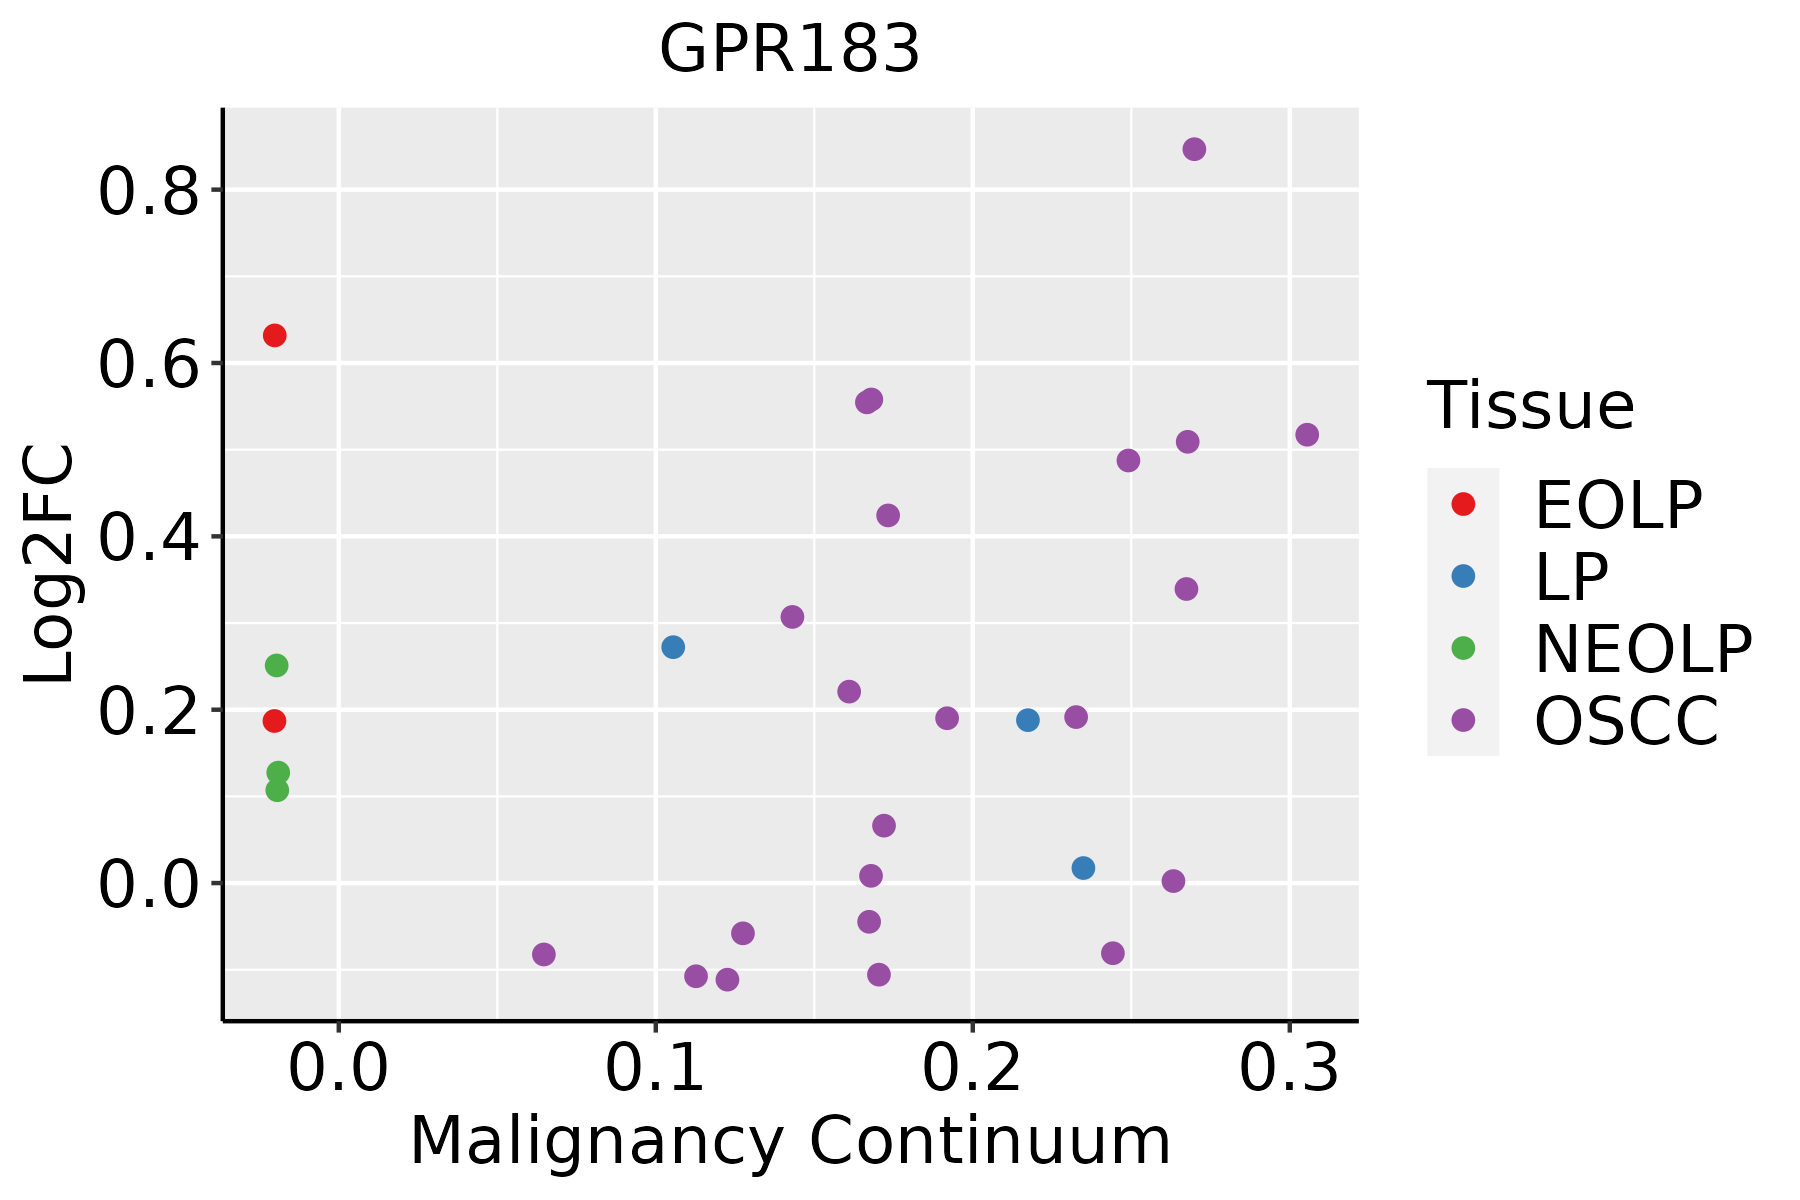 | EOLP: Erosive Oral lichen planus |
| LP: leukoplakia | ||
| NEOLP: Non-erosive oral lichen planus | ||
| OSCC: Oral squamous cell carcinoma |
| ∗log2FC in expression of this searched gene in stem-like cells from each diseased tissue sample relative to stem-like cells in normal samples in each tissue plotted against the malignancy continuum. Samples are colored based on if they are from different disease stage. |
Top |
Malignant transformation related pathway analysis |
| Find out the enriched GO biological processes and KEGG pathways involved in transition from healthy to precancer to cancer |
| Tissue | Disease Stage | Enriched GO biological Processes |
| Colorectum | AD |  |
| Colorectum | SER |  |
| Colorectum | MSS |  |
| Colorectum | MSI-H |  |
| Colorectum | FAP |  |
| ∗Top 15 enriched GO BP terms are showed in the bar plot of each disease state in each tissue. Each row represents a significant GO biological process which is colored according to the -log10(p.adjust). |
| Page: 1 2 3 4 5 6 7 8 9 |
| GO ID | Tissue | Disease Stage | Description | Gene Ratio | Bg Ratio | pvalue | p.adjust | Count |
| GO:003009920 | Oral cavity | OSCC | myeloid cell differentiation | 213/7305 | 381/18723 | 1.24e-11 | 4.42e-10 | 213 |
| GO:004887220 | Oral cavity | OSCC | homeostasis of number of cells | 152/7305 | 272/18723 | 1.08e-08 | 2.23e-07 | 152 |
| GO:000257310 | Oral cavity | OSCC | myeloid leukocyte differentiation | 119/7305 | 208/18723 | 7.29e-08 | 1.29e-06 | 119 |
| GO:004211016 | Oral cavity | OSCC | T cell activation | 245/7305 | 487/18723 | 2.00e-07 | 3.22e-06 | 245 |
| GO:19031316 | Oral cavity | OSCC | mononuclear cell differentiation | 210/7305 | 426/18723 | 8.44e-06 | 9.02e-05 | 210 |
| GO:00420635 | Oral cavity | OSCC | gliogenesis | 154/7305 | 301/18723 | 1.10e-05 | 1.14e-04 | 154 |
| GO:00300983 | Oral cavity | OSCC | lymphocyte differentiation | 179/7305 | 374/18723 | 2.74e-04 | 1.74e-03 | 179 |
| GO:005090010 | Oral cavity | OSCC | leukocyte migration | 176/7305 | 369/18723 | 3.80e-04 | 2.31e-03 | 176 |
| GO:00302175 | Oral cavity | OSCC | T cell differentiation | 126/7305 | 257/18723 | 6.51e-04 | 3.66e-03 | 126 |
| GO:0001776 | Oral cavity | OSCC | leukocyte homeostasis | 48/7305 | 87/18723 | 1.60e-03 | 7.62e-03 | 48 |
| GO:00603269 | Oral cavity | OSCC | cell chemotaxis | 146/7305 | 310/18723 | 2.13e-03 | 9.80e-03 | 146 |
| GO:00726783 | Oral cavity | OSCC | T cell migration | 37/7305 | 66/18723 | 3.66e-03 | 1.51e-02 | 37 |
| GO:00305959 | Oral cavity | OSCC | leukocyte chemotaxis | 110/7305 | 230/18723 | 3.86e-03 | 1.58e-02 | 110 |
| GO:0008347 | Oral cavity | OSCC | glial cell migration | 30/7305 | 53/18723 | 7.03e-03 | 2.61e-02 | 30 |
| GO:00509204 | Oral cavity | OSCC | regulation of chemotaxis | 105/7305 | 223/18723 | 8.27e-03 | 3.01e-02 | 105 |
| GO:00434107 | Oral cavity | OSCC | positive regulation of MAPK cascade | 213/7305 | 480/18723 | 8.71e-03 | 3.16e-02 | 213 |
| GO:00706618 | Oral cavity | OSCC | leukocyte proliferation | 145/7305 | 318/18723 | 9.31e-03 | 3.33e-02 | 145 |
| GO:00703716 | Oral cavity | OSCC | ERK1 and ERK2 cascade | 150/7305 | 330/18723 | 9.47e-03 | 3.38e-02 | 150 |
| GO:00303164 | Oral cavity | OSCC | osteoclast differentiation | 48/7305 | 94/18723 | 1.16e-02 | 3.92e-02 | 48 |
| GO:00703724 | Oral cavity | OSCC | regulation of ERK1 and ERK2 cascade | 140/7305 | 309/18723 | 1.34e-02 | 4.46e-02 | 140 |
| Page: 1 2 3 |
| Pathway ID | Tissue | Disease Stage | Description | Gene Ratio | Bg Ratio | pvalue | p.adjust | qvalue | Count |
| Page: 1 |
Top |
Cell-cell communication analysis |
| Identification of potential cell-cell interactions between two cell types and their ligand-receptor pairs for different disease states |
| Ligand | Receptor | LRpair | Pathway | Tissue | Disease Stage |
| Page: 1 |
Top |
Single-cell gene regulatory network inference analysis |
| Find out the significant the regulons (TFs) and the target genes of each regulon across cell types for different disease states |
| TF | Cell Type | Tissue | Disease Stage | Target Gene | RSS | Regulon Activity |
| ∗The dot plots of a searched regulon are shown for all cell subpopulations in each disease state of each tissue based on the regulon specific score inferred using pySCENIC and by calculating the average expression. |
| Page: 1 |
Top |
Somatic mutation of malignant transformation related genes |
| Annotation of somatic variants for genes involved in malignant transformation |
| Hugo Symbol | Variant Class | Variant Classification | dbSNP RS | HGVSc | HGVSp | HGVSp Short | SWISSPROT | BIOTYPE | SIFT | PolyPhen | Tumor Sample Barcode | Tissue | Histology | Sex | Age | Stage | Therapy Types | Drugs | Outcome |
| GPR183 | SNV | Missense_Mutation | c.509N>T | p.Pro170Leu | p.P170L | P32249 | protein_coding | deleterious(0.01) | benign(0.209) | TCGA-D8-A1XQ-01 | Breast | breast invasive carcinoma | Female | >=65 | I/II | Unknown | Unknown | SD | |
| GPR183 | insertion | Nonsense_Mutation | novel | c.891_892insGGTGAAGAATGAGAAAATGAAAAGCA | p.Asn298GlyfsTer4 | p.N298Gfs*4 | P32249 | protein_coding | TCGA-A8-A0A2-01 | Breast | breast invasive carcinoma | Female | >=65 | I/II | Hormone Therapy | tamoxiphen | SD | ||
| GPR183 | insertion | In_Frame_Ins | novel | c.145_146insTTCTTTTATCTGTTCAGTTTTCTGCCTCCTCCCTCC | p.Asn49delinsIleLeuLeuSerValGlnPheSerAlaSerSerLeuHis | p.N49delinsILLSVQFSASSLH | P32249 | protein_coding | TCGA-BH-A0B1-01 | Breast | breast invasive carcinoma | Female | >=65 | I/II | Chemotherapy | adriamycin | SD | ||
| GPR183 | insertion | In_Frame_Ins | novel | c.973_974insAAATAT | p.Arg325delinsGlnIleTrp | p.R325delinsQIW | P32249 | protein_coding | TCGA-BH-A0HK-01 | Breast | breast invasive carcinoma | Female | >=65 | I/II | Hormone Therapy | arimidex | SD | ||
| GPR183 | insertion | Frame_Shift_Ins | novel | c.972_973insAGAAACAACC | p.Gln326AsnfsTer11 | p.Q326Nfs*11 | P32249 | protein_coding | TCGA-BH-A0HK-01 | Breast | breast invasive carcinoma | Female | >=65 | I/II | Hormone Therapy | arimidex | SD | ||
| GPR183 | SNV | Missense_Mutation | c.216N>G | p.Asn72Lys | p.N72K | P32249 | protein_coding | deleterious(0) | probably_damaging(0.998) | TCGA-DS-A0VN-01 | Cervix | cervical & endocervical cancer | Female | <65 | I/II | Chemotherapy | cisplatin | SD | |
| GPR183 | SNV | Missense_Mutation | c.817N>T | p.Arg273Cys | p.R273C | P32249 | protein_coding | tolerated(0.18) | benign(0.003) | TCGA-AA-3510-01 | Colorectum | colon adenocarcinoma | Male | >=65 | I/II | Unknown | Unknown | SD | |
| GPR183 | SNV | Missense_Mutation | c.359N>G | p.Asn120Ser | p.N120S | P32249 | protein_coding | tolerated(0.3) | possibly_damaging(0.905) | TCGA-AA-3672-01 | Colorectum | colon adenocarcinoma | Female | >=65 | III/IV | Unknown | Unknown | SD | |
| GPR183 | SNV | Missense_Mutation | c.281N>A | p.Gly94Asp | p.G94D | P32249 | protein_coding | tolerated(0.29) | benign(0.317) | TCGA-AA-3977-01 | Colorectum | colon adenocarcinoma | Male | >=65 | I/II | Unknown | Unknown | SD | |
| GPR183 | SNV | Missense_Mutation | novel | c.971A>C | p.Lys324Thr | p.K324T | P32249 | protein_coding | deleterious(0) | probably_damaging(0.921) | TCGA-AA-3984-01 | Colorectum | colon adenocarcinoma | Female | <65 | I/II | Unknown | Unknown | SD |
| Page: 1 2 3 4 |
Top |
Related drugs of malignant transformation related genes |
| Identification of chemicals and drugs interact with genes involved in malignant transfromation |
| (DGIdb 4.0) |
| Entrez ID | Symbol | Category | Interaction Types | Drug Claim Name | Drug Name | PMIDs |
| 1880 | GPR183 | G PROTEIN COUPLED RECEPTOR, DRUGGABLE GENOME | agonist | 135651392 | CHEMBL169046 | |
| 1880 | GPR183 | G PROTEIN COUPLED RECEPTOR, DRUGGABLE GENOME | agonist | 178101167 | ||
| 1880 | GPR183 | G PROTEIN COUPLED RECEPTOR, DRUGGABLE GENOME | agonist | 178101171 | ||
| 1880 | GPR183 | G PROTEIN COUPLED RECEPTOR, DRUGGABLE GENOME | agonist | 178101170 | ||
| 1880 | GPR183 | G PROTEIN COUPLED RECEPTOR, DRUGGABLE GENOME | agonist | 178101169 | ||
| 1880 | GPR183 | G PROTEIN COUPLED RECEPTOR, DRUGGABLE GENOME | agonist | 178101168 | ||
| 1880 | GPR183 | G PROTEIN COUPLED RECEPTOR, DRUGGABLE GENOME | agonist | 178101172 | ||
| 1880 | GPR183 | G PROTEIN COUPLED RECEPTOR, DRUGGABLE GENOME | agonist | 135651393 |
| Page: 1 |

Copyright 2023-Present -The University of Texas Health Science Center at Houston |