
|
|||||
|
 | |
| |
| |
| |
| |
| |
|
Gene: GPR160 |
Gene summary for GPR160 |
| Gene information | Species | Human | Gene symbol | GPR160 | Gene ID | 26996 |
| Gene name | G protein-coupled receptor 160 | |
| Gene Alias | GPCR1 | |
| Cytomap | 3q26.2 | |
| Gene Type | protein-coding | GO ID | GO:0007154 | UniProtAcc | Q9UJ42 |
Top |
Malignant transformation analysis |
| Identification of the aberrant gene expression in precancerous and cancerous lesions by comparing the gene expression of stem-like cells in diseased tissues with normal stem cells |
| Entrez ID | Symbol | Replicates | Species | Organ | Tissue | Adj P-value | Log2FC | Malignancy |
| 26996 | GPR160 | GSM4909282 | Human | Breast | IDC | 3.51e-04 | -1.30e-01 | -0.0288 |
| 26996 | GPR160 | GSM4909285 | Human | Breast | IDC | 1.05e-02 | 9.87e-02 | 0.21 |
| 26996 | GPR160 | GSM4909290 | Human | Breast | IDC | 1.17e-05 | 3.32e-01 | 0.2096 |
| 26996 | GPR160 | GSM4909291 | Human | Breast | IDC | 3.24e-04 | 3.45e-01 | 0.1753 |
| 26996 | GPR160 | GSM4909293 | Human | Breast | IDC | 3.58e-15 | 3.21e-01 | 0.1581 |
| 26996 | GPR160 | GSM4909298 | Human | Breast | IDC | 9.08e-12 | 3.56e-01 | 0.1551 |
| 26996 | GPR160 | GSM4909305 | Human | Breast | IDC | 1.60e-04 | 1.92e-01 | 0.0436 |
| 26996 | GPR160 | GSM4909306 | Human | Breast | IDC | 6.25e-07 | 3.52e-01 | 0.1564 |
| 26996 | GPR160 | GSM4909308 | Human | Breast | IDC | 4.06e-29 | 5.78e-01 | 0.158 |
| 26996 | GPR160 | GSM4909311 | Human | Breast | IDC | 1.34e-03 | 6.43e-03 | 0.1534 |
| 26996 | GPR160 | GSM4909312 | Human | Breast | IDC | 8.45e-07 | 4.54e-01 | 0.1552 |
| 26996 | GPR160 | GSM4909317 | Human | Breast | IDC | 4.45e-03 | 9.26e-02 | 0.1355 |
| 26996 | GPR160 | GSM4909319 | Human | Breast | IDC | 2.06e-05 | -1.78e-02 | 0.1563 |
| 26996 | GPR160 | brca3 | Human | Breast | Precancer | 4.21e-02 | 3.23e-03 | -0.0263 |
| 26996 | GPR160 | M1 | Human | Breast | IDC | 4.81e-09 | 3.67e-01 | 0.1577 |
| 26996 | GPR160 | P2 | Human | Breast | IDC | 3.12e-09 | 5.38e-01 | 0.21 |
| 26996 | GPR160 | DCIS2 | Human | Breast | DCIS | 1.83e-03 | -9.86e-02 | 0.0085 |
| 26996 | GPR160 | HTA11_1938_2000001011 | Human | Colorectum | AD | 3.10e-09 | 7.95e-01 | -0.0811 |
| 26996 | GPR160 | HTA11_347_2000001011 | Human | Colorectum | AD | 1.26e-12 | 6.46e-01 | -0.1954 |
| 26996 | GPR160 | HTA11_866_2000001011 | Human | Colorectum | AD | 1.58e-04 | 4.94e-01 | -0.1001 |
| Page: 1 2 3 4 |
| Tissue | Expression Dynamics | Abbreviation |
| Breast |  | IDC: Invasive ductal carcinoma |
| DCIS: Ductal carcinoma in situ | ||
| Precancer(BRCA1-mut): Precancerous lesion from BRCA1 mutation carriers | ||
| Colorectum (GSE201348) |  | FAP: Familial adenomatous polyposis |
| CRC: Colorectal cancer | ||
| Colorectum (HTA11) | 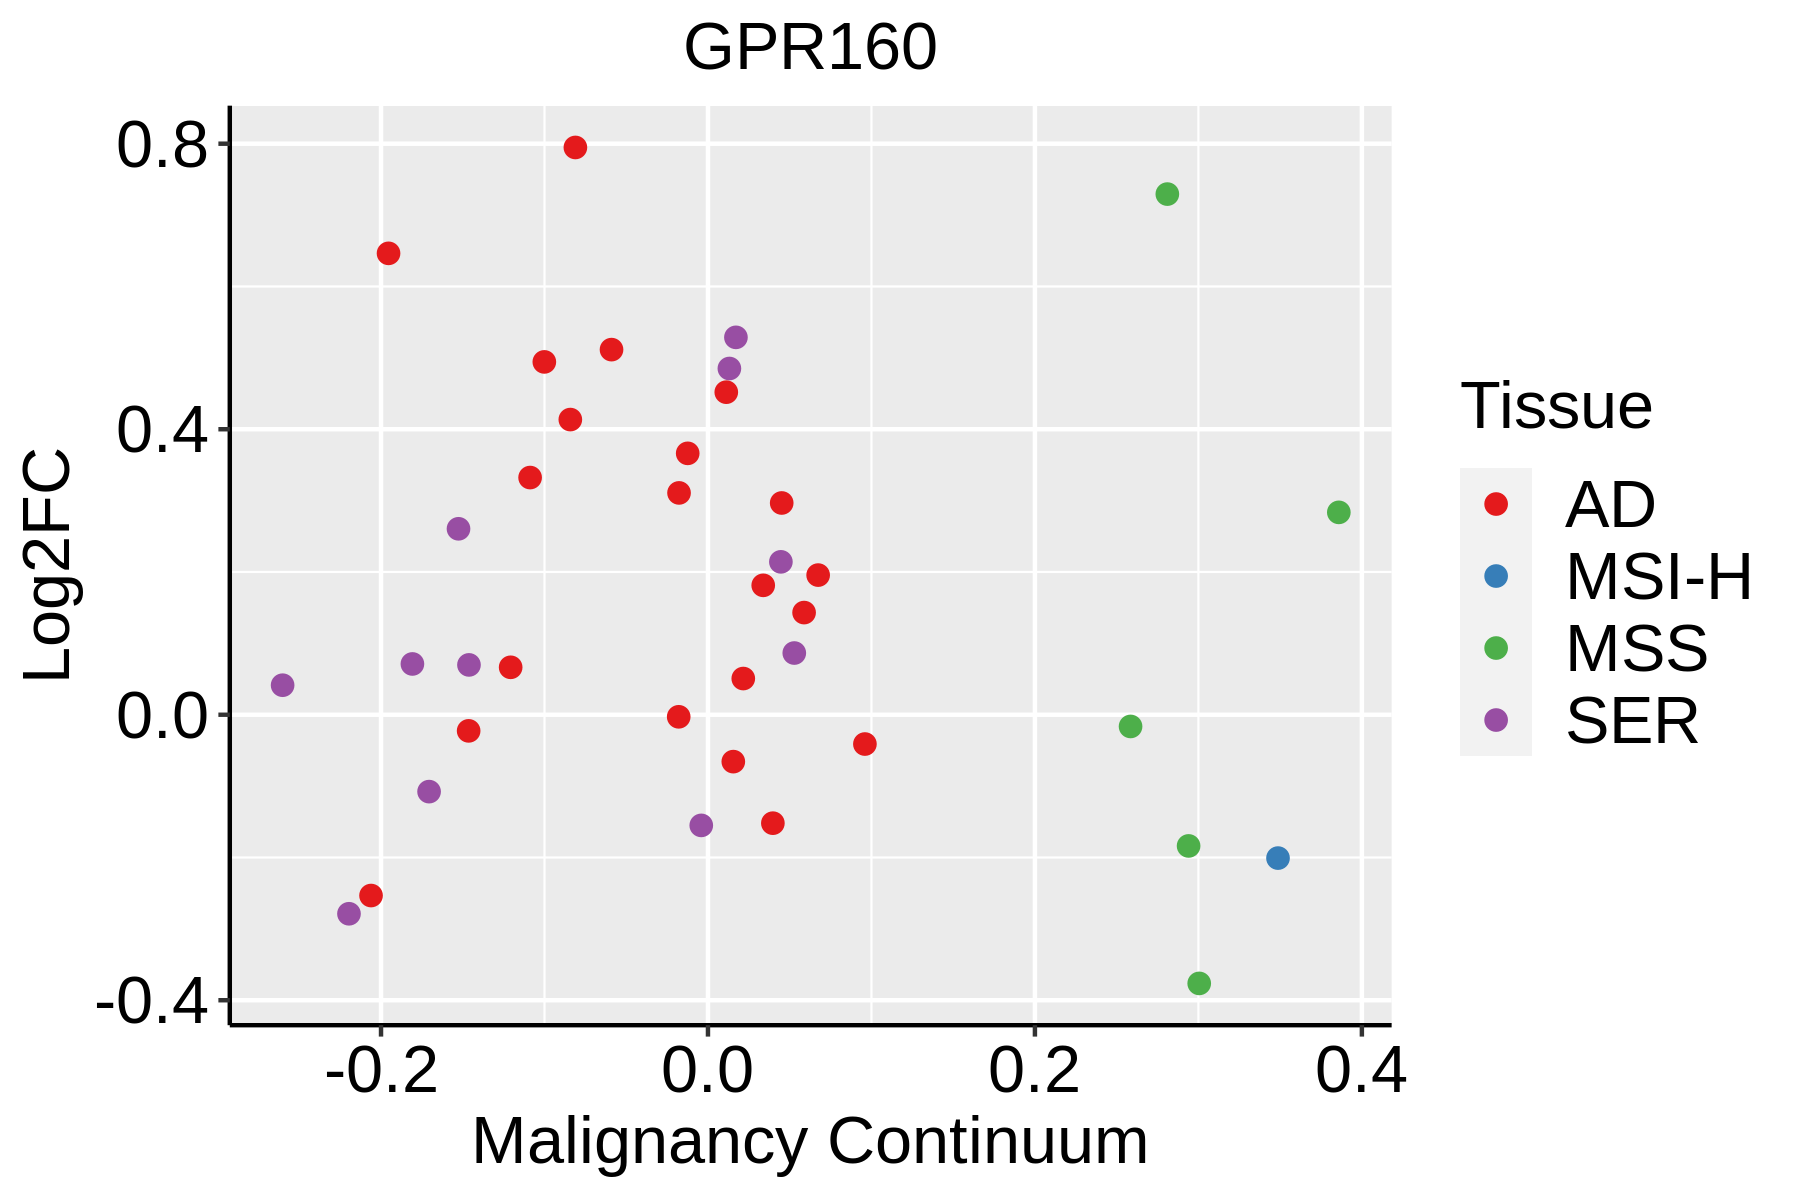 | AD: Adenomas |
| SER: Sessile serrated lesions | ||
| MSI-H: Microsatellite-high colorectal cancer | ||
| MSS: Microsatellite stable colorectal cancer | ||
| Esophagus | 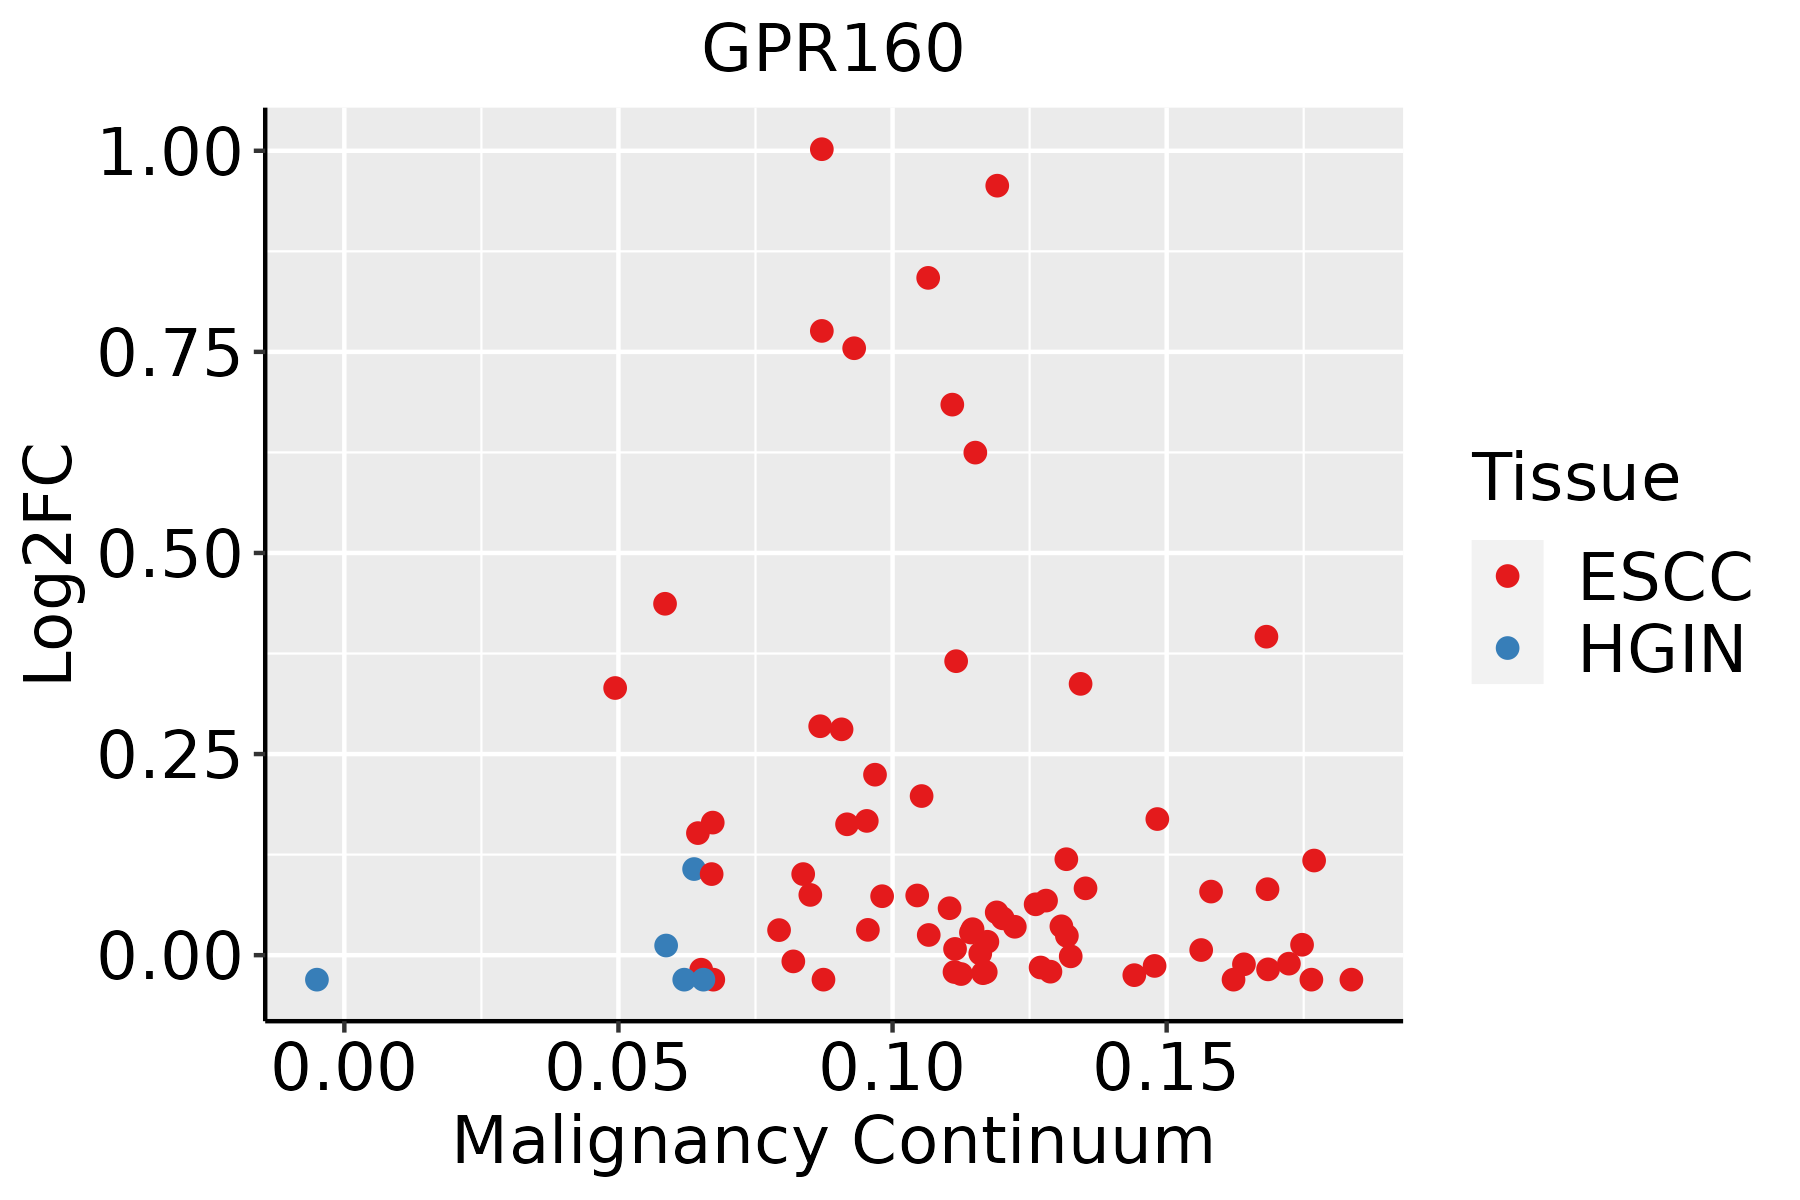 | ESCC: Esophageal squamous cell carcinoma |
| HGIN: High-grade intraepithelial neoplasias | ||
| LGIN: Low-grade intraepithelial neoplasias | ||
| Liver | 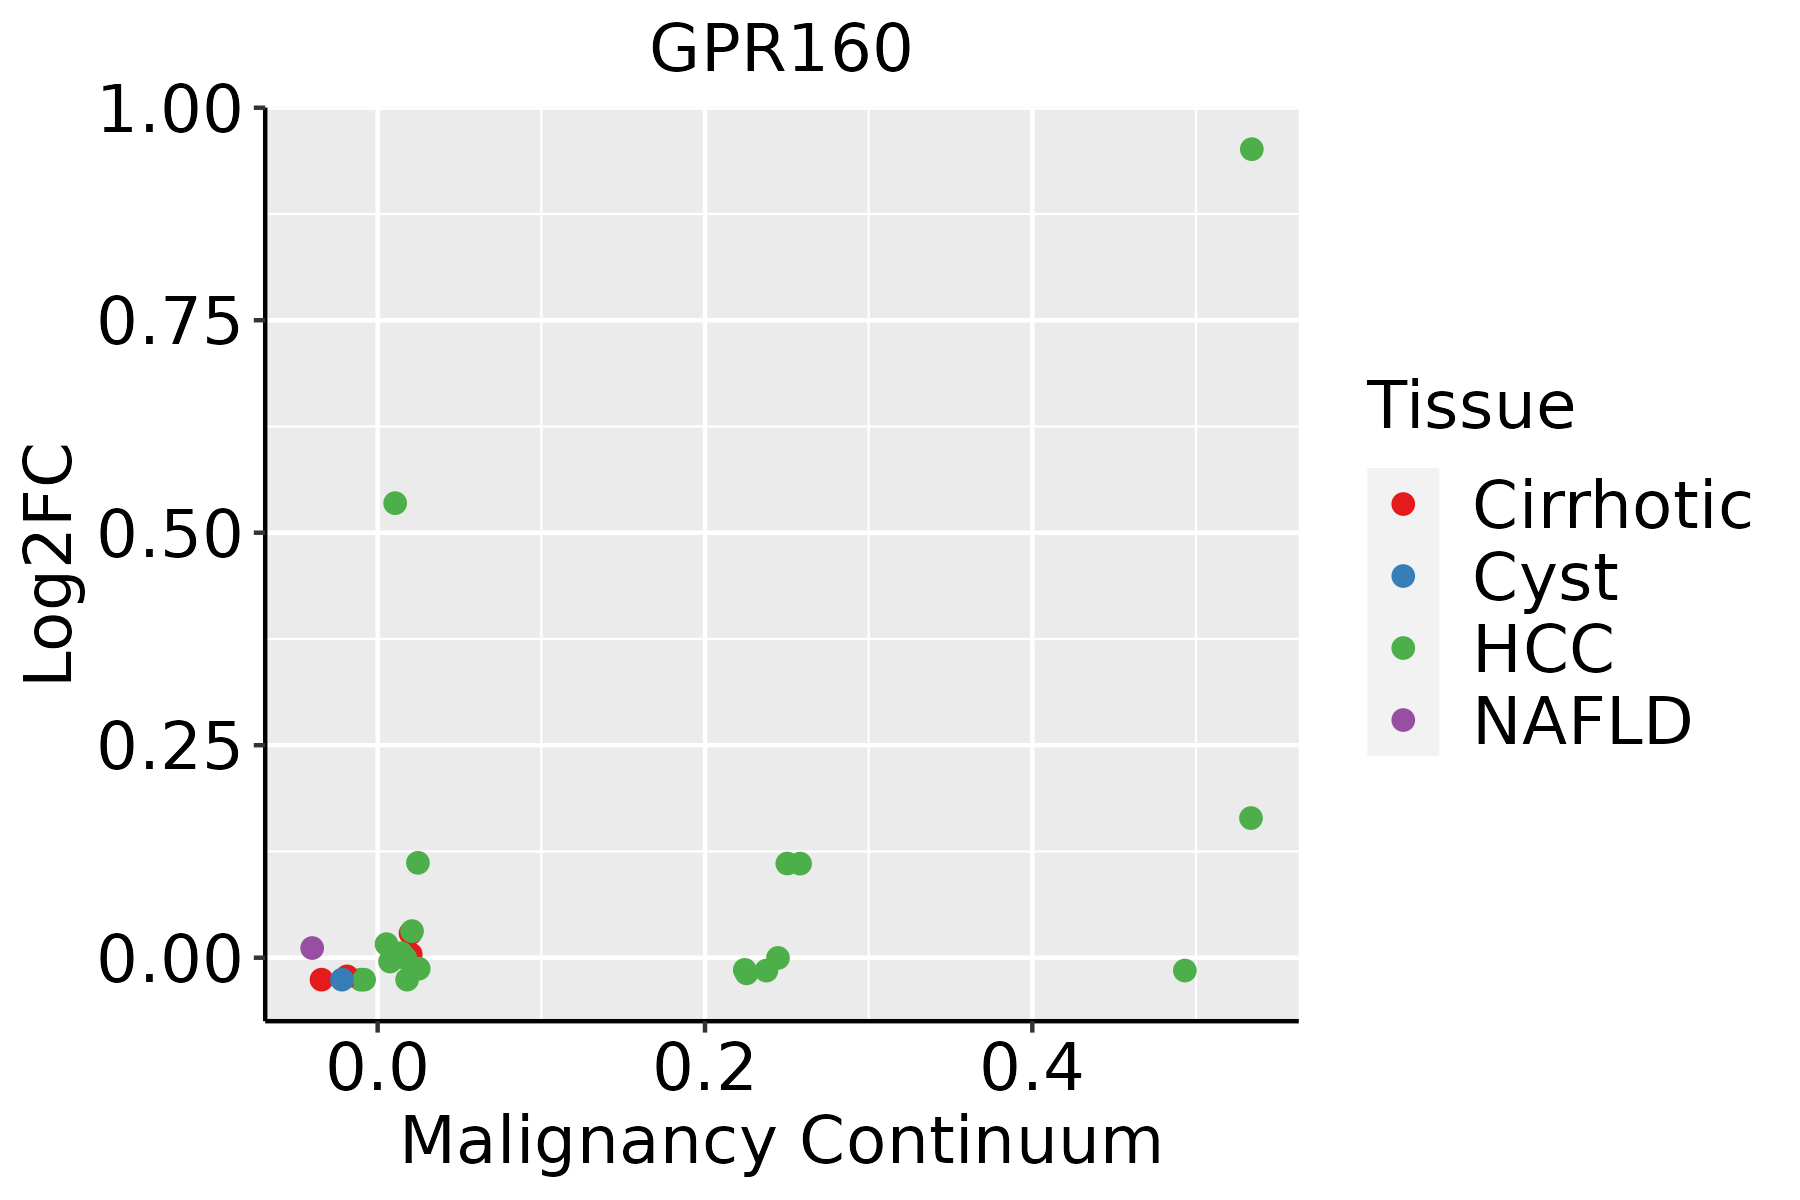 | HCC: Hepatocellular carcinoma |
| NAFLD: Non-alcoholic fatty liver disease | ||
| Prostate | 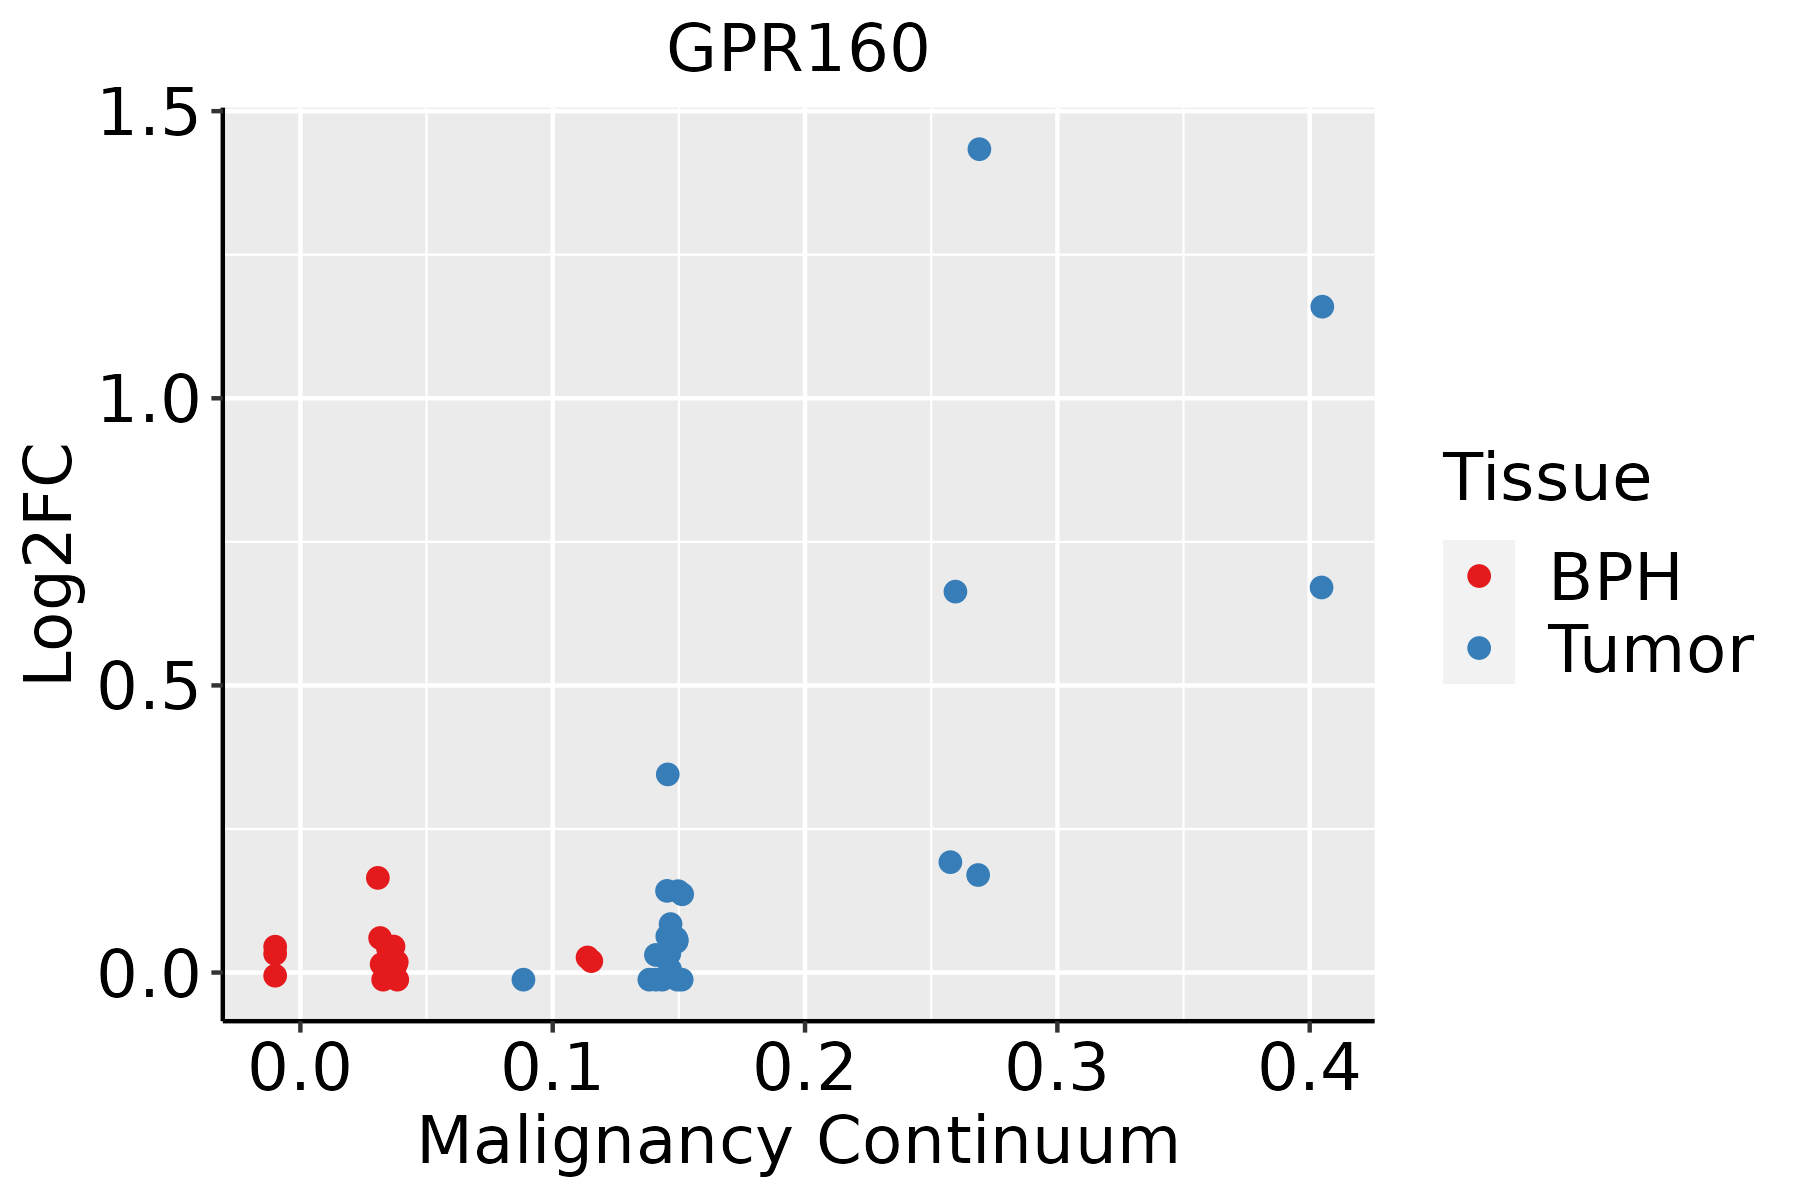 | BPH: Benign Prostatic Hyperplasia |
| ∗log2FC in expression of this searched gene in stem-like cells from each diseased tissue sample relative to stem-like cells in normal samples in each tissue plotted against the malignancy continuum. Samples are colored based on if they are from different disease stage. |
Top |
Malignant transformation related pathway analysis |
| Find out the enriched GO biological processes and KEGG pathways involved in transition from healthy to precancer to cancer |
| Tissue | Disease Stage | Enriched GO biological Processes |
| Colorectum | AD |  |
| Colorectum | SER |  |
| Colorectum | MSS |  |
| Colorectum | MSI-H |  |
| Colorectum | FAP |  |
| ∗Top 15 enriched GO BP terms are showed in the bar plot of each disease state in each tissue. Each row represents a significant GO biological process which is colored according to the -log10(p.adjust). |
| Page: 1 2 3 4 5 6 7 8 9 |
| GO ID | Tissue | Disease Stage | Description | Gene Ratio | Bg Ratio | pvalue | p.adjust | Count |
| Page: 1 |
| Pathway ID | Tissue | Disease Stage | Description | Gene Ratio | Bg Ratio | pvalue | p.adjust | qvalue | Count |
| Page: 1 |
Top |
Cell-cell communication analysis |
| Identification of potential cell-cell interactions between two cell types and their ligand-receptor pairs for different disease states |
| Ligand | Receptor | LRpair | Pathway | Tissue | Disease Stage |
| Page: 1 |
Top |
Single-cell gene regulatory network inference analysis |
| Find out the significant the regulons (TFs) and the target genes of each regulon across cell types for different disease states |
| TF | Cell Type | Tissue | Disease Stage | Target Gene | RSS | Regulon Activity |
| ∗The dot plots of a searched regulon are shown for all cell subpopulations in each disease state of each tissue based on the regulon specific score inferred using pySCENIC and by calculating the average expression. |
| Page: 1 |
Top |
Somatic mutation of malignant transformation related genes |
| Annotation of somatic variants for genes involved in malignant transformation |
| Hugo Symbol | Variant Class | Variant Classification | dbSNP RS | HGVSc | HGVSp | HGVSp Short | SWISSPROT | BIOTYPE | SIFT | PolyPhen | Tumor Sample Barcode | Tissue | Histology | Sex | Age | Stage | Therapy Types | Drugs | Outcome |
| GPR160 | SNV | Missense_Mutation | c.395N>A | p.Phe132Tyr | p.F132Y | Q9UJ42 | protein_coding | tolerated(1) | benign(0.116) | TCGA-A2-A0YF-01 | Breast | breast invasive carcinoma | Female | >=65 | I/II | Unspecific | Arimidex | SD | |
| GPR160 | SNV | Missense_Mutation | novel | c.374N>T | p.Ser125Phe | p.S125F | Q9UJ42 | protein_coding | tolerated(0.08) | benign(0.026) | TCGA-A8-A09I-01 | Breast | breast invasive carcinoma | Female | >=65 | I/II | Hormone Therapy | anastrozole | SD |
| GPR160 | SNV | Missense_Mutation | novel | c.295N>G | p.Gln99Glu | p.Q99E | Q9UJ42 | protein_coding | deleterious(0.02) | benign(0.017) | TCGA-ZJ-AAXU-01 | Cervix | cervical & endocervical cancer | Female | <65 | I/II | Unknown | Unknown | SD |
| GPR160 | SNV | Missense_Mutation | novel | c.501N>T | p.Gln167His | p.Q167H | Q9UJ42 | protein_coding | tolerated(0.16) | benign(0.006) | TCGA-CA-6717-01 | Colorectum | colon adenocarcinoma | Male | <65 | I/II | Chemotherapy | oxaliplatin | CR |
| GPR160 | SNV | Missense_Mutation | rs372339784 | c.515G>A | p.Arg172His | p.R172H | Q9UJ42 | protein_coding | tolerated(0.51) | benign(0) | TCGA-F4-6570-01 | Colorectum | colon adenocarcinoma | Female | >=65 | I/II | Unknown | Unknown | SD |
| GPR160 | SNV | Missense_Mutation | c.745N>A | p.Leu249Ile | p.L249I | Q9UJ42 | protein_coding | deleterious(0.01) | probably_damaging(0.959) | TCGA-AG-A002-01 | Colorectum | rectum adenocarcinoma | Male | <65 | I/II | Unknown | Unknown | SD | |
| GPR160 | deletion | Frame_Shift_Del | c.715delA | p.Ile239TyrfsTer22 | p.I239Yfs*22 | Q9UJ42 | protein_coding | TCGA-A6-6781-01 | Colorectum | colon adenocarcinoma | Male | <65 | III/IV | Chemotherapy | oxaliplatin | SD | |||
| GPR160 | deletion | Frame_Shift_Del | c.715delA | p.Ile239TyrfsTer22 | p.I239Yfs*22 | Q9UJ42 | protein_coding | TCGA-AA-3672-01 | Colorectum | colon adenocarcinoma | Female | >=65 | III/IV | Unknown | Unknown | SD | |||
| GPR160 | deletion | Frame_Shift_Del | c.715delA | p.Ile239TyrfsTer22 | p.I239Yfs*22 | Q9UJ42 | protein_coding | TCGA-AA-3950-01 | Colorectum | colon adenocarcinoma | Female | >=65 | I/II | Unknown | Unknown | SD | |||
| GPR160 | insertion | In_Frame_Ins | novel | c.921_922insGAAGTAGTACAAATGGTAACCAGGTAC | p.Pro307_Leu308insGluValValGlnMetValThrArgTyr | p.P307_L308insEVVQMVTRY | Q9UJ42 | protein_coding | TCGA-AM-5820-01 | Colorectum | colon adenocarcinoma | Female | <65 | I/II | Unknown | Unknown | SD |
| Page: 1 2 3 4 |
Top |
Related drugs of malignant transformation related genes |
| Identification of chemicals and drugs interact with genes involved in malignant transfromation |
| (DGIdb 4.0) |
| Entrez ID | Symbol | Category | Interaction Types | Drug Claim Name | Drug Name | PMIDs |
| Page: 1 |

Copyright 2023-Present -The University of Texas Health Science Center at Houston |