
|
|||||
|
 | |
| |
| |
| |
| |
| |
|
Gene: GPR157 |
Gene summary for GPR157 |
| Gene information | Species | Human | Gene symbol | GPR157 | Gene ID | 80045 |
| Gene name | G protein-coupled receptor 157 | |
| Gene Alias | GPR157 | |
| Cytomap | 1p36.22 | |
| Gene Type | protein-coding | GO ID | GO:0006873 | UniProtAcc | Q5UAW9 |
Top |
Malignant transformation analysis |
| Identification of the aberrant gene expression in precancerous and cancerous lesions by comparing the gene expression of stem-like cells in diseased tissues with normal stem cells |
| Entrez ID | Symbol | Replicates | Species | Organ | Tissue | Adj P-value | Log2FC | Malignancy |
| 80045 | GPR157 | LZE24T | Human | Esophagus | ESCC | 1.50e-14 | 3.70e-01 | 0.0596 |
| 80045 | GPR157 | P1T-E | Human | Esophagus | ESCC | 3.00e-10 | 4.57e-01 | 0.0875 |
| 80045 | GPR157 | P2T-E | Human | Esophagus | ESCC | 2.78e-03 | 9.64e-02 | 0.1177 |
| 80045 | GPR157 | P4T-E | Human | Esophagus | ESCC | 1.78e-03 | 1.41e-01 | 0.1323 |
| 80045 | GPR157 | P5T-E | Human | Esophagus | ESCC | 1.00e-06 | 2.52e-01 | 0.1327 |
| 80045 | GPR157 | P8T-E | Human | Esophagus | ESCC | 8.58e-03 | 2.89e-02 | 0.0889 |
| 80045 | GPR157 | P9T-E | Human | Esophagus | ESCC | 2.52e-08 | 2.52e-01 | 0.1131 |
| 80045 | GPR157 | P11T-E | Human | Esophagus | ESCC | 1.03e-09 | 5.51e-01 | 0.1426 |
| 80045 | GPR157 | P20T-E | Human | Esophagus | ESCC | 1.05e-10 | 2.73e-01 | 0.1124 |
| 80045 | GPR157 | P21T-E | Human | Esophagus | ESCC | 3.02e-06 | 2.09e-01 | 0.1617 |
| 80045 | GPR157 | P22T-E | Human | Esophagus | ESCC | 7.50e-10 | 1.42e-01 | 0.1236 |
| 80045 | GPR157 | P23T-E | Human | Esophagus | ESCC | 5.19e-27 | 8.12e-01 | 0.108 |
| 80045 | GPR157 | P24T-E | Human | Esophagus | ESCC | 8.90e-08 | 1.65e-01 | 0.1287 |
| 80045 | GPR157 | P27T-E | Human | Esophagus | ESCC | 1.09e-14 | 2.87e-01 | 0.1055 |
| 80045 | GPR157 | P28T-E | Human | Esophagus | ESCC | 7.50e-15 | 3.52e-01 | 0.1149 |
| 80045 | GPR157 | P30T-E | Human | Esophagus | ESCC | 7.49e-09 | 3.12e-01 | 0.137 |
| 80045 | GPR157 | P31T-E | Human | Esophagus | ESCC | 6.25e-09 | 2.78e-01 | 0.1251 |
| 80045 | GPR157 | P32T-E | Human | Esophagus | ESCC | 1.76e-05 | 2.25e-01 | 0.1666 |
| 80045 | GPR157 | P36T-E | Human | Esophagus | ESCC | 3.17e-15 | 5.28e-01 | 0.1187 |
| 80045 | GPR157 | P37T-E | Human | Esophagus | ESCC | 2.78e-09 | 2.07e-01 | 0.1371 |
| Page: 1 2 3 |
| Tissue | Expression Dynamics | Abbreviation |
| Esophagus | 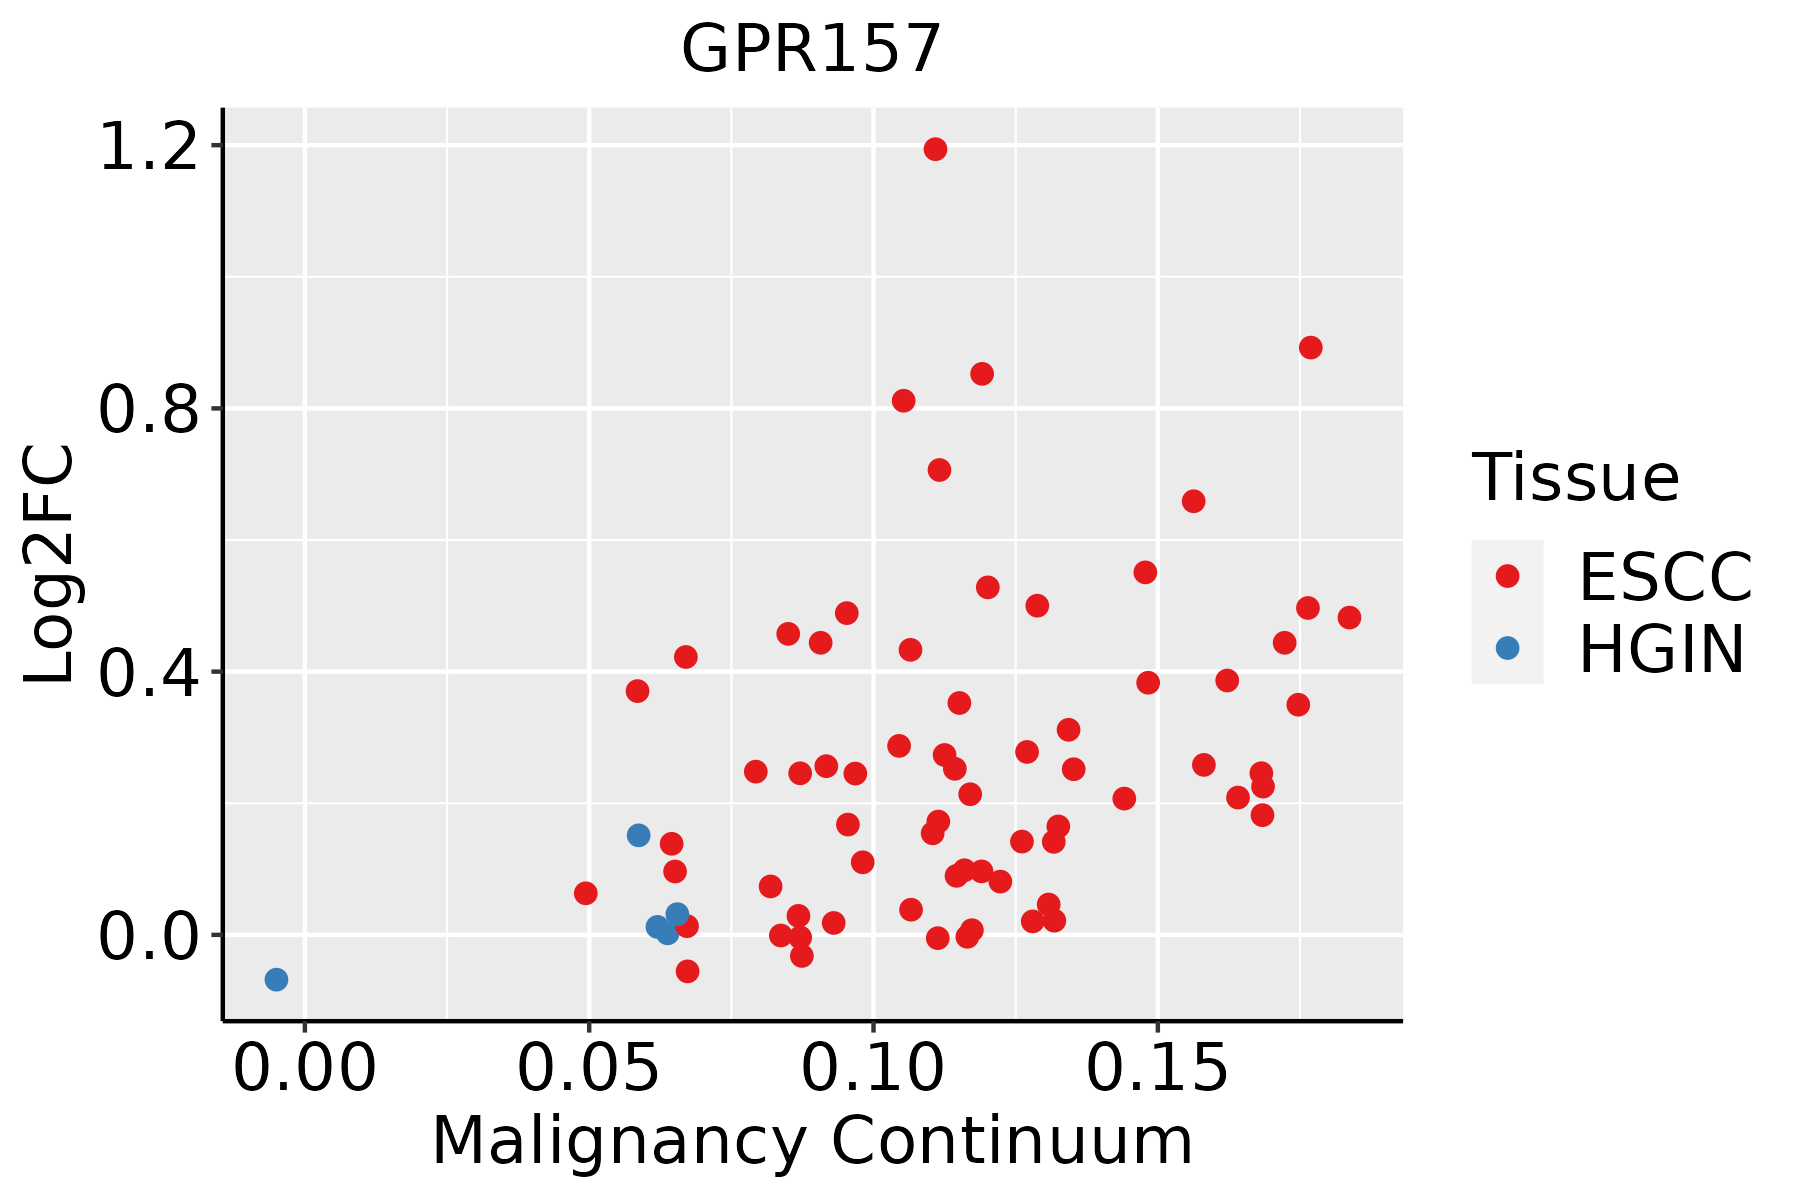 | ESCC: Esophageal squamous cell carcinoma |
| HGIN: High-grade intraepithelial neoplasias | ||
| LGIN: Low-grade intraepithelial neoplasias | ||
| Oral Cavity | 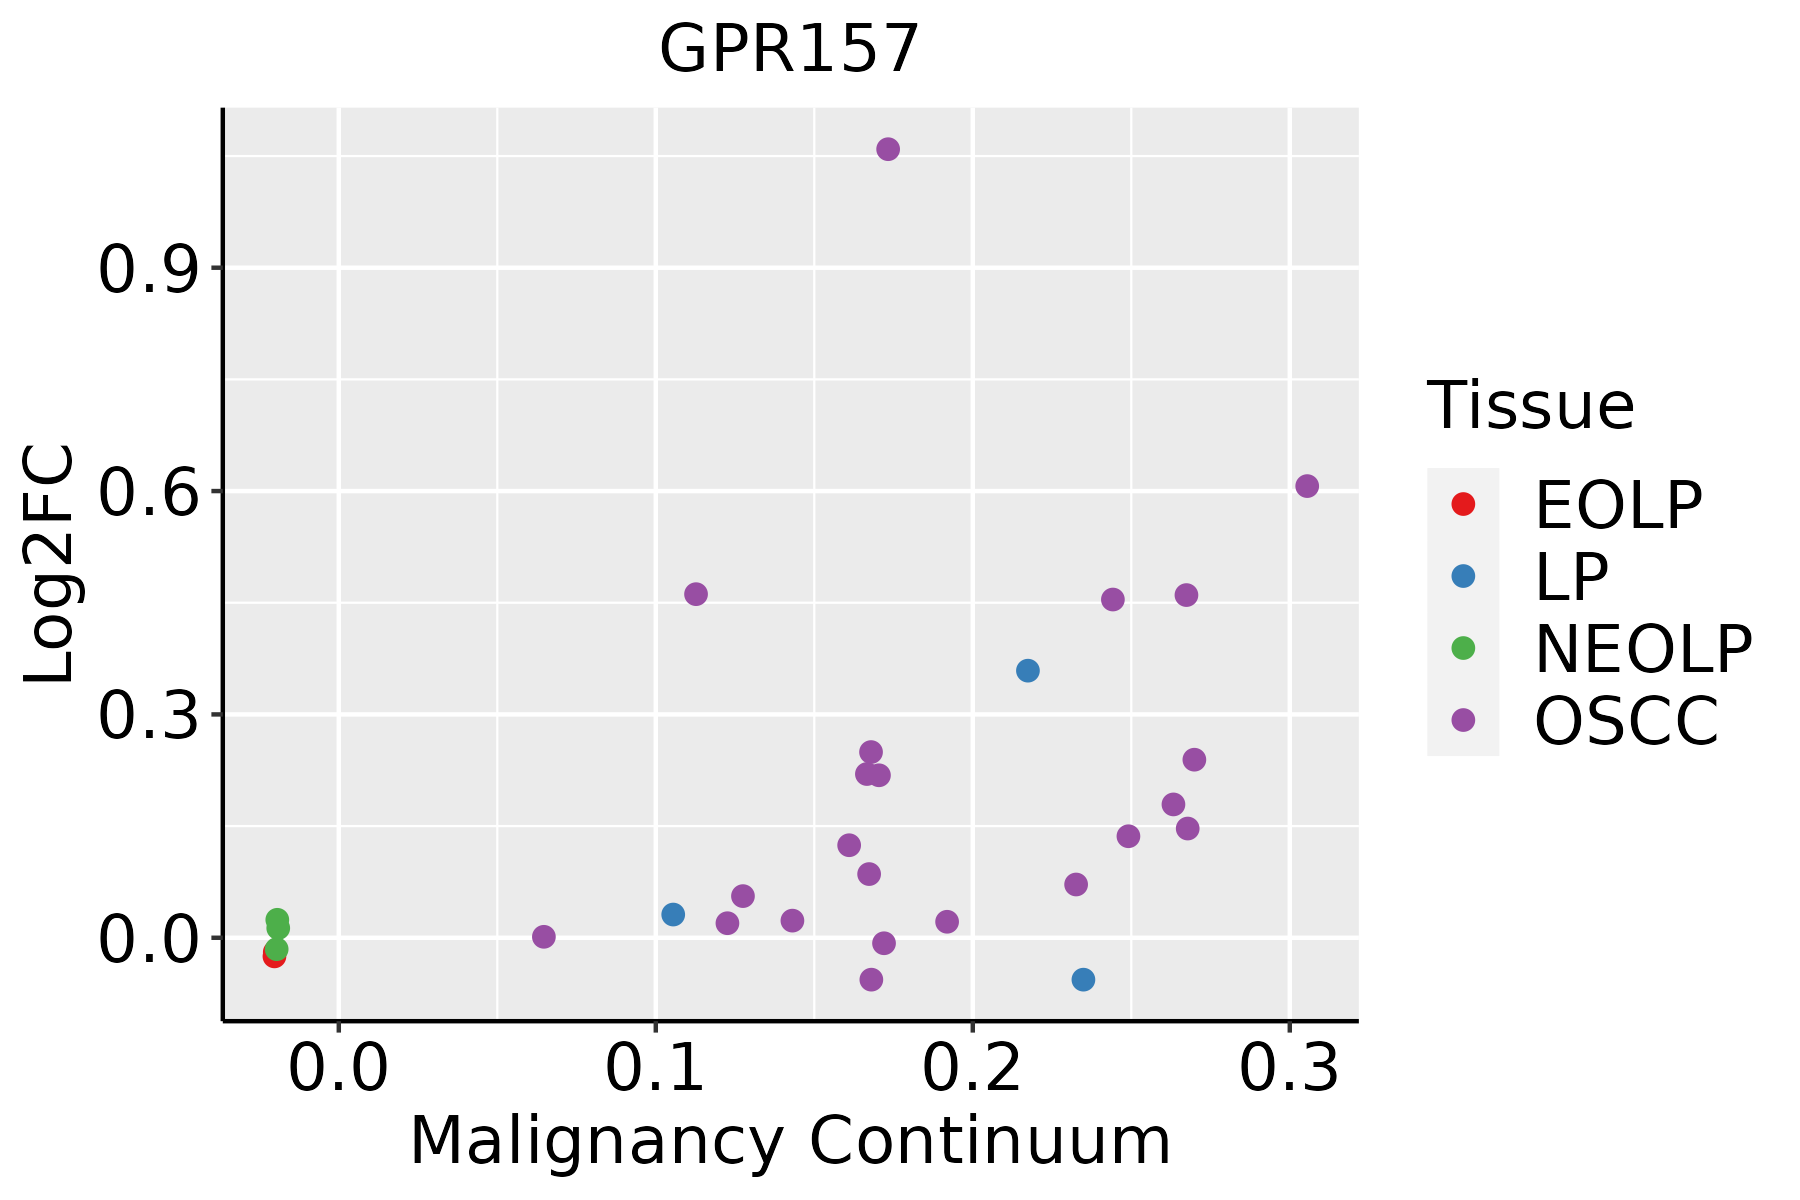 | EOLP: Erosive Oral lichen planus |
| LP: leukoplakia | ||
| NEOLP: Non-erosive oral lichen planus | ||
| OSCC: Oral squamous cell carcinoma |
| ∗log2FC in expression of this searched gene in stem-like cells from each diseased tissue sample relative to stem-like cells in normal samples in each tissue plotted against the malignancy continuum. Samples are colored based on if they are from different disease stage. |
Top |
Malignant transformation related pathway analysis |
| Find out the enriched GO biological processes and KEGG pathways involved in transition from healthy to precancer to cancer |
| Tissue | Disease Stage | Enriched GO biological Processes |
| Colorectum | AD |  |
| Colorectum | SER |  |
| Colorectum | MSS |  |
| Colorectum | MSI-H |  |
| Colorectum | FAP |  |
| ∗Top 15 enriched GO BP terms are showed in the bar plot of each disease state in each tissue. Each row represents a significant GO biological process which is colored according to the -log10(p.adjust). |
| Page: 1 2 3 4 5 6 7 8 9 |
| GO ID | Tissue | Disease Stage | Description | Gene Ratio | Bg Ratio | pvalue | p.adjust | Count |
| GO:00420636 | Esophagus | ESCC | gliogenesis | 172/8552 | 301/18723 | 3.75e-05 | 3.04e-04 | 172 |
| GO:00100016 | Esophagus | ESCC | glial cell differentiation | 129/8552 | 225/18723 | 2.73e-04 | 1.65e-03 | 129 |
| GO:004851118 | Esophagus | ESCC | rhythmic process | 164/8552 | 298/18723 | 6.80e-04 | 3.57e-03 | 164 |
| GO:000762319 | Esophagus | ESCC | circadian rhythm | 119/8552 | 210/18723 | 8.47e-04 | 4.36e-03 | 119 |
| GO:004851116 | Oral cavity | OSCC | rhythmic process | 157/7305 | 298/18723 | 1.00e-06 | 1.36e-05 | 157 |
| GO:00420635 | Oral cavity | OSCC | gliogenesis | 154/7305 | 301/18723 | 1.10e-05 | 1.14e-04 | 154 |
| GO:000762316 | Oral cavity | OSCC | circadian rhythm | 110/7305 | 210/18723 | 5.40e-05 | 4.48e-04 | 110 |
| GO:00100015 | Oral cavity | OSCC | glial cell differentiation | 110/7305 | 225/18723 | 1.56e-03 | 7.45e-03 | 110 |
| Page: 1 |
| Pathway ID | Tissue | Disease Stage | Description | Gene Ratio | Bg Ratio | pvalue | p.adjust | qvalue | Count |
| Page: 1 |
Top |
Cell-cell communication analysis |
| Identification of potential cell-cell interactions between two cell types and their ligand-receptor pairs for different disease states |
| Ligand | Receptor | LRpair | Pathway | Tissue | Disease Stage |
| Page: 1 |
Top |
Single-cell gene regulatory network inference analysis |
| Find out the significant the regulons (TFs) and the target genes of each regulon across cell types for different disease states |
| TF | Cell Type | Tissue | Disease Stage | Target Gene | RSS | Regulon Activity |
| ∗The dot plots of a searched regulon are shown for all cell subpopulations in each disease state of each tissue based on the regulon specific score inferred using pySCENIC and by calculating the average expression. |
| Page: 1 |
Top |
Somatic mutation of malignant transformation related genes |
| Annotation of somatic variants for genes involved in malignant transformation |
| Hugo Symbol | Variant Class | Variant Classification | dbSNP RS | HGVSc | HGVSp | HGVSp Short | SWISSPROT | BIOTYPE | SIFT | PolyPhen | Tumor Sample Barcode | Tissue | Histology | Sex | Age | Stage | Therapy Types | Drugs | Outcome |
| GPR157 | SNV | Missense_Mutation | c.593G>A | p.Arg198Lys | p.R198K | Q5UAW9 | protein_coding | tolerated(0.12) | benign(0.018) | TCGA-C8-A26Y-01 | Breast | breast invasive carcinoma | Female | >=65 | I/II | Unknown | Unknown | SD | |
| GPR157 | SNV | Missense_Mutation | c.974N>T | p.Ser325Phe | p.S325F | Q5UAW9 | protein_coding | tolerated_low_confidence(0.08) | benign(0) | TCGA-E9-A22E-01 | Breast | breast invasive carcinoma | Female | <65 | III/IV | Chemotherapy | cyclophosphane | SD | |
| GPR157 | SNV | Missense_Mutation | rs555957933 | c.920C>T | p.Pro307Leu | p.P307L | Q5UAW9 | protein_coding | tolerated(0.17) | benign(0.001) | TCGA-2W-A8YY-01 | Cervix | cervical & endocervical cancer | Female | <65 | I/II | Chemotherapy | cisplatin | CR |
| GPR157 | SNV | Missense_Mutation | novel | c.670G>A | p.Asp224Asn | p.D224N | Q5UAW9 | protein_coding | tolerated(0.11) | benign(0.137) | TCGA-2W-A8YY-01 | Cervix | cervical & endocervical cancer | Female | <65 | I/II | Chemotherapy | cisplatin | CR |
| GPR157 | SNV | Missense_Mutation | c.1002N>A | p.Ser334Arg | p.S334R | Q5UAW9 | protein_coding | deleterious_low_confidence(0.01) | benign(0.157) | TCGA-A6-6654-01 | Colorectum | colon adenocarcinoma | Female | >=65 | III/IV | Chemotherapy | oxaliplatin | SD | |
| GPR157 | SNV | Missense_Mutation | c.331G>A | p.Ala111Thr | p.A111T | Q5UAW9 | protein_coding | tolerated(0.44) | benign(0.007) | TCGA-A6-6781-01 | Colorectum | colon adenocarcinoma | Male | <65 | III/IV | Chemotherapy | oxaliplatin | SD | |
| GPR157 | SNV | Missense_Mutation | rs374315465 | c.763N>A | p.Val255Met | p.V255M | Q5UAW9 | protein_coding | tolerated(0.14) | probably_damaging(0.963) | TCGA-AY-A69D-01 | Colorectum | colon adenocarcinoma | Female | <65 | I/II | Unknown | Unknown | SD |
| GPR157 | SNV | Missense_Mutation | c.770N>T | p.Thr257Met | p.T257M | Q5UAW9 | protein_coding | tolerated(0.19) | benign(0.036) | TCGA-CI-6622-01 | Colorectum | rectum adenocarcinoma | Male | >=65 | I/II | Chemotherapy | 5-fluorouracil | SD | |
| GPR157 | SNV | Missense_Mutation | novel | c.1001N>T | p.Ser334Ile | p.S334I | Q5UAW9 | protein_coding | deleterious_low_confidence(0) | benign(0.205) | TCGA-A5-A0G1-01 | Endometrium | uterine corpus endometrioid carcinoma | Female | >=65 | I/II | Unknown | Unknown | SD |
| GPR157 | SNV | Missense_Mutation | rs183530083 | c.860N>A | p.Arg287Gln | p.R287Q | Q5UAW9 | protein_coding | deleterious(0) | probably_damaging(0.994) | TCGA-A5-A2K5-01 | Endometrium | uterine corpus endometrioid carcinoma | Female | >=65 | I/II | Unknown | Unknown | SD |
| Page: 1 2 3 |
Top |
Related drugs of malignant transformation related genes |
| Identification of chemicals and drugs interact with genes involved in malignant transfromation |
| (DGIdb 4.0) |
| Entrez ID | Symbol | Category | Interaction Types | Drug Claim Name | Drug Name | PMIDs |
| Page: 1 |

Copyright 2023-Present -The University of Texas Health Science Center at Houston |