
|
|||||
|
 | |
| |
| |
| |
| |
| |
|
Gene: GPR153 |
Gene summary for GPR153 |
| Gene information | Species | Human | Gene symbol | GPR153 | Gene ID | 387509 |
| Gene name | G protein-coupled receptor 153 | |
| Gene Alias | PGR1 | |
| Cytomap | 1p36.31 | |
| Gene Type | protein-coding | GO ID | GO:0007154 | UniProtAcc | A0A0I9QQ03 |
Top |
Malignant transformation analysis |
| Identification of the aberrant gene expression in precancerous and cancerous lesions by comparing the gene expression of stem-like cells in diseased tissues with normal stem cells |
| Entrez ID | Symbol | Replicates | Species | Organ | Tissue | Adj P-value | Log2FC | Malignancy |
| 387509 | GPR153 | HTA11_2487_2000001011 | Human | Colorectum | SER | 7.88e-06 | 4.48e-01 | -0.1808 |
| 387509 | GPR153 | HTA11_411_2000001011 | Human | Colorectum | SER | 1.49e-07 | 1.19e+00 | -0.2602 |
| 387509 | GPR153 | HTA11_2112_2000001011 | Human | Colorectum | SER | 2.49e-03 | 9.97e-01 | -0.2196 |
| 387509 | GPR153 | HTA11_3361_2000001011 | Human | Colorectum | AD | 2.09e-03 | 3.18e-01 | -0.1207 |
| 387509 | GPR153 | HTA11_696_2000001011 | Human | Colorectum | AD | 5.86e-03 | 2.29e-01 | -0.1464 |
| 387509 | GPR153 | HTA11_99999970781_79442 | Human | Colorectum | MSS | 7.85e-03 | 1.31e-01 | 0.294 |
| 387509 | GPR153 | HTA11_99999971662_82457 | Human | Colorectum | MSS | 1.86e-14 | 3.92e-01 | 0.3859 |
| 387509 | GPR153 | HTA11_99999973899_84307 | Human | Colorectum | MSS | 4.60e-11 | 5.96e-01 | 0.2585 |
| 387509 | GPR153 | HTA11_99999974143_84620 | Human | Colorectum | MSS | 6.14e-04 | 1.76e-01 | 0.3005 |
| 387509 | GPR153 | C04 | Human | Oral cavity | OSCC | 4.95e-17 | 5.99e-01 | 0.2633 |
| 387509 | GPR153 | C21 | Human | Oral cavity | OSCC | 1.02e-07 | 2.48e-01 | 0.2678 |
| 387509 | GPR153 | C30 | Human | Oral cavity | OSCC | 1.81e-47 | 1.60e+00 | 0.3055 |
| 387509 | GPR153 | C51 | Human | Oral cavity | OSCC | 5.97e-20 | 6.08e-01 | 0.2674 |
| 387509 | GPR153 | C06 | Human | Oral cavity | OSCC | 2.90e-05 | 5.24e-01 | 0.2699 |
| 387509 | GPR153 | LP15 | Human | Oral cavity | LP | 9.93e-03 | 3.98e-01 | 0.2174 |
| 387509 | GPR153 | EOLP-1 | Human | Oral cavity | EOLP | 7.87e-03 | 9.53e-02 | -0.0202 |
| 387509 | GPR153 | SYSMH1 | Human | Oral cavity | OSCC | 3.89e-18 | 2.72e-01 | 0.1127 |
| 387509 | GPR153 | SYSMH2 | Human | Oral cavity | OSCC | 9.33e-08 | 1.59e-01 | 0.2326 |
| 387509 | GPR153 | SYSMH3 | Human | Oral cavity | OSCC | 5.07e-29 | 5.58e-01 | 0.2442 |
| 387509 | GPR153 | SYSMH5 | Human | Oral cavity | OSCC | 1.54e-13 | 2.46e-01 | 0.0647 |
| Page: 1 |
| Tissue | Expression Dynamics | Abbreviation |
| Colorectum (GSE201348) |  | FAP: Familial adenomatous polyposis |
| CRC: Colorectal cancer | ||
| Colorectum (HTA11) | 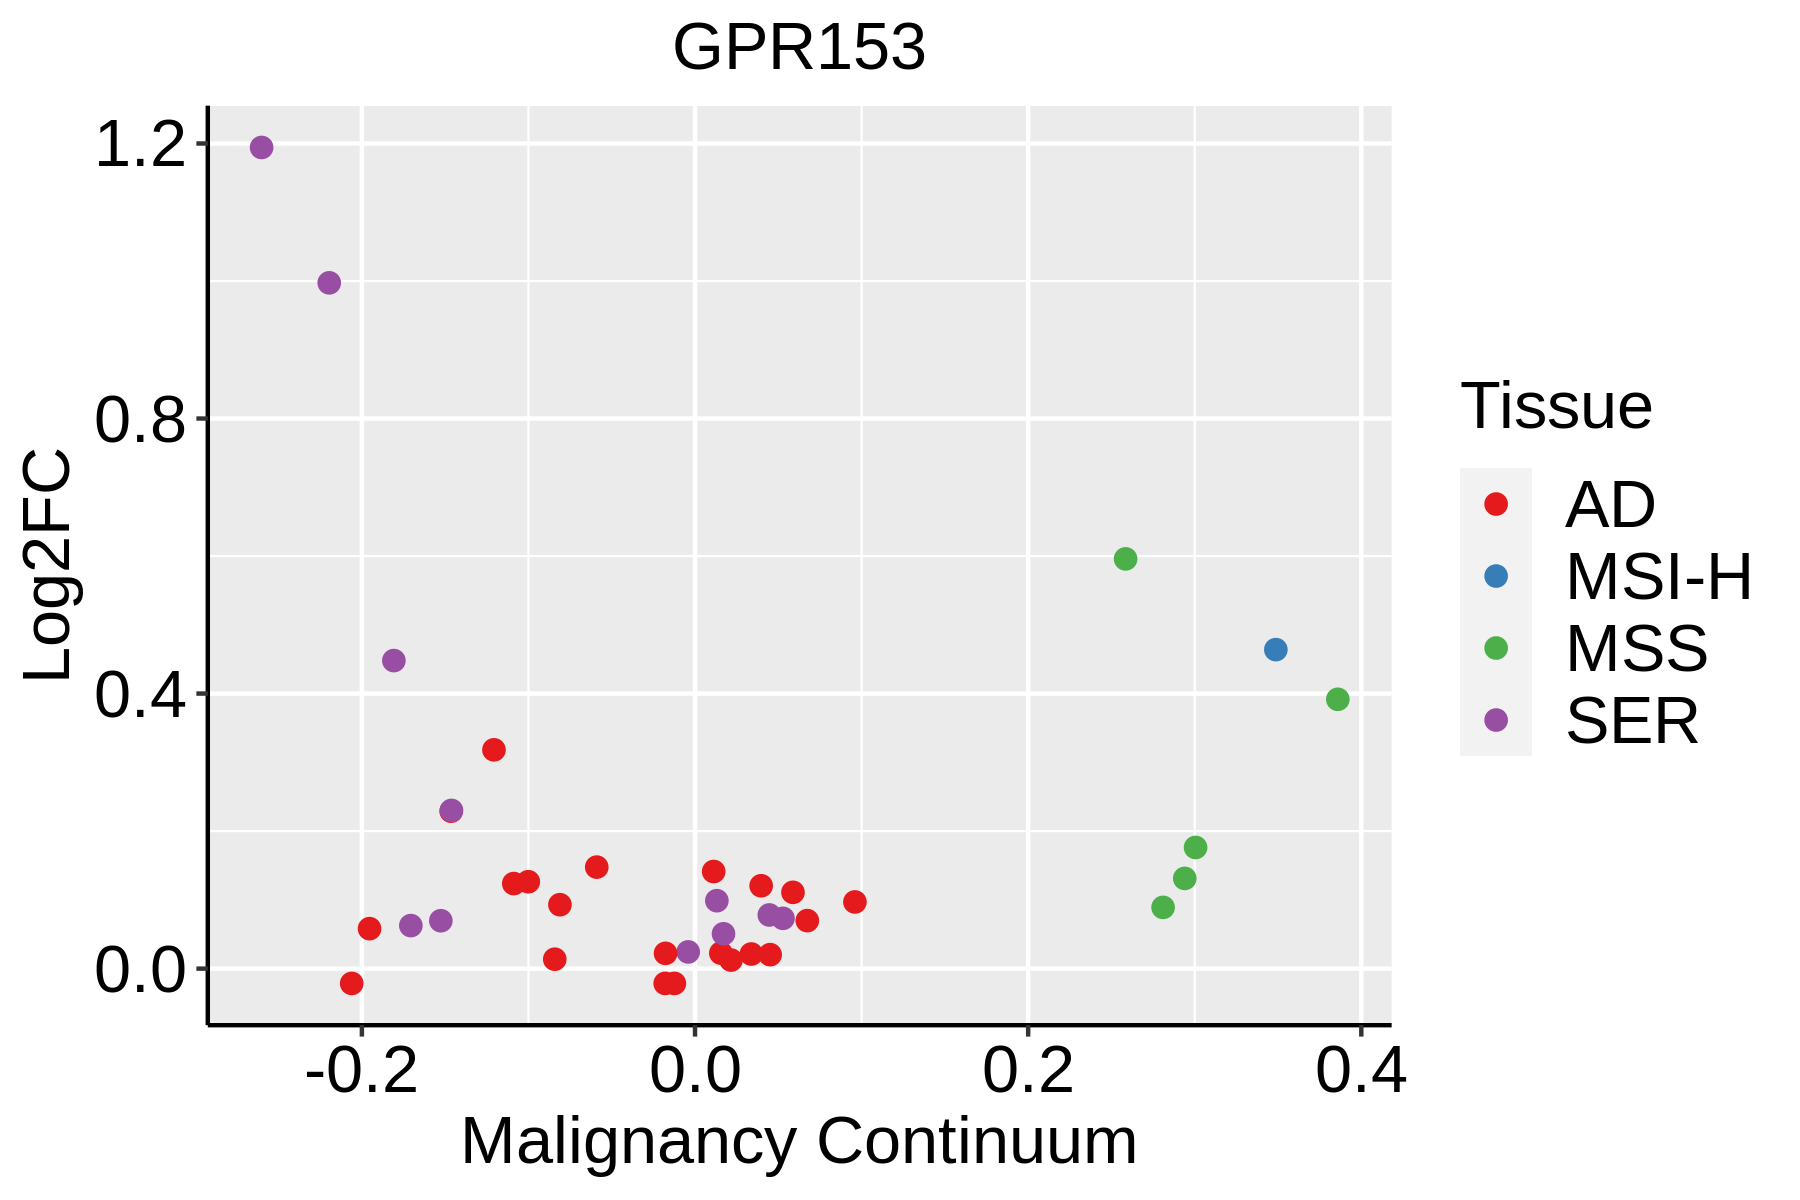 | AD: Adenomas |
| SER: Sessile serrated lesions | ||
| MSI-H: Microsatellite-high colorectal cancer | ||
| MSS: Microsatellite stable colorectal cancer | ||
| Oral Cavity |  | EOLP: Erosive Oral lichen planus |
| LP: leukoplakia | ||
| NEOLP: Non-erosive oral lichen planus | ||
| OSCC: Oral squamous cell carcinoma |
| ∗log2FC in expression of this searched gene in stem-like cells from each diseased tissue sample relative to stem-like cells in normal samples in each tissue plotted against the malignancy continuum. Samples are colored based on if they are from different disease stage. |
Top |
Malignant transformation related pathway analysis |
| Find out the enriched GO biological processes and KEGG pathways involved in transition from healthy to precancer to cancer |
| Tissue | Disease Stage | Enriched GO biological Processes |
| Colorectum | AD |  |
| Colorectum | SER |  |
| Colorectum | MSS |  |
| Colorectum | MSI-H |  |
| Colorectum | FAP |  |
| ∗Top 15 enriched GO BP terms are showed in the bar plot of each disease state in each tissue. Each row represents a significant GO biological process which is colored according to the -log10(p.adjust). |
| Page: 1 2 3 4 5 6 7 8 9 |
| GO ID | Tissue | Disease Stage | Description | Gene Ratio | Bg Ratio | pvalue | p.adjust | Count |
| Page: 1 |
| Pathway ID | Tissue | Disease Stage | Description | Gene Ratio | Bg Ratio | pvalue | p.adjust | qvalue | Count |
| Page: 1 |
Top |
Cell-cell communication analysis |
| Identification of potential cell-cell interactions between two cell types and their ligand-receptor pairs for different disease states |
| Ligand | Receptor | LRpair | Pathway | Tissue | Disease Stage |
| Page: 1 |
Top |
Single-cell gene regulatory network inference analysis |
| Find out the significant the regulons (TFs) and the target genes of each regulon across cell types for different disease states |
| TF | Cell Type | Tissue | Disease Stage | Target Gene | RSS | Regulon Activity |
| ∗The dot plots of a searched regulon are shown for all cell subpopulations in each disease state of each tissue based on the regulon specific score inferred using pySCENIC and by calculating the average expression. |
| Page: 1 |
Top |
Somatic mutation of malignant transformation related genes |
| Annotation of somatic variants for genes involved in malignant transformation |
| Hugo Symbol | Variant Class | Variant Classification | dbSNP RS | HGVSc | HGVSp | HGVSp Short | SWISSPROT | BIOTYPE | SIFT | PolyPhen | Tumor Sample Barcode | Tissue | Histology | Sex | Age | Stage | Therapy Types | Drugs | Outcome |
| GPR153 | SNV | Missense_Mutation | c.640N>A | p.Val214Met | p.V214M | Q6NV75 | protein_coding | deleterious(0) | probably_damaging(0.999) | TCGA-A2-A0ST-01 | Breast | breast invasive carcinoma | Female | <65 | I/II | Chemotherapy | adriamycin | SD | |
| GPR153 | SNV | Missense_Mutation | c.1101G>T | p.Glu367Asp | p.E367D | Q6NV75 | protein_coding | deleterious(0.04) | benign(0.373) | TCGA-BH-A18G-01 | Breast | breast invasive carcinoma | Female | >=65 | I/II | Unknown | Unknown | SD | |
| GPR153 | SNV | Missense_Mutation | c.869C>G | p.Ala290Gly | p.A290G | Q6NV75 | protein_coding | tolerated(0.09) | possibly_damaging(0.55) | TCGA-BH-A18V-01 | Breast | breast invasive carcinoma | Female | <65 | I/II | Unknown | Unknown | SD | |
| GPR153 | SNV | Missense_Mutation | rs774162111 | c.809G>A | p.Arg270Gln | p.R270Q | Q6NV75 | protein_coding | deleterious(0.04) | possibly_damaging(0.571) | TCGA-D8-A1JN-01 | Breast | breast invasive carcinoma | Female | >=65 | III/IV | Hormone Therapy | anastrozolum | SD |
| GPR153 | SNV | Missense_Mutation | novel | c.574G>A | p.Ala192Thr | p.A192T | Q6NV75 | protein_coding | deleterious(0.04) | possibly_damaging(0.897) | TCGA-2W-A8YY-01 | Cervix | cervical & endocervical cancer | Female | <65 | I/II | Chemotherapy | cisplatin | CR |
| GPR153 | SNV | Missense_Mutation | novel | c.133C>A | p.Leu45Met | p.L45M | Q6NV75 | protein_coding | deleterious(0) | probably_damaging(1) | TCGA-2W-A8YY-01 | Cervix | cervical & endocervical cancer | Female | <65 | I/II | Chemotherapy | cisplatin | CR |
| GPR153 | SNV | Missense_Mutation | novel | c.440N>C | p.Val147Ala | p.V147A | Q6NV75 | protein_coding | deleterious(0) | probably_damaging(0.998) | TCGA-C5-A1ME-01 | Cervix | cervical & endocervical cancer | Female | <65 | I/II | Unknown | Unknown | SD |
| GPR153 | SNV | Missense_Mutation | rs147474319 | c.322N>T | p.Arg108Cys | p.R108C | Q6NV75 | protein_coding | deleterious(0) | probably_damaging(0.999) | TCGA-C5-A1MP-01 | Cervix | cervical & endocervical cancer | Female | <65 | I/II | Unknown | Unknown | SD |
| GPR153 | SNV | Missense_Mutation | rs768218848 | c.62N>T | p.Ser21Phe | p.S21F | Q6NV75 | protein_coding | deleterious(0.02) | benign(0.017) | TCGA-EK-A3GM-01 | Cervix | cervical & endocervical cancer | Female | >=65 | I/II | Unknown | Unknown | SD |
| GPR153 | SNV | Missense_Mutation | c.991G>A | p.Glu331Lys | p.E331K | Q6NV75 | protein_coding | tolerated(0.06) | benign(0.171) | TCGA-IR-A3LK-01 | Cervix | cervical & endocervical cancer | Female | >=65 | I/II | Chemotherapy | cisplatin | PD |
| Page: 1 2 3 4 5 |
Top |
Related drugs of malignant transformation related genes |
| Identification of chemicals and drugs interact with genes involved in malignant transfromation |
| (DGIdb 4.0) |
| Entrez ID | Symbol | Category | Interaction Types | Drug Claim Name | Drug Name | PMIDs |
| Page: 1 |

Copyright 2023-Present -The University of Texas Health Science Center at Houston |