
|
|||||
|
 | |
| |
| |
| |
| |
| |
|
Gene: GPR146 |
Gene summary for GPR146 |
| Gene information | Species | Human | Gene symbol | GPR146 | Gene ID | 115330 |
| Gene name | G protein-coupled receptor 146 | |
| Gene Alias | PGR8 | |
| Cytomap | 7p22.3 | |
| Gene Type | protein-coding | GO ID | GO:0007154 | UniProtAcc | A4D2Q3 |
Top |
Malignant transformation analysis |
| Identification of the aberrant gene expression in precancerous and cancerous lesions by comparing the gene expression of stem-like cells in diseased tissues with normal stem cells |
| Entrez ID | Symbol | Replicates | Species | Organ | Tissue | Adj P-value | Log2FC | Malignancy |
| 115330 | GPR146 | S014 | Human | Liver | HCC | 1.49e-13 | 5.36e-01 | 0.2254 |
| 115330 | GPR146 | S015 | Human | Liver | HCC | 4.31e-17 | 6.75e-01 | 0.2375 |
| 115330 | GPR146 | S016 | Human | Liver | HCC | 5.90e-17 | 5.31e-01 | 0.2243 |
| 115330 | GPR146 | S029 | Human | Liver | HCC | 3.71e-03 | 2.17e-01 | 0.2581 |
| Page: 1 |
| Tissue | Expression Dynamics | Abbreviation |
| Liver | 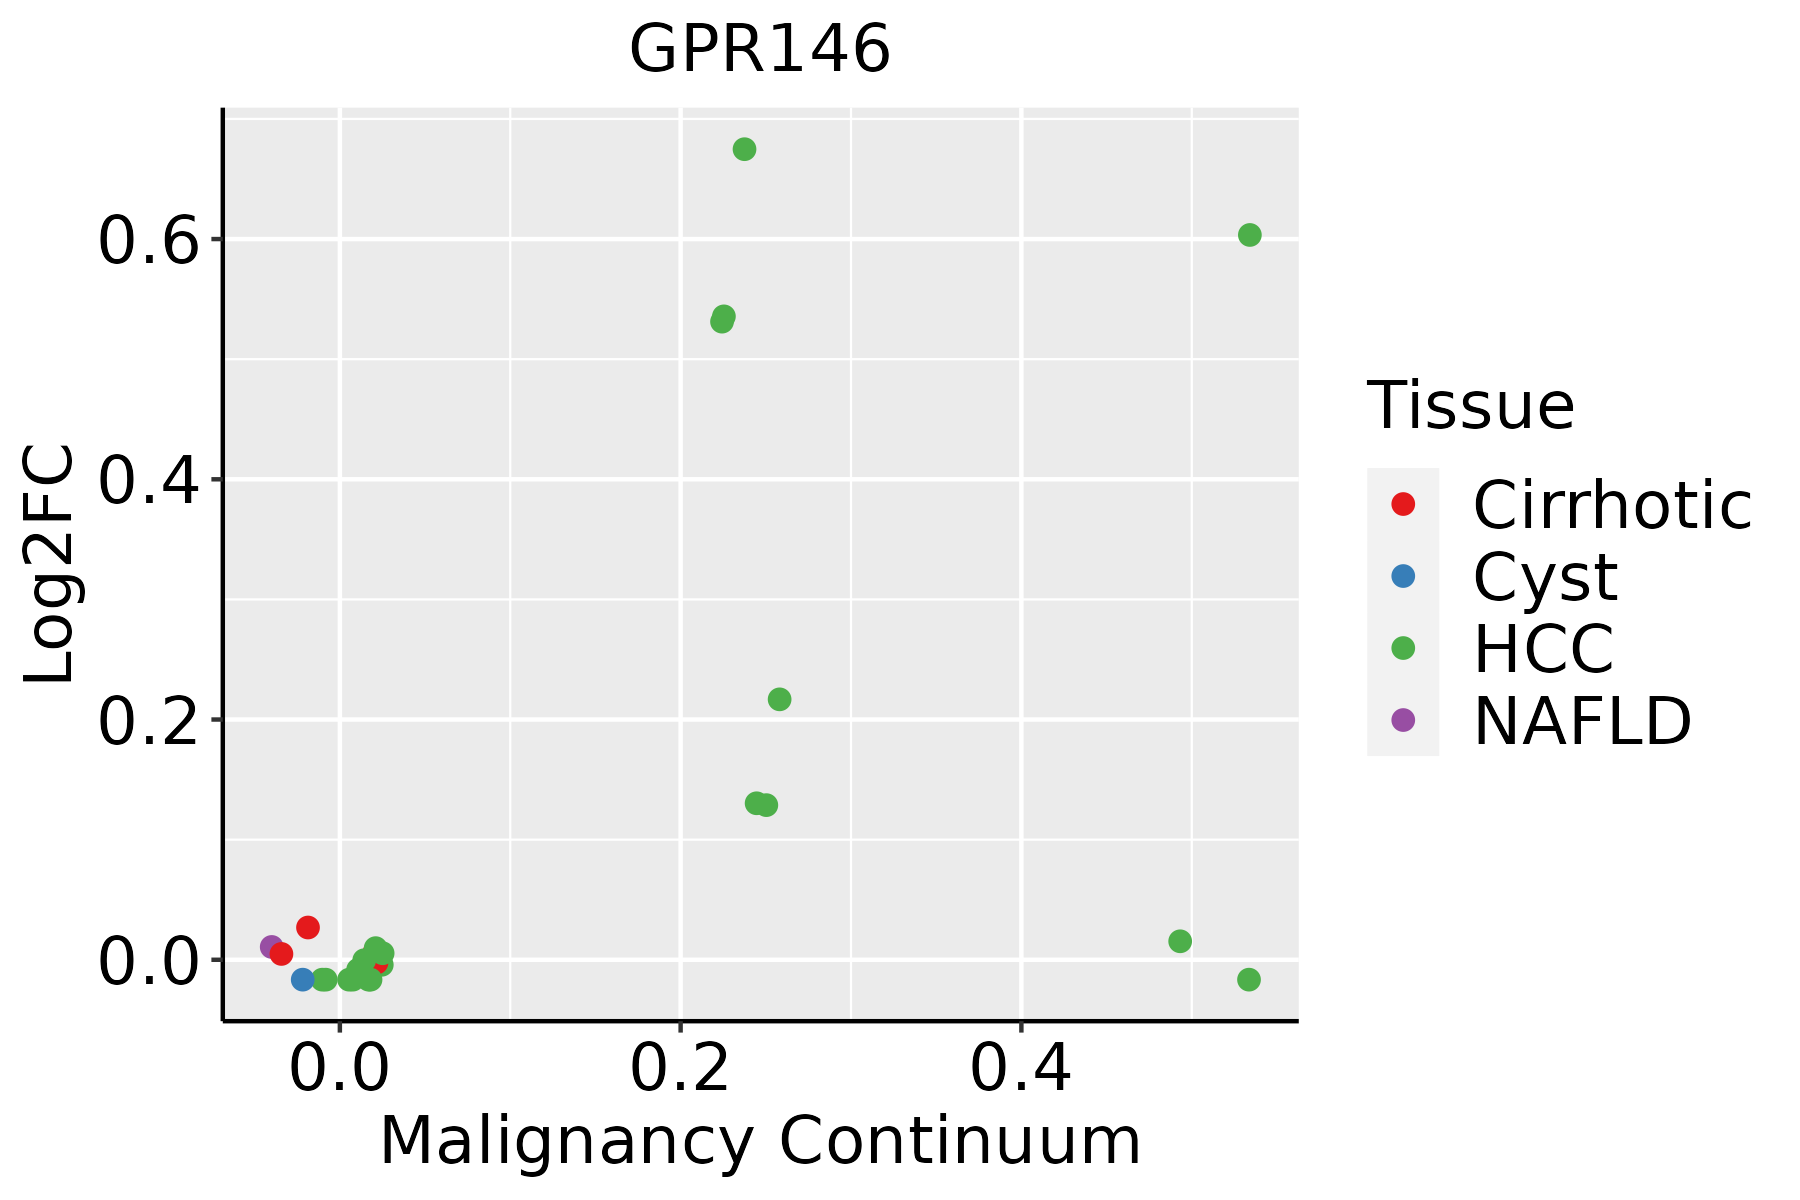 | HCC: Hepatocellular carcinoma |
| NAFLD: Non-alcoholic fatty liver disease |
| ∗log2FC in expression of this searched gene in stem-like cells from each diseased tissue sample relative to stem-like cells in normal samples in each tissue plotted against the malignancy continuum. Samples are colored based on if they are from different disease stage. |
Top |
Malignant transformation related pathway analysis |
| Find out the enriched GO biological processes and KEGG pathways involved in transition from healthy to precancer to cancer |
| Tissue | Disease Stage | Enriched GO biological Processes |
| Colorectum | AD |  |
| Colorectum | SER |  |
| Colorectum | MSS |  |
| Colorectum | MSI-H |  |
| Colorectum | FAP |  |
| ∗Top 15 enriched GO BP terms are showed in the bar plot of each disease state in each tissue. Each row represents a significant GO biological process which is colored according to the -log10(p.adjust). |
| Page: 1 2 3 4 5 6 7 8 9 |
| GO ID | Tissue | Disease Stage | Description | Gene Ratio | Bg Ratio | pvalue | p.adjust | Count |
| Page: 1 |
| Pathway ID | Tissue | Disease Stage | Description | Gene Ratio | Bg Ratio | pvalue | p.adjust | qvalue | Count |
| Page: 1 |
Top |
Cell-cell communication analysis |
| Identification of potential cell-cell interactions between two cell types and their ligand-receptor pairs for different disease states |
| Ligand | Receptor | LRpair | Pathway | Tissue | Disease Stage |
| Page: 1 |
Top |
Single-cell gene regulatory network inference analysis |
| Find out the significant the regulons (TFs) and the target genes of each regulon across cell types for different disease states |
| TF | Cell Type | Tissue | Disease Stage | Target Gene | RSS | Regulon Activity |
| ∗The dot plots of a searched regulon are shown for all cell subpopulations in each disease state of each tissue based on the regulon specific score inferred using pySCENIC and by calculating the average expression. |
| Page: 1 |
Top |
Somatic mutation of malignant transformation related genes |
| Annotation of somatic variants for genes involved in malignant transformation |
| Hugo Symbol | Variant Class | Variant Classification | dbSNP RS | HGVSc | HGVSp | HGVSp Short | SWISSPROT | BIOTYPE | SIFT | PolyPhen | Tumor Sample Barcode | Tissue | Histology | Sex | Age | Stage | Therapy Types | Drugs | Outcome |
| GPR146 | deletion | Frame_Shift_Del | novel | c.532delN | p.Cys178AlafsTer74 | p.C178Afs*74 | Q96CH1 | protein_coding | TCGA-D8-A27V-01 | Breast | breast invasive carcinoma | Female | <65 | I/II | Hormone Therapy | tamoxiphen | SD | ||
| GPR146 | SNV | Missense_Mutation | c.632N>T | p.Ser211Phe | p.S211F | Q96CH1 | protein_coding | tolerated(0.14) | benign(0.311) | TCGA-EK-A2PM-01 | Cervix | cervical & endocervical cancer | Female | >=65 | I/II | Unknown | Unknown | SD | |
| GPR146 | SNV | Missense_Mutation | c.346G>A | p.Ala116Thr | p.A116T | Q96CH1 | protein_coding | tolerated(1) | benign(0.005) | TCGA-AA-3492-01 | Colorectum | colon adenocarcinoma | Female | >=65 | I/II | Unknown | Unknown | SD | |
| GPR146 | SNV | Missense_Mutation | rs761700064 | c.653N>T | p.Thr218Met | p.T218M | Q96CH1 | protein_coding | deleterious(0.01) | benign(0.224) | TCGA-CK-4951-01 | Colorectum | colon adenocarcinoma | Female | >=65 | I/II | Unknown | Unknown | PD |
| GPR146 | SNV | Missense_Mutation | rs754291447 | c.361N>A | p.Ala121Thr | p.A121T | Q96CH1 | protein_coding | tolerated(0.66) | benign(0.012) | TCGA-CK-5916-01 | Colorectum | colon adenocarcinoma | Female | >=65 | I/II | Unknown | Unknown | PD |
| GPR146 | SNV | Missense_Mutation | rs145638311 | c.401N>T | p.Pro134Leu | p.P134L | Q96CH1 | protein_coding | deleterious(0) | probably_damaging(1) | TCGA-D5-6929-01 | Colorectum | colon adenocarcinoma | Female | <65 | III/IV | Chemotherapy | oxaliplatinum+ | SD |
| GPR146 | SNV | Missense_Mutation | rs750356197 | c.25N>A | p.Gly9Ser | p.G9S | Q96CH1 | protein_coding | tolerated(0.2) | benign(0.005) | TCGA-A5-A0VP-01 | Endometrium | uterine corpus endometrioid carcinoma | Female | >=65 | I/II | Unknown | Unknown | SD |
| GPR146 | SNV | Missense_Mutation | c.521G>C | p.Arg174Pro | p.R174P | Q96CH1 | protein_coding | deleterious(0.01) | possibly_damaging(0.613) | TCGA-AJ-A23O-01 | Endometrium | uterine corpus endometrioid carcinoma | Female | >=65 | I/II | Unknown | Unknown | SD | |
| GPR146 | SNV | Missense_Mutation | novel | c.55N>C | p.Cys19Arg | p.C19R | Q96CH1 | protein_coding | deleterious(0.03) | probably_damaging(0.996) | TCGA-AJ-A3BG-01 | Endometrium | uterine corpus endometrioid carcinoma | Female | >=65 | I/II | Chemotherapy | carboplatin | PD |
| GPR146 | SNV | Missense_Mutation | c.994C>A | p.Leu332Met | p.L332M | Q96CH1 | protein_coding | tolerated_low_confidence(0.74) | benign(0.003) | TCGA-AP-A051-01 | Endometrium | uterine corpus endometrioid carcinoma | Female | >=65 | I/II | Unknown | Unknown | SD |
| Page: 1 2 3 |
Top |
Related drugs of malignant transformation related genes |
| Identification of chemicals and drugs interact with genes involved in malignant transfromation |
| (DGIdb 4.0) |
| Entrez ID | Symbol | Category | Interaction Types | Drug Claim Name | Drug Name | PMIDs |
| Page: 1 |

Copyright 2023-Present -The University of Texas Health Science Center at Houston |