
|
|||||
|
 | |
| |
| |
| |
| |
| |
|
Gene: GPR108 |
Gene summary for GPR108 |
| Gene information | Species | Human | Gene symbol | GPR108 | Gene ID | 56927 |
| Gene name | G protein-coupled receptor 108 | |
| Gene Alias | LUSTR2 | |
| Cytomap | 19p13.3 | |
| Gene Type | protein-coding | GO ID | GO:0002221 | UniProtAcc | Q9NPR9 |
Top |
Malignant transformation analysis |
| Identification of the aberrant gene expression in precancerous and cancerous lesions by comparing the gene expression of stem-like cells in diseased tissues with normal stem cells |
| Entrez ID | Symbol | Replicates | Species | Organ | Tissue | Adj P-value | Log2FC | Malignancy |
| 56927 | GPR108 | HTA11_3410_2000001011 | Human | Colorectum | AD | 4.45e-04 | 1.83e-01 | 0.0155 |
| 56927 | GPR108 | HTA11_2487_2000001011 | Human | Colorectum | SER | 5.00e-21 | 5.65e-01 | -0.1808 |
| 56927 | GPR108 | HTA11_2951_2000001011 | Human | Colorectum | AD | 6.68e-05 | 4.11e-01 | 0.0216 |
| 56927 | GPR108 | HTA11_1938_2000001011 | Human | Colorectum | AD | 1.27e-08 | 3.52e-01 | -0.0811 |
| 56927 | GPR108 | HTA11_78_2000001011 | Human | Colorectum | AD | 1.77e-05 | 2.61e-01 | -0.1088 |
| 56927 | GPR108 | HTA11_347_2000001011 | Human | Colorectum | AD | 1.68e-17 | 4.38e-01 | -0.1954 |
| 56927 | GPR108 | HTA11_411_2000001011 | Human | Colorectum | SER | 2.23e-09 | 8.99e-01 | -0.2602 |
| 56927 | GPR108 | HTA11_3361_2000001011 | Human | Colorectum | AD | 3.41e-10 | 4.36e-01 | -0.1207 |
| 56927 | GPR108 | HTA11_83_2000001011 | Human | Colorectum | SER | 2.64e-03 | 2.67e-01 | -0.1526 |
| 56927 | GPR108 | HTA11_696_2000001011 | Human | Colorectum | AD | 9.22e-25 | 4.28e-01 | -0.1464 |
| 56927 | GPR108 | HTA11_866_2000001011 | Human | Colorectum | AD | 7.47e-09 | 3.01e-01 | -0.1001 |
| 56927 | GPR108 | HTA11_1391_2000001011 | Human | Colorectum | AD | 2.54e-09 | 3.31e-01 | -0.059 |
| 56927 | GPR108 | HTA11_5212_2000001011 | Human | Colorectum | AD | 1.79e-07 | 4.85e-01 | -0.2061 |
| 56927 | GPR108 | HTA11_546_2000001011 | Human | Colorectum | AD | 8.26e-05 | 3.58e-01 | -0.0842 |
| 56927 | GPR108 | HTA11_866_3004761011 | Human | Colorectum | AD | 8.65e-06 | 2.15e-01 | 0.096 |
| 56927 | GPR108 | HTA11_4255_2000001011 | Human | Colorectum | SER | 6.68e-05 | 4.11e-01 | 0.0446 |
| 56927 | GPR108 | HTA11_8622_2000001021 | Human | Colorectum | SER | 1.35e-04 | 3.17e-01 | 0.0528 |
| 56927 | GPR108 | HTA11_7696_3000711011 | Human | Colorectum | AD | 7.59e-09 | 2.89e-01 | 0.0674 |
| 56927 | GPR108 | HTA11_6818_2000001011 | Human | Colorectum | AD | 1.77e-02 | 2.26e-01 | 0.0112 |
| 56927 | GPR108 | HTA11_7469_2000001011 | Human | Colorectum | AD | 3.65e-03 | 5.01e-01 | -0.0124 |
| Page: 1 2 3 4 5 6 7 8 |
| Tissue | Expression Dynamics | Abbreviation |
| Colorectum (GSE201348) | 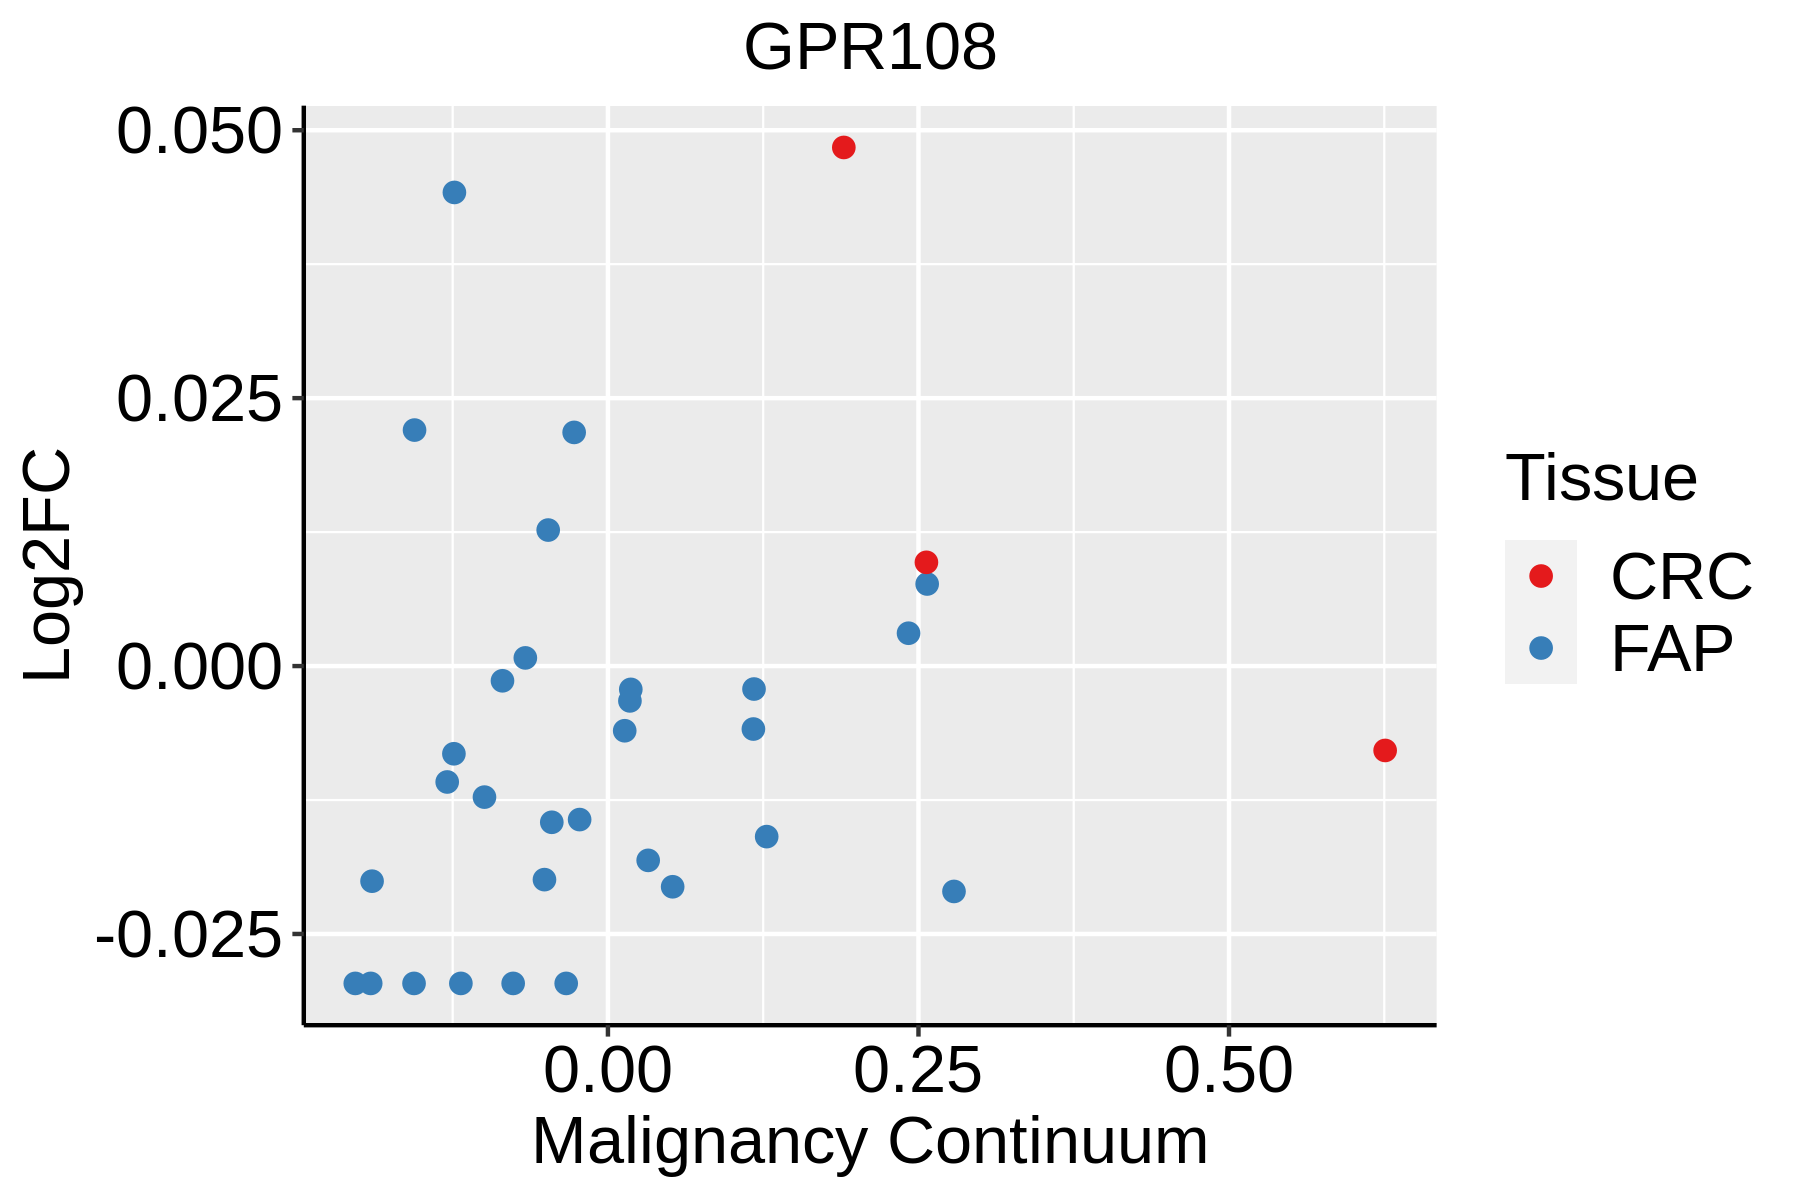 | FAP: Familial adenomatous polyposis |
| CRC: Colorectal cancer | ||
| Colorectum (HTA11) |  | AD: Adenomas |
| SER: Sessile serrated lesions | ||
| MSI-H: Microsatellite-high colorectal cancer | ||
| MSS: Microsatellite stable colorectal cancer | ||
| Esophagus | 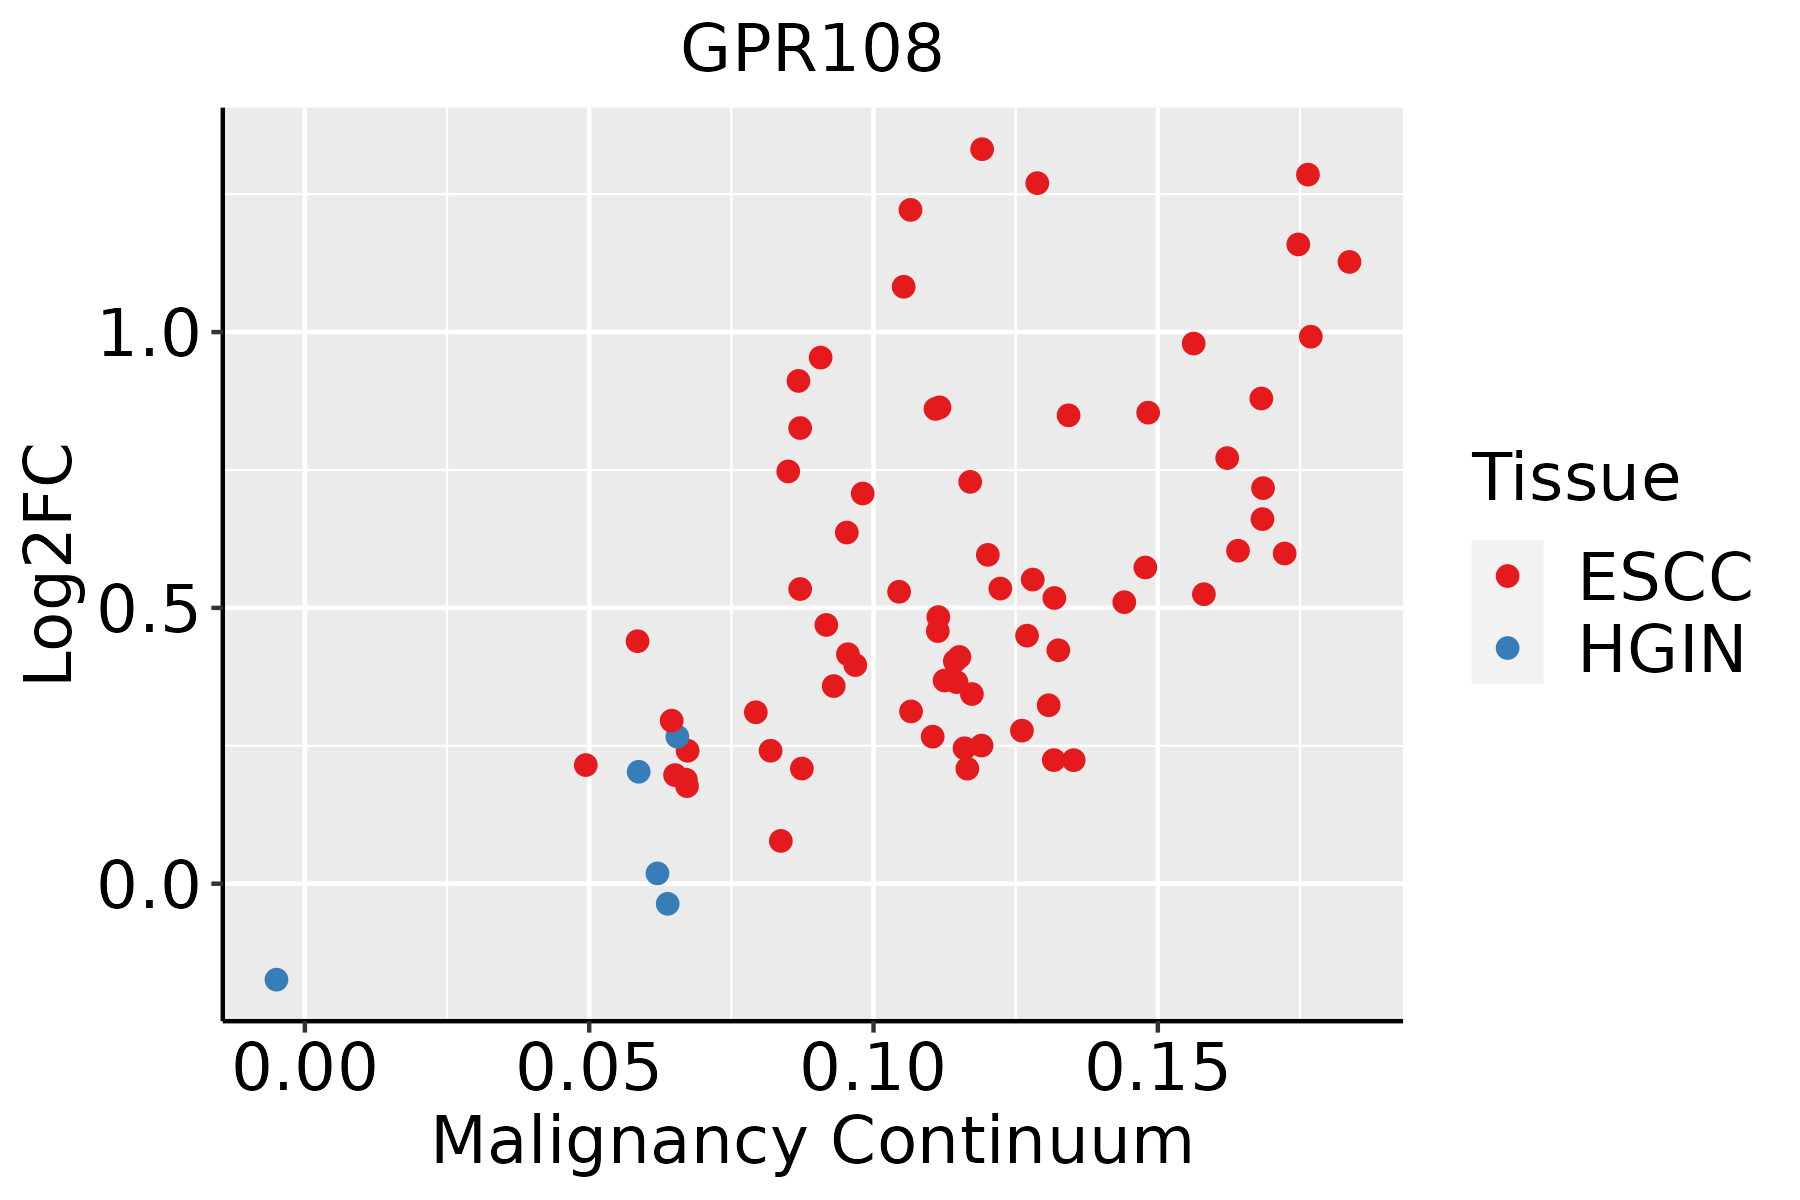 | ESCC: Esophageal squamous cell carcinoma |
| HGIN: High-grade intraepithelial neoplasias | ||
| LGIN: Low-grade intraepithelial neoplasias | ||
| Liver |  | HCC: Hepatocellular carcinoma |
| NAFLD: Non-alcoholic fatty liver disease | ||
| Oral Cavity | 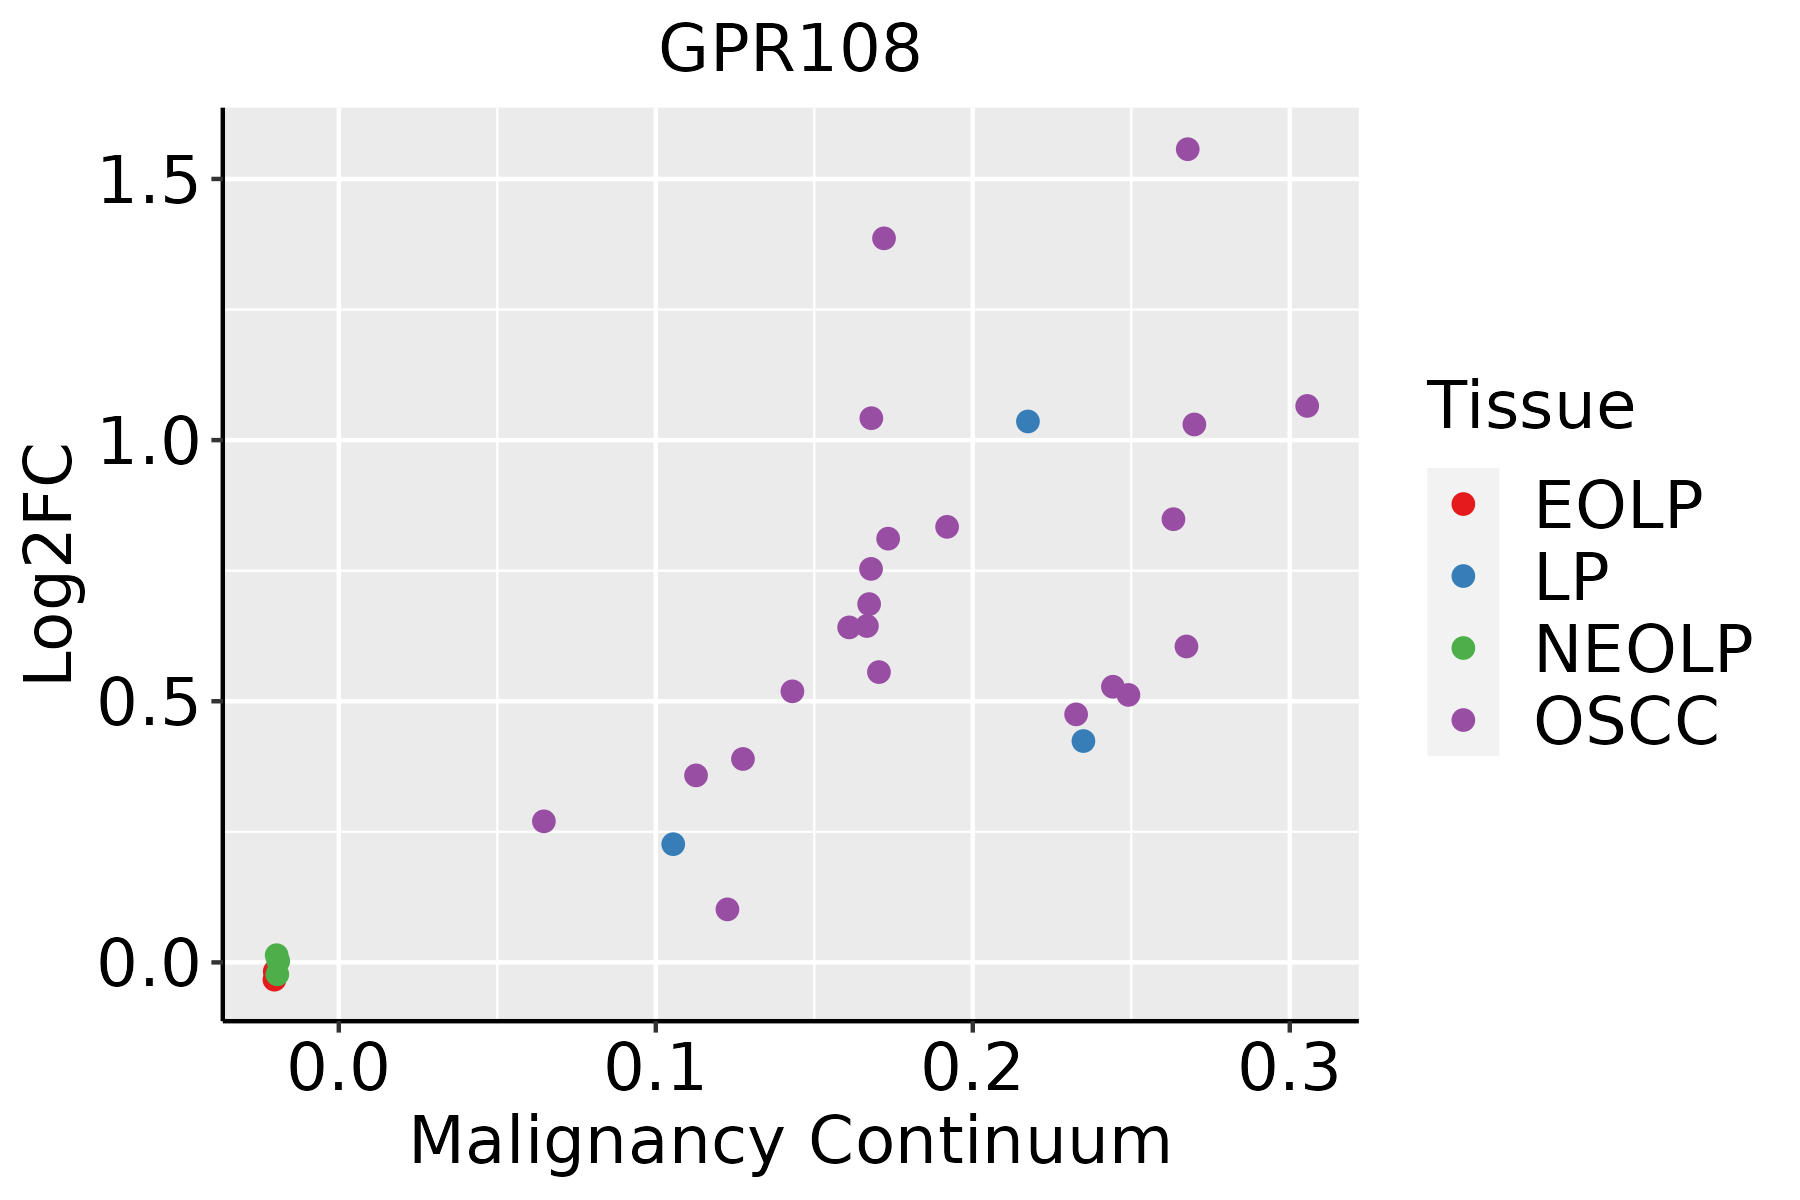 | EOLP: Erosive Oral lichen planus |
| LP: leukoplakia | ||
| NEOLP: Non-erosive oral lichen planus | ||
| OSCC: Oral squamous cell carcinoma | ||
| Skin | 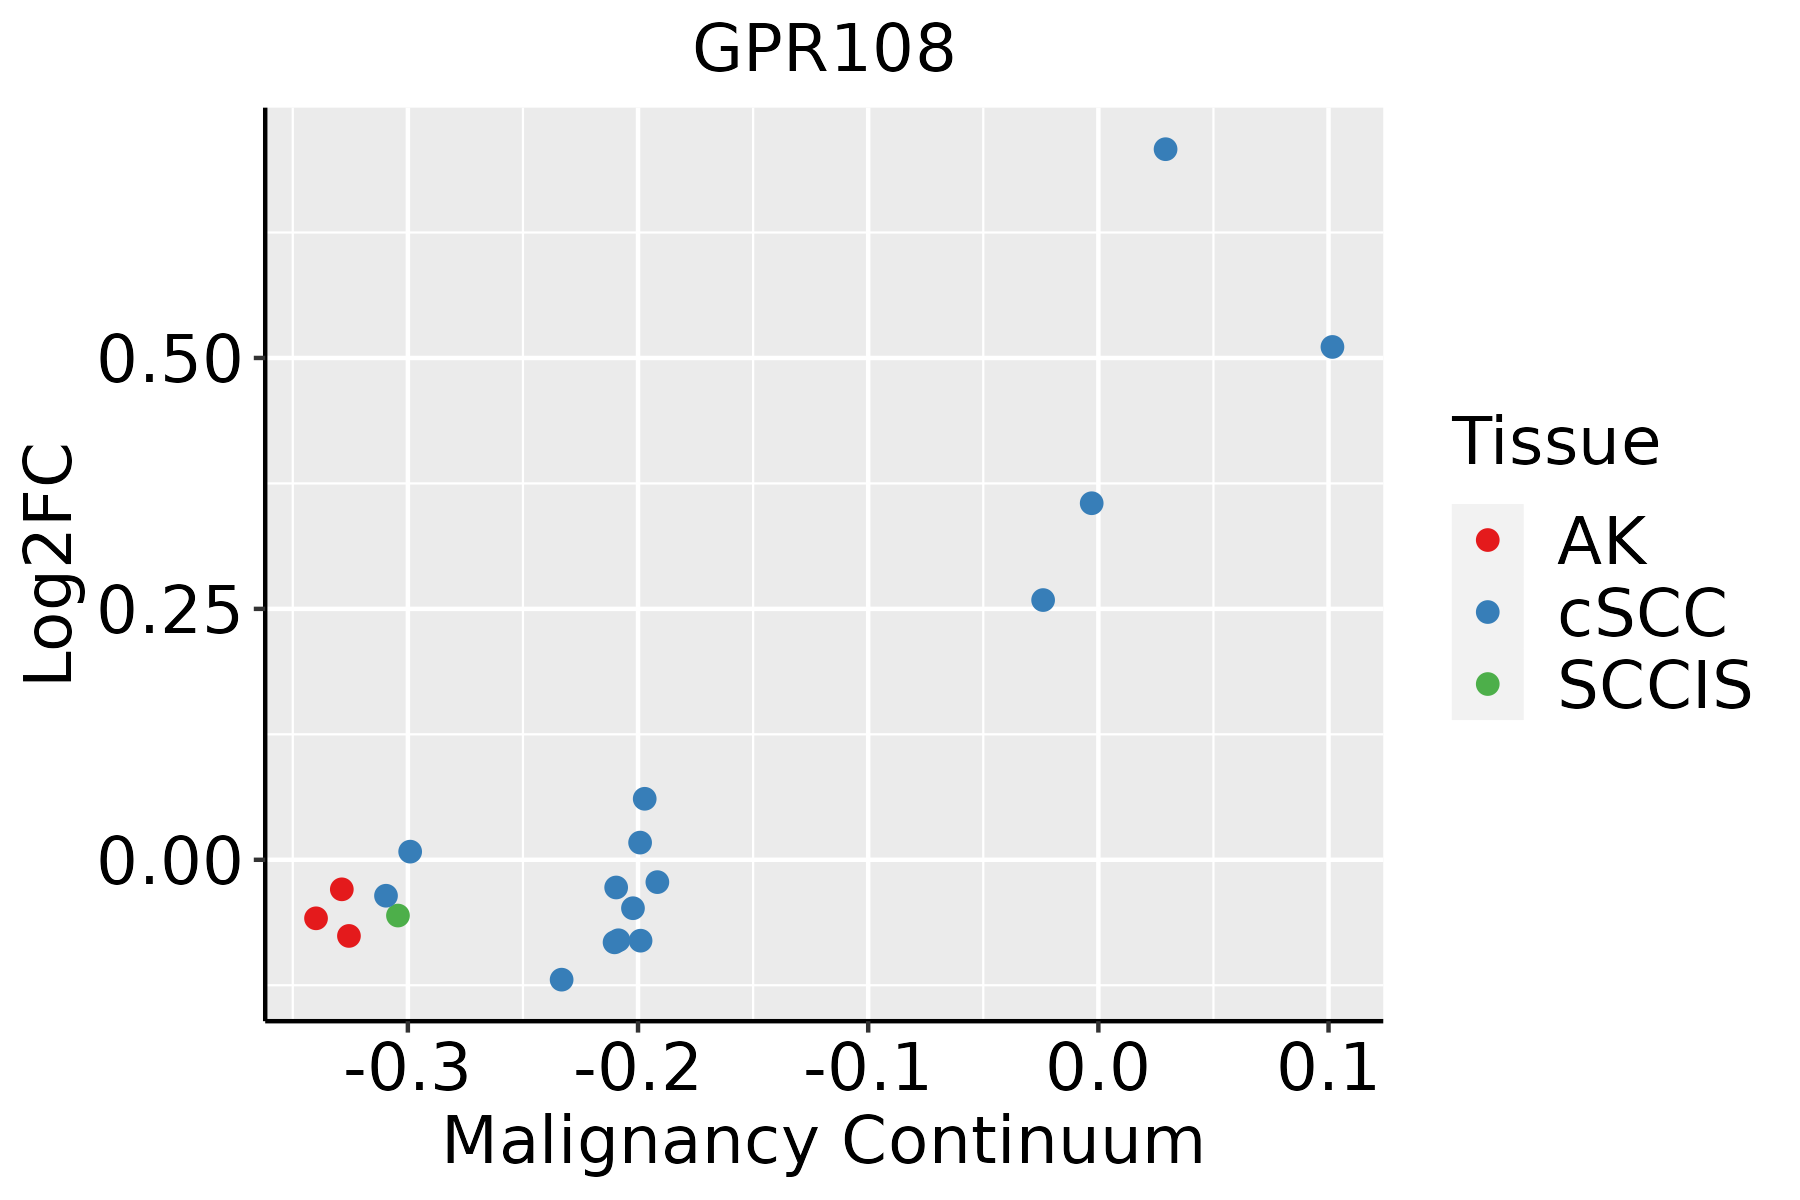 | AK: Actinic keratosis |
| cSCC: Cutaneous squamous cell carcinoma | ||
| SCCIS:squamous cell carcinoma in situ | ||
| Thyroid | 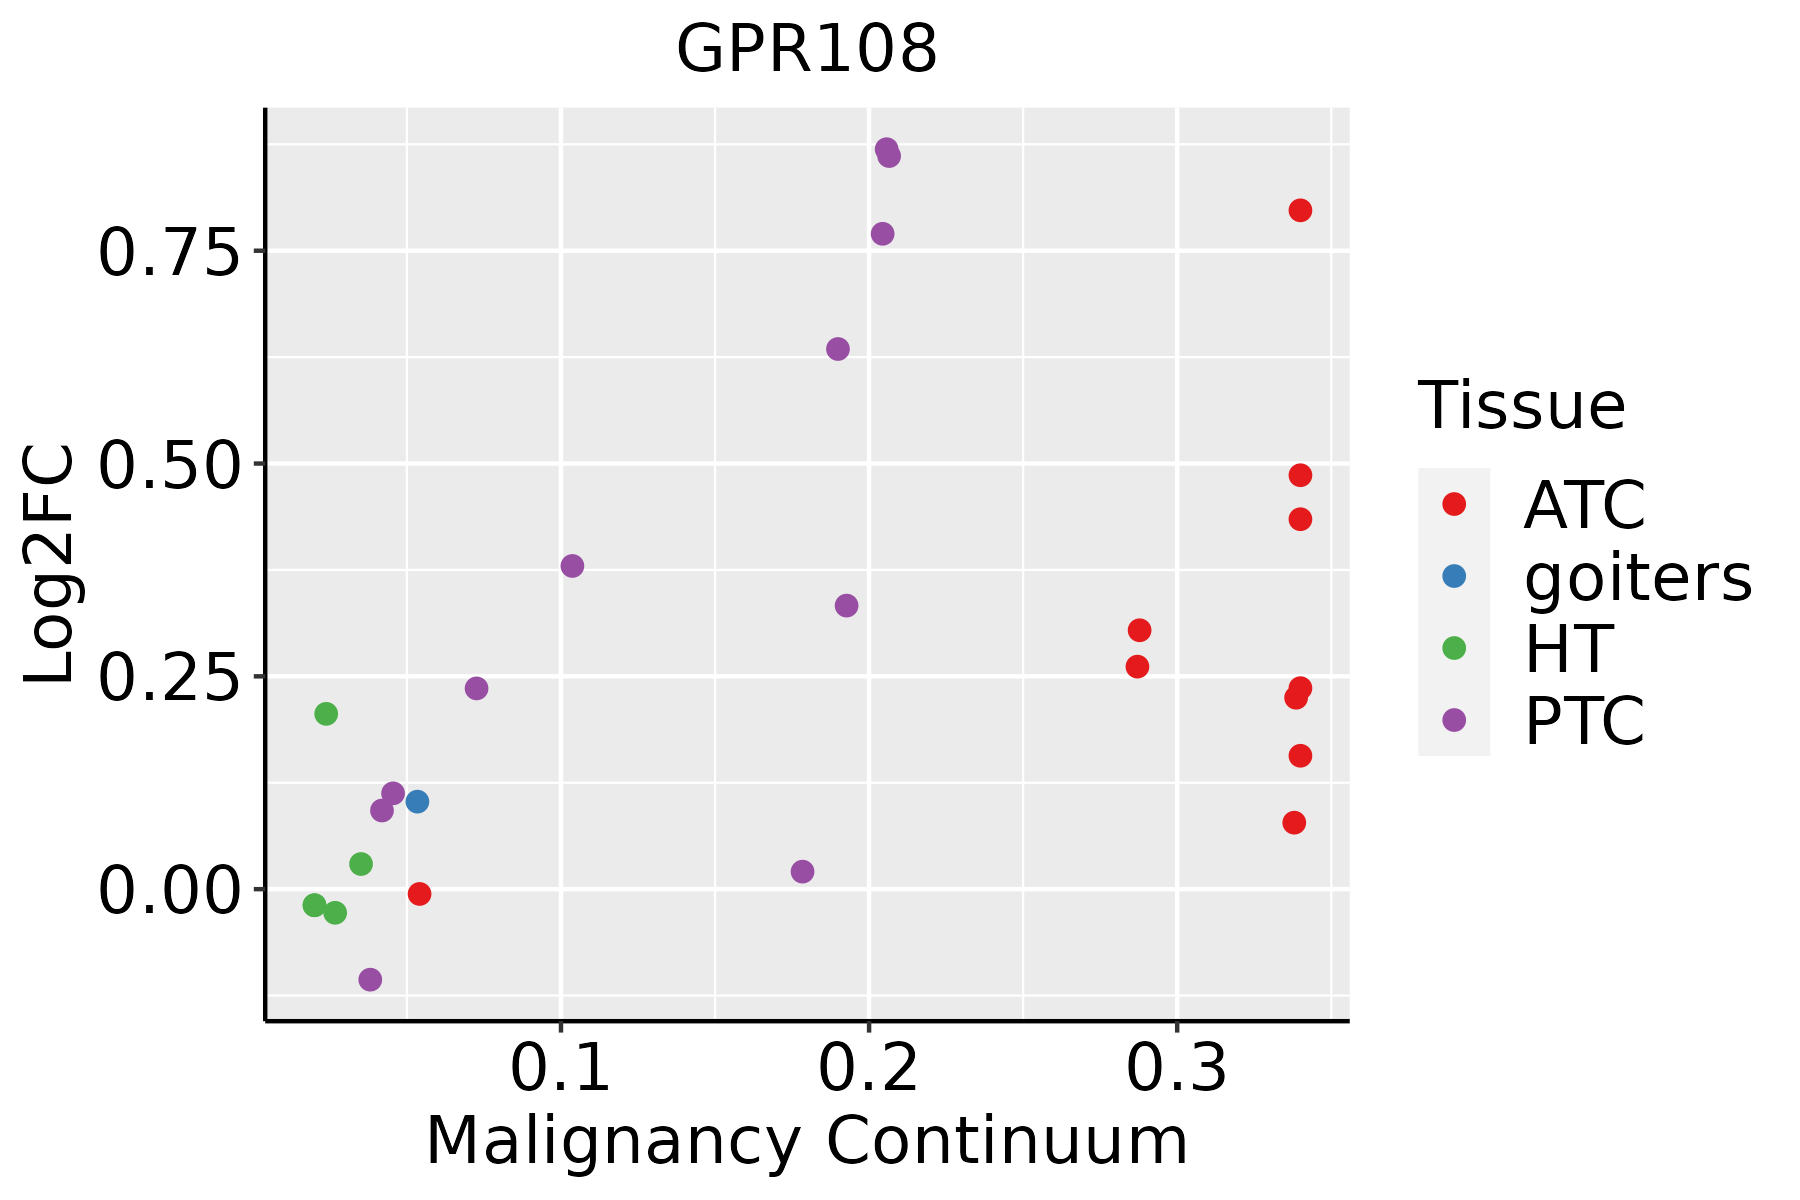 | ATC: Anaplastic thyroid cancer |
| HT: Hashimoto's thyroiditis | ||
| PTC: Papillary thyroid cancer |
| ∗log2FC in expression of this searched gene in stem-like cells from each diseased tissue sample relative to stem-like cells in normal samples in each tissue plotted against the malignancy continuum. Samples are colored based on if they are from different disease stage. |
Top |
Malignant transformation related pathway analysis |
| Find out the enriched GO biological processes and KEGG pathways involved in transition from healthy to precancer to cancer |
| Tissue | Disease Stage | Enriched GO biological Processes |
| Colorectum | AD |  |
| Colorectum | SER |  |
| Colorectum | MSS |  |
| Colorectum | MSI-H |  |
| Colorectum | FAP |  |
| ∗Top 15 enriched GO BP terms are showed in the bar plot of each disease state in each tissue. Each row represents a significant GO biological process which is colored according to the -log10(p.adjust). |
| Page: 1 2 3 4 5 6 7 8 9 |
| GO ID | Tissue | Disease Stage | Description | Gene Ratio | Bg Ratio | pvalue | p.adjust | Count |
| GO:0002221 | Colorectum | MSS | pattern recognition receptor signaling pathway | 45/3467 | 172/18723 | 8.06e-03 | 4.91e-02 | 45 |
| GO:00022211 | Liver | HCC | pattern recognition receptor signaling pathway | 107/7958 | 172/18723 | 1.37e-07 | 2.58e-06 | 107 |
| GO:0002224 | Liver | HCC | toll-like receptor signaling pathway | 67/7958 | 121/18723 | 2.87e-03 | 1.34e-02 | 67 |
| GO:00622072 | Liver | HCC | regulation of pattern recognition receptor signaling pathway | 59/7958 | 105/18723 | 3.18e-03 | 1.47e-02 | 59 |
| GO:00022214 | Oral cavity | OSCC | pattern recognition receptor signaling pathway | 95/7305 | 172/18723 | 1.11e-05 | 1.15e-04 | 95 |
| GO:00622076 | Oral cavity | OSCC | regulation of pattern recognition receptor signaling pathway | 56/7305 | 105/18723 | 1.99e-03 | 9.23e-03 | 56 |
| GO:00022243 | Oral cavity | OSCC | toll-like receptor signaling pathway | 63/7305 | 121/18723 | 2.36e-03 | 1.04e-02 | 63 |
| GO:00027646 | Oral cavity | OSCC | immune response-regulating signaling pathway | 212/7305 | 468/18723 | 2.93e-03 | 1.27e-02 | 212 |
| GO:00022215 | Thyroid | PTC | pattern recognition receptor signaling pathway | 77/5968 | 172/18723 | 2.56e-04 | 1.84e-03 | 77 |
| GO:000222114 | Thyroid | ATC | pattern recognition receptor signaling pathway | 80/6293 | 172/18723 | 2.89e-04 | 1.84e-03 | 80 |
| Page: 1 |
| Pathway ID | Tissue | Disease Stage | Description | Gene Ratio | Bg Ratio | pvalue | p.adjust | qvalue | Count |
| Page: 1 |
Top |
Cell-cell communication analysis |
| Identification of potential cell-cell interactions between two cell types and their ligand-receptor pairs for different disease states |
| Ligand | Receptor | LRpair | Pathway | Tissue | Disease Stage |
| Page: 1 |
Top |
Single-cell gene regulatory network inference analysis |
| Find out the significant the regulons (TFs) and the target genes of each regulon across cell types for different disease states |
| TF | Cell Type | Tissue | Disease Stage | Target Gene | RSS | Regulon Activity |
| ∗The dot plots of a searched regulon are shown for all cell subpopulations in each disease state of each tissue based on the regulon specific score inferred using pySCENIC and by calculating the average expression. |
| Page: 1 |
Top |
Somatic mutation of malignant transformation related genes |
| Annotation of somatic variants for genes involved in malignant transformation |
| Hugo Symbol | Variant Class | Variant Classification | dbSNP RS | HGVSc | HGVSp | HGVSp Short | SWISSPROT | BIOTYPE | SIFT | PolyPhen | Tumor Sample Barcode | Tissue | Histology | Sex | Age | Stage | Therapy Types | Drugs | Outcome |
| GPR108 | SNV | Missense_Mutation | rs757468810 | c.1363N>A | p.Val455Ile | p.V455I | Q9NPR9 | protein_coding | tolerated(1) | benign(0.003) | TCGA-A2-A0T0-01 | Breast | breast invasive carcinoma | Female | <65 | I/II | Chemotherapy | taxotere | SD |
| GPR108 | SNV | Missense_Mutation | rs376404694 | c.625N>A | p.Val209Met | p.V209M | Q9NPR9 | protein_coding | tolerated(0.44) | benign(0.048) | TCGA-BH-A18G-01 | Breast | breast invasive carcinoma | Female | >=65 | I/II | Unknown | Unknown | SD |
| GPR108 | SNV | Missense_Mutation | novel | c.951N>G | p.Ile317Met | p.I317M | Q9NPR9 | protein_coding | deleterious(0) | probably_damaging(0.999) | TCGA-PE-A5DE-01 | Breast | breast invasive carcinoma | Female | <65 | I/II | Chemotherapy | taxotere | CR |
| GPR108 | deletion | Frame_Shift_Del | novel | c.683delN | p.Asn228ThrfsTer15 | p.N228Tfs*15 | Q9NPR9 | protein_coding | TCGA-D8-A27V-01 | Breast | breast invasive carcinoma | Female | <65 | I/II | Hormone Therapy | tamoxiphen | SD | ||
| GPR108 | SNV | Missense_Mutation | novel | c.1095N>C | p.Lys365Asn | p.K365N | Q9NPR9 | protein_coding | deleterious(0) | probably_damaging(0.999) | TCGA-VS-A94Z-01 | Cervix | cervical & endocervical cancer | Female | <65 | I/II | Chemotherapy | cisplatin | CR |
| GPR108 | SNV | Missense_Mutation | novel | c.1264N>T | p.Arg422Trp | p.R422W | Q9NPR9 | protein_coding | deleterious(0) | probably_damaging(1) | TCGA-A6-6781-01 | Colorectum | colon adenocarcinoma | Male | <65 | III/IV | Chemotherapy | oxaliplatin | SD |
| GPR108 | SNV | Missense_Mutation | c.209G>A | p.Gly70Asp | p.G70D | Q9NPR9 | protein_coding | tolerated(0.33) | benign(0.001) | TCGA-AA-A010-01 | Colorectum | colon adenocarcinoma | Female | <65 | I/II | Chemotherapy | folinic | CR | |
| GPR108 | SNV | Missense_Mutation | c.1568A>G | p.Asp523Gly | p.D523G | Q9NPR9 | protein_coding | tolerated(0.36) | benign(0.003) | TCGA-AD-5900-01 | Colorectum | colon adenocarcinoma | Male | >=65 | I/II | Unknown | Unknown | SD | |
| GPR108 | SNV | Missense_Mutation | rs746123266 | c.857N>T | p.Thr286Met | p.T286M | Q9NPR9 | protein_coding | deleterious(0.02) | possibly_damaging(0.806) | TCGA-G4-6628-01 | Colorectum | colon adenocarcinoma | Male | >=65 | I/II | Unknown | Unknown | SD |
| GPR108 | SNV | Missense_Mutation | rs769102342 | c.973N>A | p.Glu325Lys | p.E325K | Q9NPR9 | protein_coding | deleterious(0) | probably_damaging(0.994) | TCGA-AG-A002-01 | Colorectum | rectum adenocarcinoma | Male | <65 | I/II | Unknown | Unknown | SD |
| Page: 1 2 3 4 5 |
Top |
Related drugs of malignant transformation related genes |
| Identification of chemicals and drugs interact with genes involved in malignant transfromation |
| (DGIdb 4.0) |
| Entrez ID | Symbol | Category | Interaction Types | Drug Claim Name | Drug Name | PMIDs |
| Page: 1 |

Copyright 2023-Present -The University of Texas Health Science Center at Houston |