| Tissue | Expression Dynamics | Abbreviation |
| Cervix | 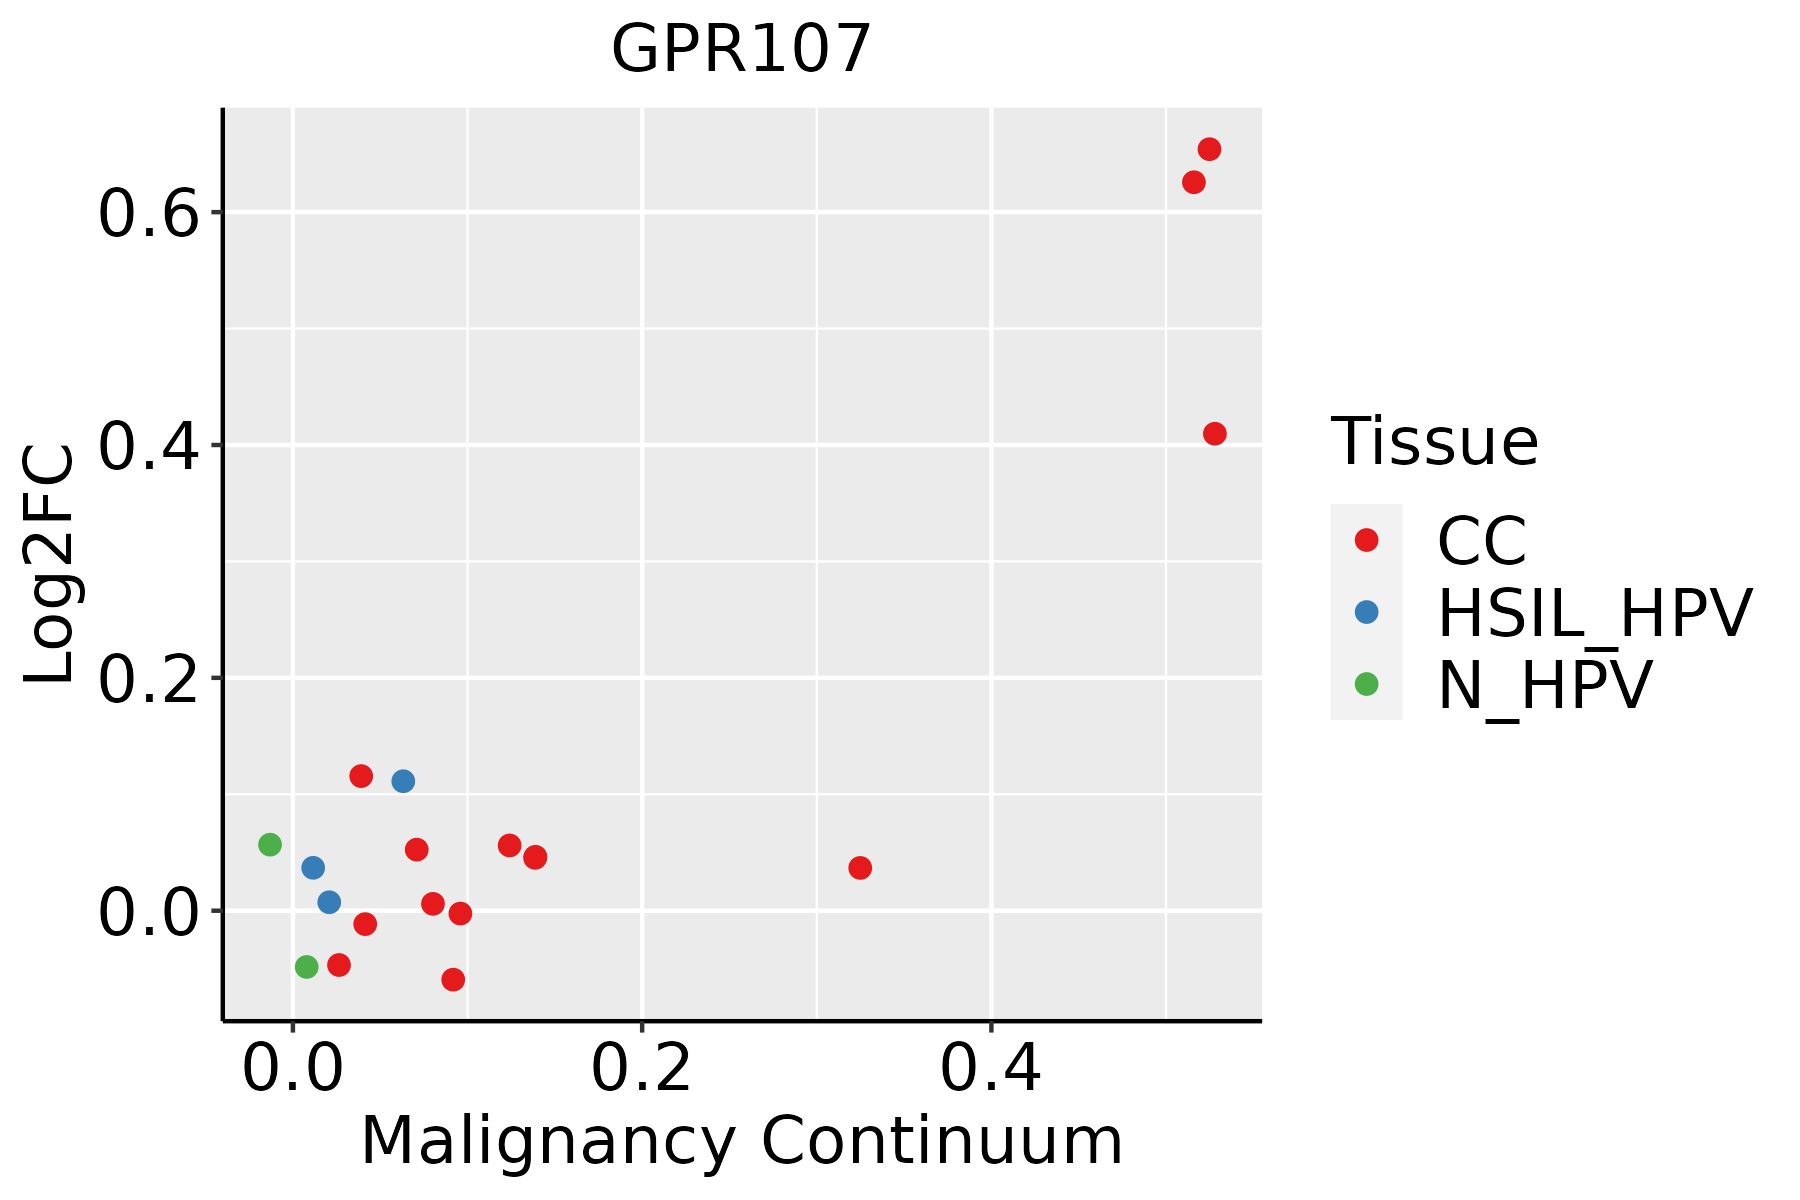 | CC: Cervix cancer |
| HSIL_HPV: HPV-infected high-grade squamous intraepithelial lesions |
| N_HPV: HPV-infected normal cervix |
| Colorectum (GSE201348) |  | FAP: Familial adenomatous polyposis |
| CRC: Colorectal cancer |
| Colorectum (HTA11) |  | AD: Adenomas |
| SER: Sessile serrated lesions |
| MSI-H: Microsatellite-high colorectal cancer |
| MSS: Microsatellite stable colorectal cancer |
| Esophagus |  | ESCC: Esophageal squamous cell carcinoma |
| HGIN: High-grade intraepithelial neoplasias |
| LGIN: Low-grade intraepithelial neoplasias |
| Liver | 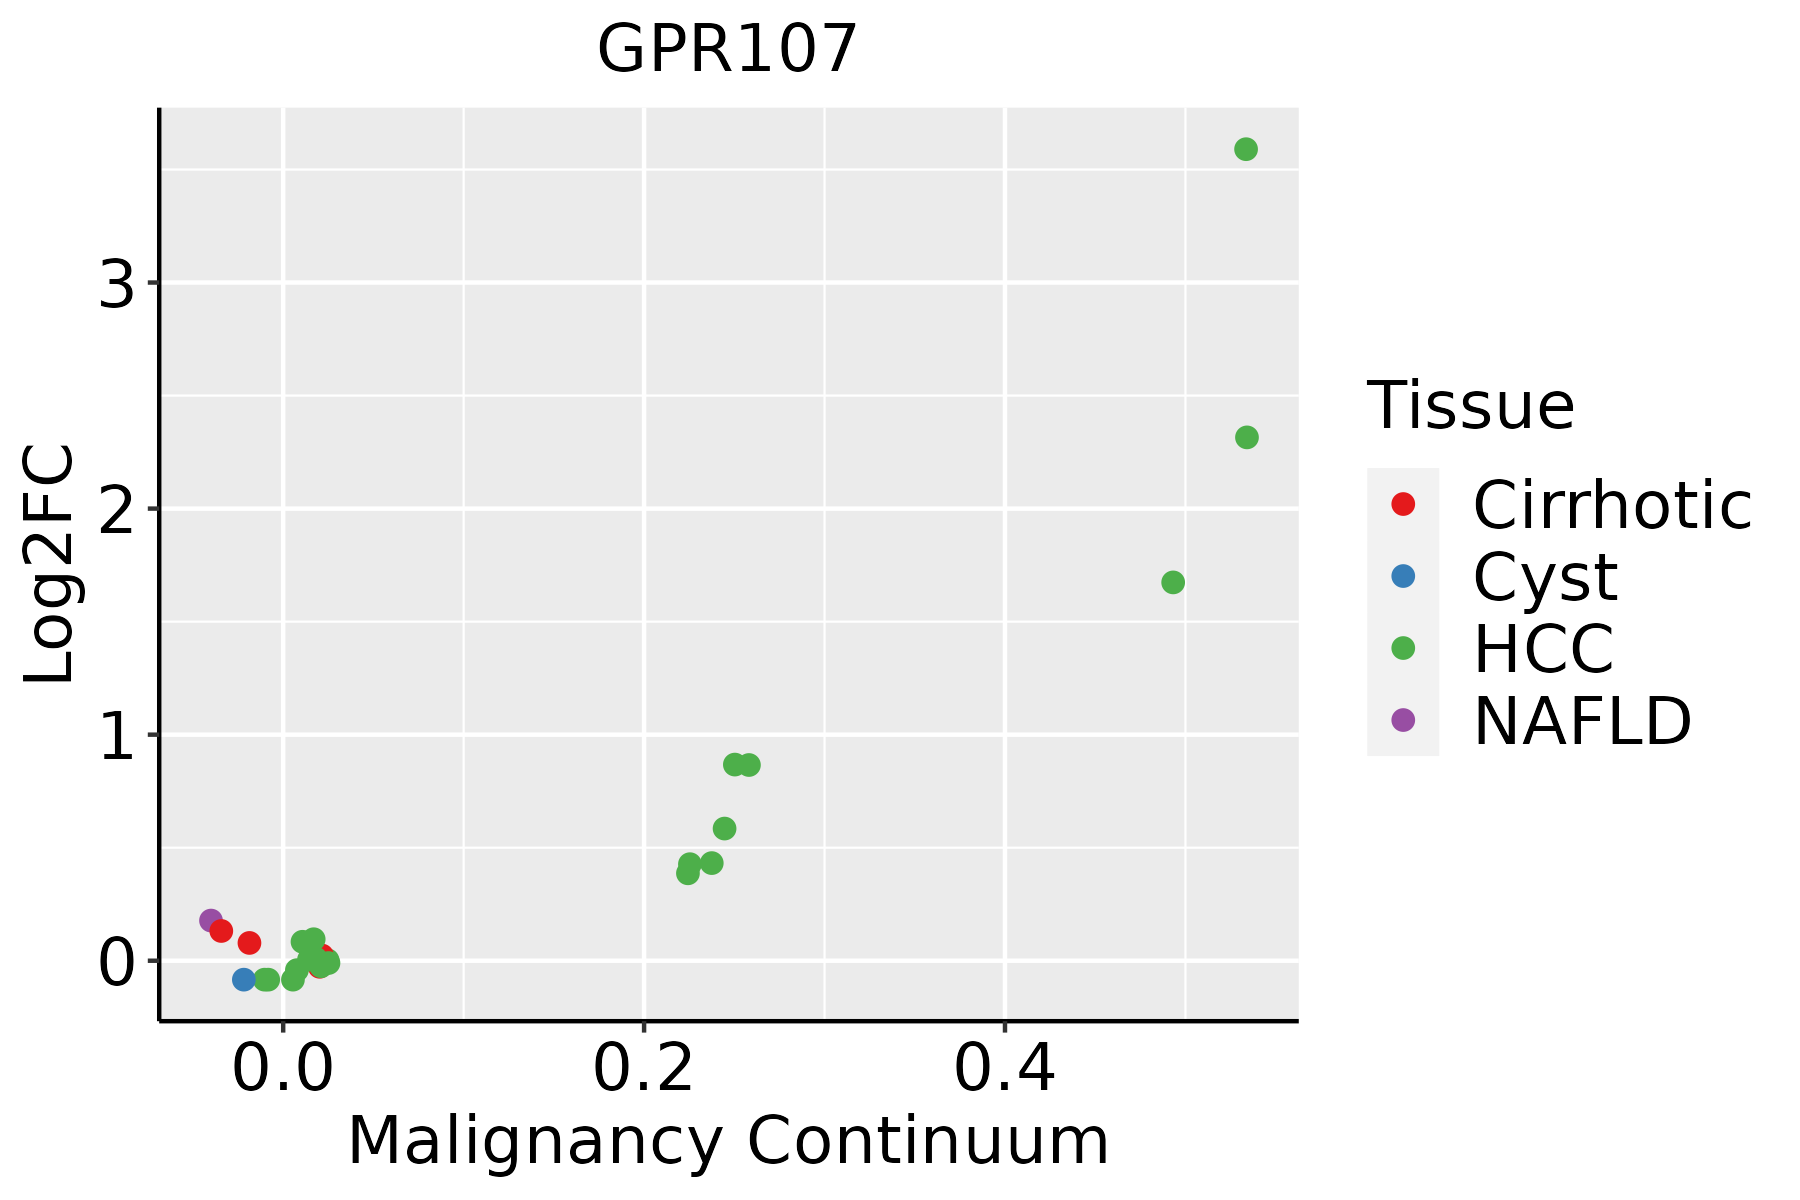 | HCC: Hepatocellular carcinoma |
| NAFLD: Non-alcoholic fatty liver disease |
| Oral Cavity | 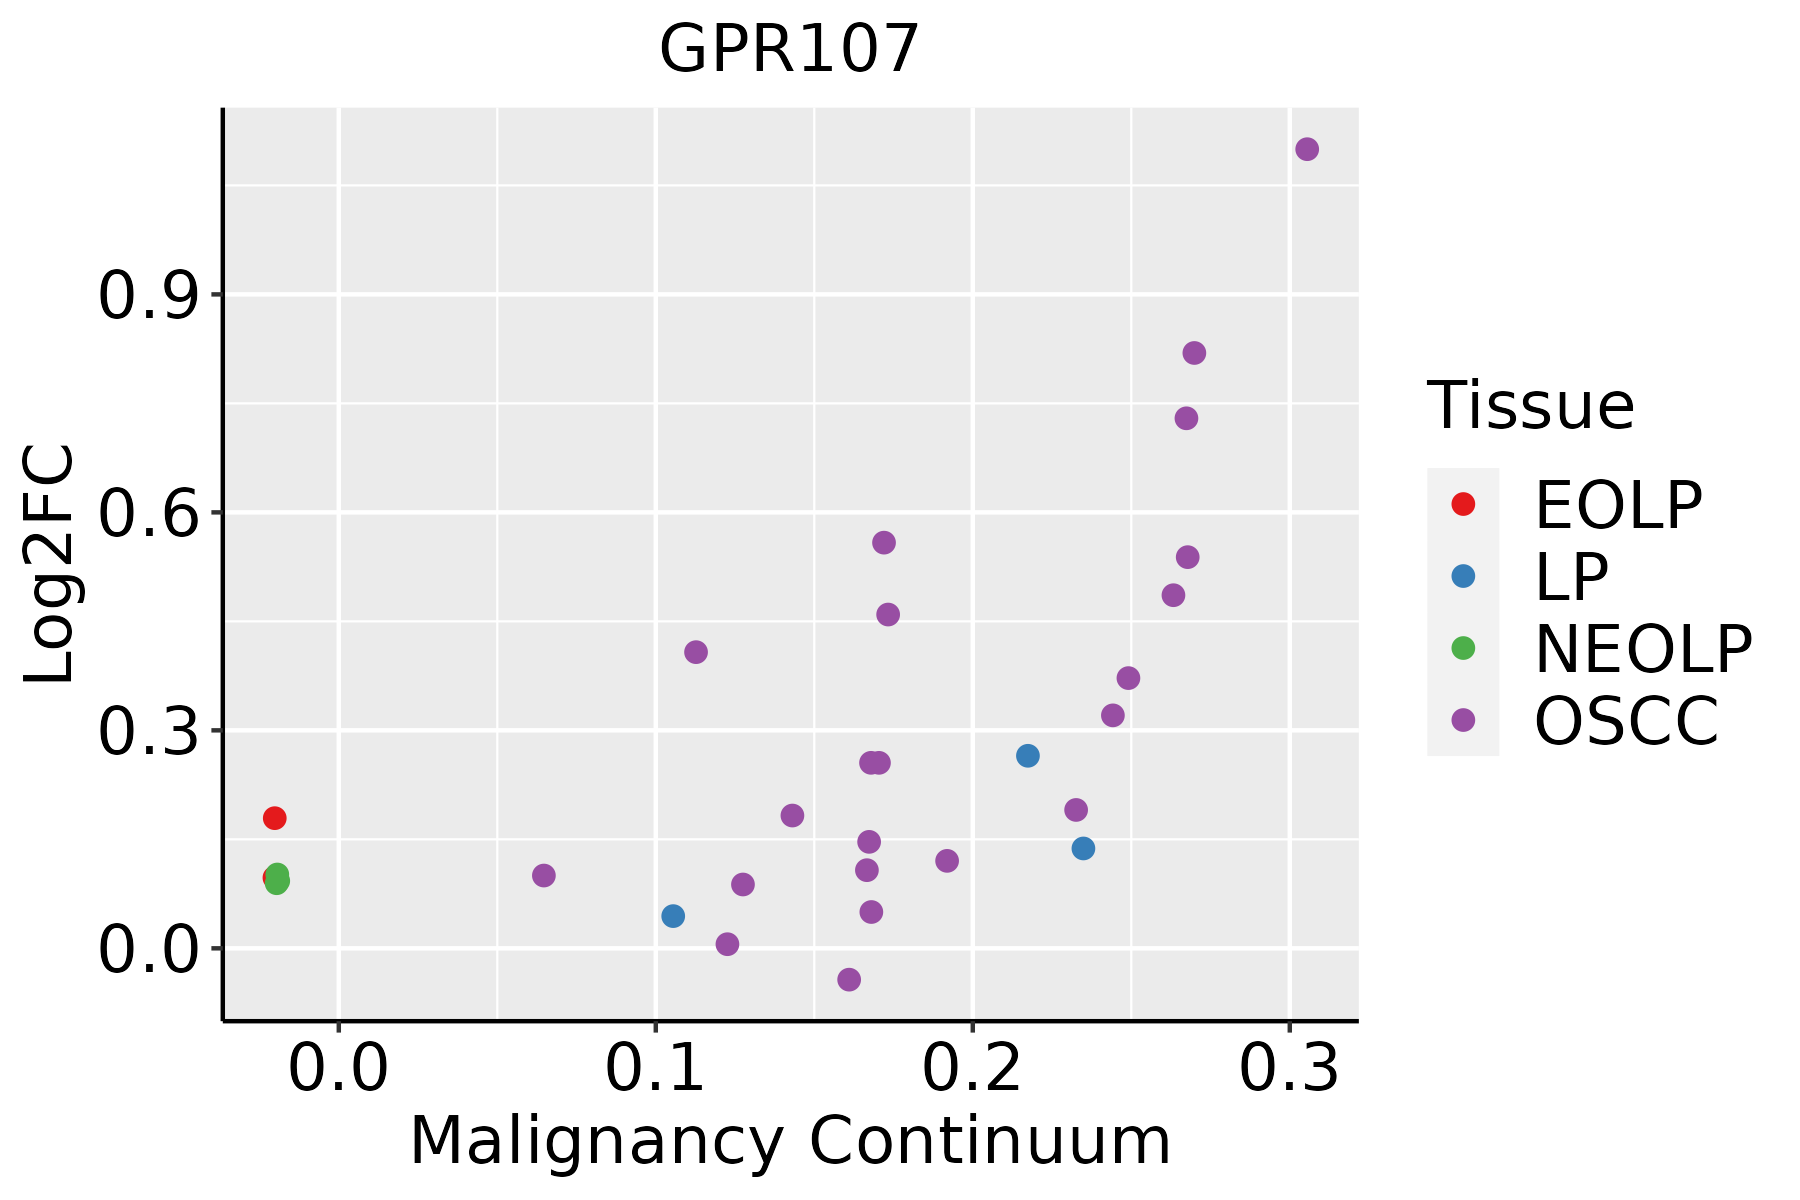 | EOLP: Erosive Oral lichen planus |
| LP: leukoplakia |
| NEOLP: Non-erosive oral lichen planus |
| OSCC: Oral squamous cell carcinoma |
| Thyroid | 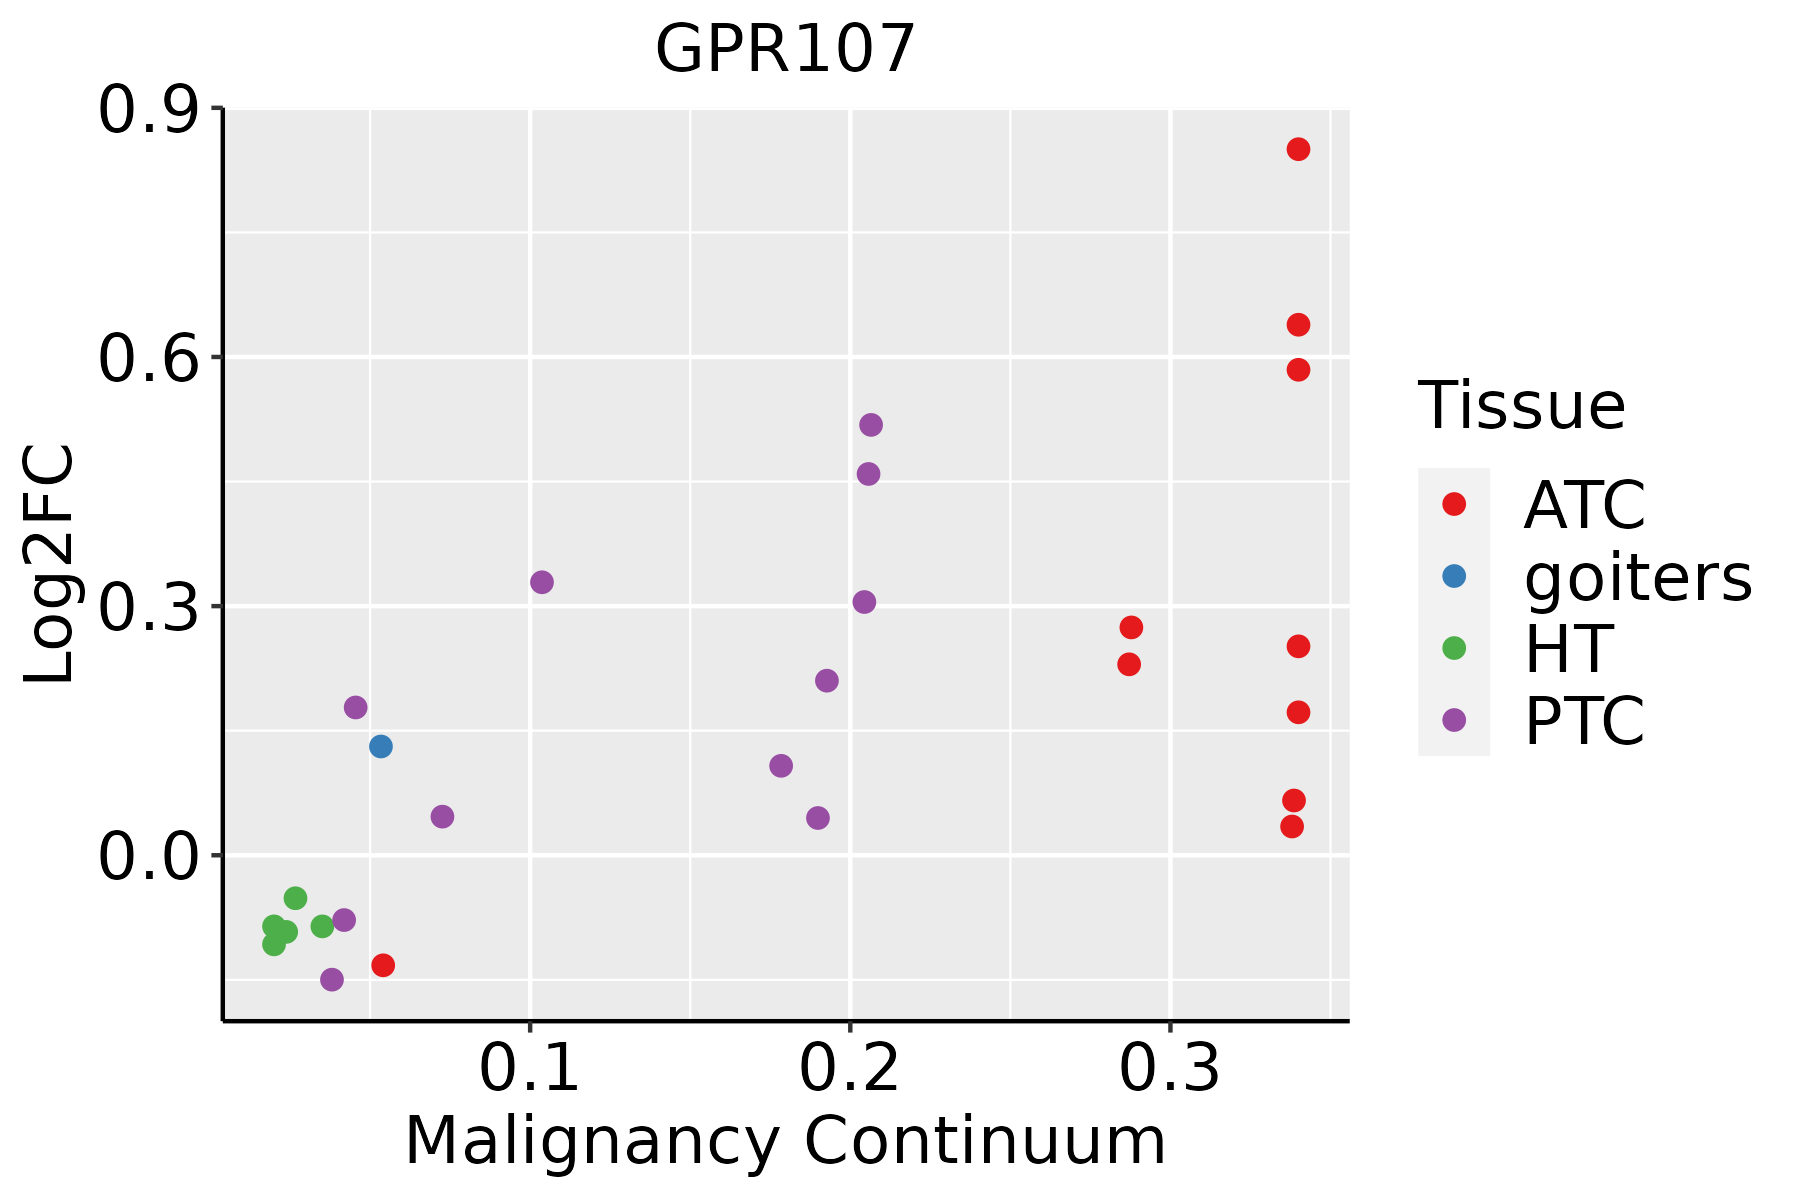 | ATC: Anaplastic thyroid cancer |
| HT: Hashimoto's thyroiditis |
| PTC: Papillary thyroid cancer |
| GO ID | Tissue | Disease Stage | Description | Gene Ratio | Bg Ratio | pvalue | p.adjust | Count |
| GO:00068987 | Cervix | CC | receptor-mediated endocytosis | 53/2311 | 244/18723 | 2.52e-05 | 4.29e-04 | 53 |
| GO:00725836 | Cervix | CC | clathrin-dependent endocytosis | 16/2311 | 47/18723 | 9.56e-05 | 1.25e-03 | 16 |
| GO:0072583 | Colorectum | AD | clathrin-dependent endocytosis | 24/3918 | 47/18723 | 4.60e-06 | 1.22e-04 | 24 |
| GO:0006898 | Colorectum | AD | receptor-mediated endocytosis | 76/3918 | 244/18723 | 1.07e-04 | 1.59e-03 | 76 |
| GO:00725831 | Colorectum | MSS | clathrin-dependent endocytosis | 22/3467 | 47/18723 | 8.74e-06 | 2.16e-04 | 22 |
| GO:00068981 | Colorectum | MSS | receptor-mediated endocytosis | 69/3467 | 244/18723 | 1.18e-04 | 1.82e-03 | 69 |
| GO:00725832 | Colorectum | FAP | clathrin-dependent endocytosis | 21/2622 | 47/18723 | 3.45e-07 | 1.87e-05 | 21 |
| GO:00068982 | Colorectum | FAP | receptor-mediated endocytosis | 62/2622 | 244/18723 | 1.47e-06 | 6.39e-05 | 62 |
| GO:00725833 | Colorectum | CRC | clathrin-dependent endocytosis | 18/2078 | 47/18723 | 1.16e-06 | 6.75e-05 | 18 |
| GO:00068983 | Colorectum | CRC | receptor-mediated endocytosis | 50/2078 | 244/18723 | 1.27e-05 | 4.08e-04 | 50 |
| GO:000689818 | Esophagus | ESCC | receptor-mediated endocytosis | 142/8552 | 244/18723 | 5.22e-05 | 4.05e-04 | 142 |
| GO:007258314 | Esophagus | ESCC | clathrin-dependent endocytosis | 34/8552 | 47/18723 | 1.91e-04 | 1.21e-03 | 34 |
| GO:000689821 | Liver | HCC | receptor-mediated endocytosis | 134/7958 | 244/18723 | 5.73e-05 | 5.31e-04 | 134 |
| GO:007258311 | Liver | HCC | clathrin-dependent endocytosis | 31/7958 | 47/18723 | 9.90e-04 | 5.71e-03 | 31 |
| GO:000689810 | Oral cavity | OSCC | receptor-mediated endocytosis | 125/7305 | 244/18723 | 6.56e-05 | 5.32e-04 | 125 |
| GO:00725838 | Oral cavity | OSCC | clathrin-dependent endocytosis | 30/7305 | 47/18723 | 4.96e-04 | 2.92e-03 | 30 |
| GO:007258321 | Oral cavity | EOLP | clathrin-dependent endocytosis | 19/2218 | 47/18723 | 6.00e-07 | 1.56e-05 | 19 |
| GO:000689825 | Oral cavity | EOLP | receptor-mediated endocytosis | 55/2218 | 244/18723 | 1.64e-06 | 3.82e-05 | 55 |
| GO:0006898110 | Thyroid | PTC | receptor-mediated endocytosis | 112/5968 | 244/18723 | 2.87e-06 | 3.74e-05 | 112 |
| GO:007258310 | Thyroid | PTC | clathrin-dependent endocytosis | 30/5968 | 47/18723 | 6.62e-06 | 7.83e-05 | 30 |
| Hugo Symbol | Variant Class | Variant Classification | dbSNP RS | HGVSc | HGVSp | HGVSp Short | SWISSPROT | BIOTYPE | SIFT | PolyPhen | Tumor Sample Barcode | Tissue | Histology | Sex | Age | Stage | Therapy Types | Drugs | Outcome |
| GPR107 | SNV | Missense_Mutation | | c.1681N>C | p.Glu561Gln | p.E561Q | Q5VW38 | protein_coding | deleterious(0) | benign(0.354) | TCGA-AC-A23H-01 | Breast | breast invasive carcinoma | Female | >=65 | I/II | Unknown | Unknown | PD |
| GPR107 | SNV | Missense_Mutation | | c.1576N>A | p.Leu526Ile | p.L526I | Q5VW38 | protein_coding | deleterious(0.01) | benign(0.437) | TCGA-AO-A0J5-01 | Breast | breast invasive carcinoma | Female | <65 | III/IV | Other, specify in notesBisphosphonate | zoledronic | PD |
| GPR107 | SNV | Missense_Mutation | rs759860772 | c.1103N>T | p.Lys368Met | p.K368M | Q5VW38 | protein_coding | deleterious(0) | probably_damaging(0.998) | TCGA-BH-A0DK-01 | Breast | breast invasive carcinoma | Female | <65 | I/II | Hormone Therapy | tamoxiphen | SD |
| GPR107 | SNV | Missense_Mutation | rs368664209 | c.1547A>G | p.Lys516Arg | p.K516R | Q5VW38 | protein_coding | tolerated(0.23) | benign(0.286) | TCGA-HN-A2NL-01 | Breast | breast invasive carcinoma | Female | <65 | I/II | Chemotherapy | cyclophosphamide | SD |
| GPR107 | insertion | Frame_Shift_Ins | novel | c.219_220insAATTTGAATCCATTGAATACTTCCTTCTGCAGAAA | p.Leu74AsnfsTer15 | p.L74Nfs*15 | Q5VW38 | protein_coding | | | TCGA-A7-A0CJ-01 | Breast | breast invasive carcinoma | Female | <65 | I/II | Chemotherapy | cytoxan | SD |
| GPR107 | insertion | Frame_Shift_Ins | novel | c.245_246insTAGTGCAGTGTGGTGTAGTTCTGTG | p.Lys82AsnfsTer16 | p.K82Nfs*16 | Q5VW38 | protein_coding | | | TCGA-BH-A0HK-01 | Breast | breast invasive carcinoma | Female | >=65 | I/II | Hormone Therapy | arimidex | SD |
| GPR107 | SNV | Missense_Mutation | novel | c.1609N>C | p.Val537Leu | p.V537L | Q5VW38 | protein_coding | deleterious(0.01) | possibly_damaging(0.677) | TCGA-EA-A3HU-01 | Cervix | cervical & endocervical cancer | Female | <65 | I/II | Unknown | Unknown | SD |
| GPR107 | SNV | Missense_Mutation | | c.1729N>A | p.Glu577Lys | p.E577K | Q5VW38 | protein_coding | deleterious(0) | probably_damaging(0.996) | TCGA-IR-A3LH-01 | Cervix | cervical & endocervical cancer | Female | <65 | I/II | Chemotherapy | cisplatin | CR |
| GPR107 | SNV | Missense_Mutation | rs200754726 | c.854G>A | p.Arg285Gln | p.R285Q | Q5VW38 | protein_coding | tolerated(0.34) | possibly_damaging(0.732) | TCGA-UC-A7PG-06 | Cervix | cervical & endocervical cancer | Female | <65 | III/IV | Chemotherapy | cisplatin | PD |
| GPR107 | deletion | Frame_Shift_Del | novel | c.1631delN | p.Tyr544LeufsTer27 | p.Y544Lfs*27 | Q5VW38 | protein_coding | | | TCGA-MA-AA3X-01 | Cervix | cervical & endocervical cancer | Female | <65 | III/IV | Chemotherapy | cisplatin | CR |


