
|
|||||
|
 | |
| |
| |
| |
| |
| |
|
Gene: GPN1 |
Gene summary for GPN1 |
| Gene information | Species | Human | Gene symbol | GPN1 | Gene ID | 11321 |
| Gene name | GPN-loop GTPase 1 | |
| Gene Alias | ATPBD1A | |
| Cytomap | 2p23.3 | |
| Gene Type | protein-coding | GO ID | GO:0005575 | UniProtAcc | Q9HCN4 |
Top |
Malignant transformation analysis |
| Identification of the aberrant gene expression in precancerous and cancerous lesions by comparing the gene expression of stem-like cells in diseased tissues with normal stem cells |
| Entrez ID | Symbol | Replicates | Species | Organ | Tissue | Adj P-value | Log2FC | Malignancy |
| 11321 | GPN1 | LZE4T | Human | Esophagus | ESCC | 1.89e-13 | 6.68e-01 | 0.0811 |
| 11321 | GPN1 | LZE7T | Human | Esophagus | ESCC | 7.35e-03 | 3.29e-01 | 0.0667 |
| 11321 | GPN1 | LZE20T | Human | Esophagus | ESCC | 5.76e-03 | 6.98e-02 | 0.0662 |
| 11321 | GPN1 | LZE24T | Human | Esophagus | ESCC | 8.74e-06 | 2.69e-01 | 0.0596 |
| 11321 | GPN1 | LZE6T | Human | Esophagus | ESCC | 1.32e-05 | 4.38e-01 | 0.0845 |
| 11321 | GPN1 | P2T-E | Human | Esophagus | ESCC | 4.03e-27 | 6.03e-01 | 0.1177 |
| 11321 | GPN1 | P4T-E | Human | Esophagus | ESCC | 3.61e-29 | 7.98e-01 | 0.1323 |
| 11321 | GPN1 | P5T-E | Human | Esophagus | ESCC | 3.85e-29 | 6.66e-01 | 0.1327 |
| 11321 | GPN1 | P8T-E | Human | Esophagus | ESCC | 4.58e-15 | 2.39e-01 | 0.0889 |
| 11321 | GPN1 | P9T-E | Human | Esophagus | ESCC | 2.33e-11 | 1.55e-01 | 0.1131 |
| 11321 | GPN1 | P10T-E | Human | Esophagus | ESCC | 9.15e-23 | 4.09e-01 | 0.116 |
| 11321 | GPN1 | P11T-E | Human | Esophagus | ESCC | 2.22e-12 | 7.67e-01 | 0.1426 |
| 11321 | GPN1 | P12T-E | Human | Esophagus | ESCC | 2.36e-25 | 5.34e-01 | 0.1122 |
| 11321 | GPN1 | P15T-E | Human | Esophagus | ESCC | 2.62e-22 | 5.69e-01 | 0.1149 |
| 11321 | GPN1 | P16T-E | Human | Esophagus | ESCC | 2.98e-24 | 4.30e-01 | 0.1153 |
| 11321 | GPN1 | P19T-E | Human | Esophagus | ESCC | 6.23e-04 | 8.83e-01 | 0.1662 |
| 11321 | GPN1 | P20T-E | Human | Esophagus | ESCC | 1.61e-08 | 3.05e-01 | 0.1124 |
| 11321 | GPN1 | P21T-E | Human | Esophagus | ESCC | 5.13e-26 | 5.28e-01 | 0.1617 |
| 11321 | GPN1 | P22T-E | Human | Esophagus | ESCC | 2.04e-26 | 5.82e-01 | 0.1236 |
| 11321 | GPN1 | P23T-E | Human | Esophagus | ESCC | 2.78e-23 | 6.02e-01 | 0.108 |
| Page: 1 2 3 4 5 |
| Tissue | Expression Dynamics | Abbreviation |
| Esophagus | 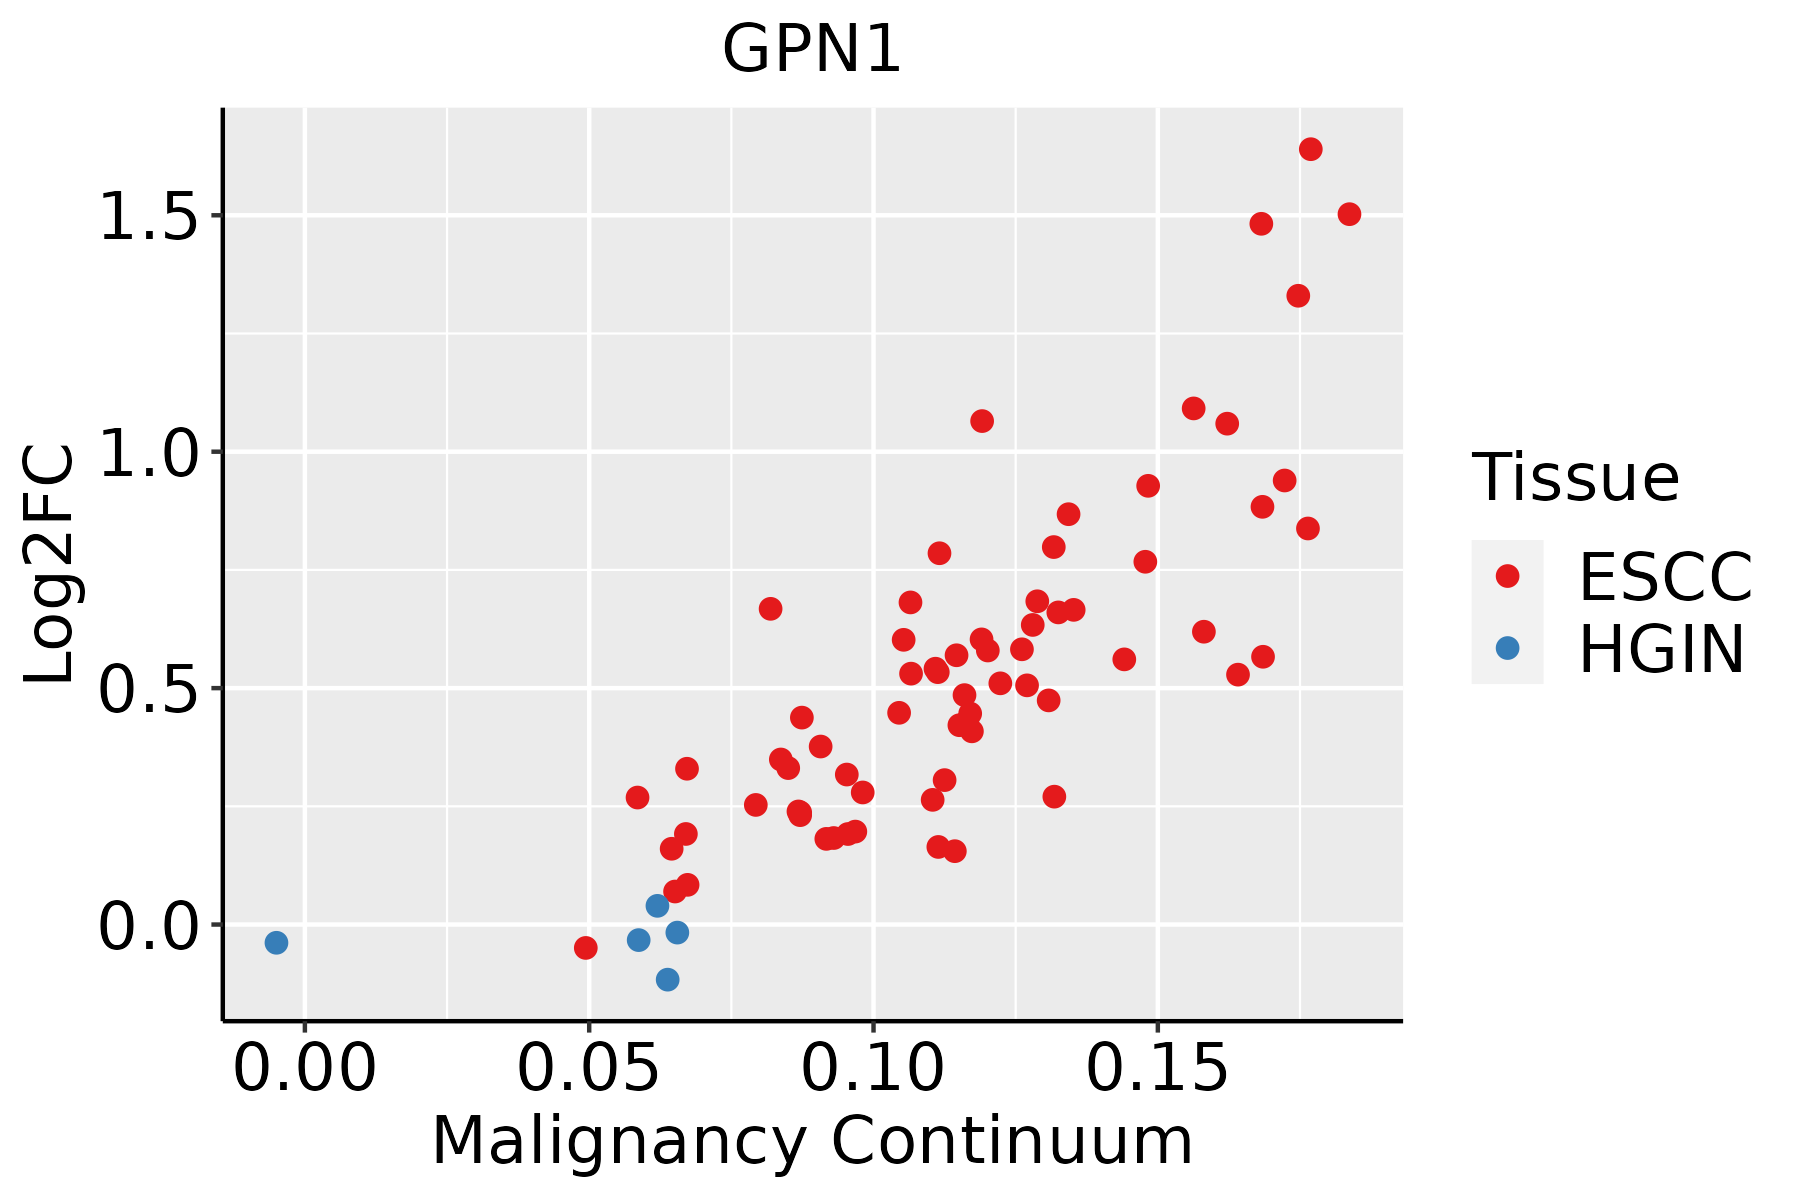 | ESCC: Esophageal squamous cell carcinoma |
| HGIN: High-grade intraepithelial neoplasias | ||
| LGIN: Low-grade intraepithelial neoplasias | ||
| Liver | 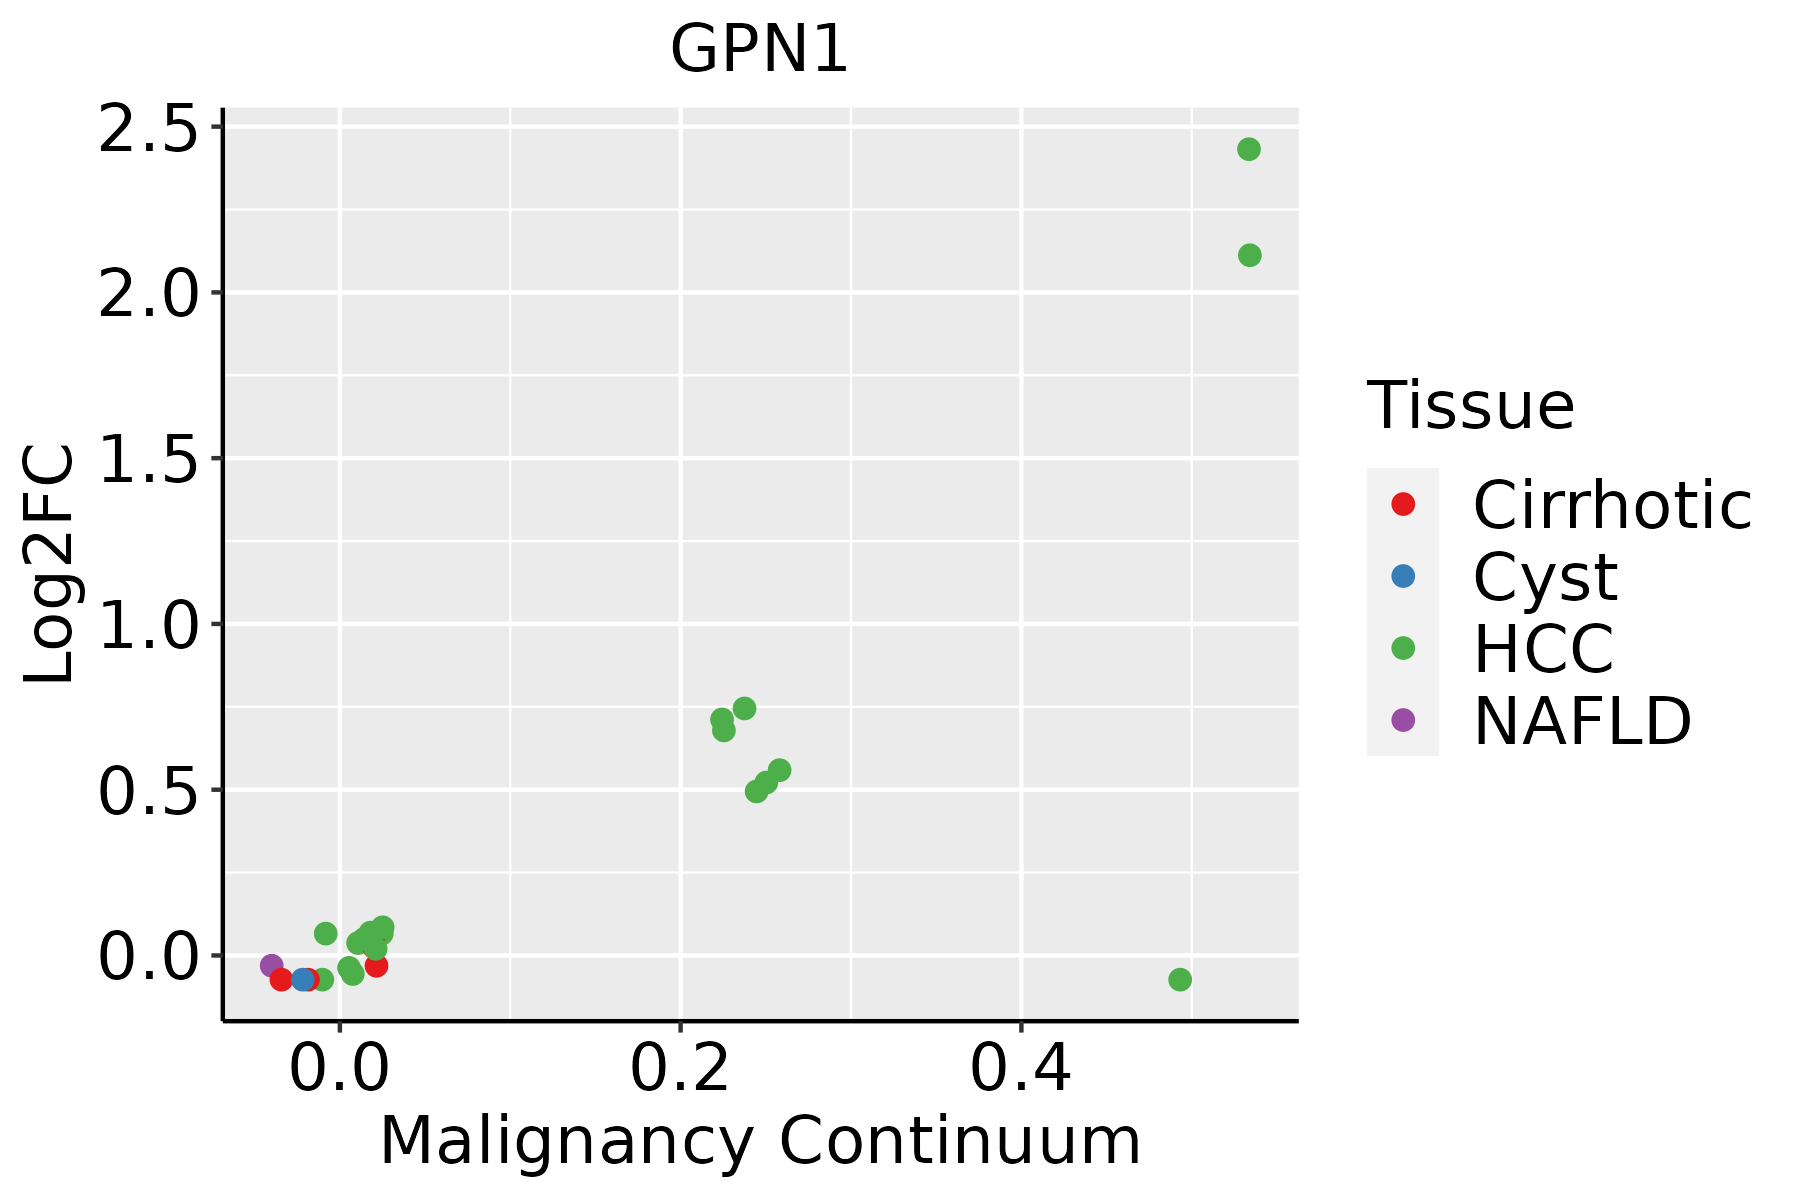 | HCC: Hepatocellular carcinoma |
| NAFLD: Non-alcoholic fatty liver disease | ||
| Oral Cavity | 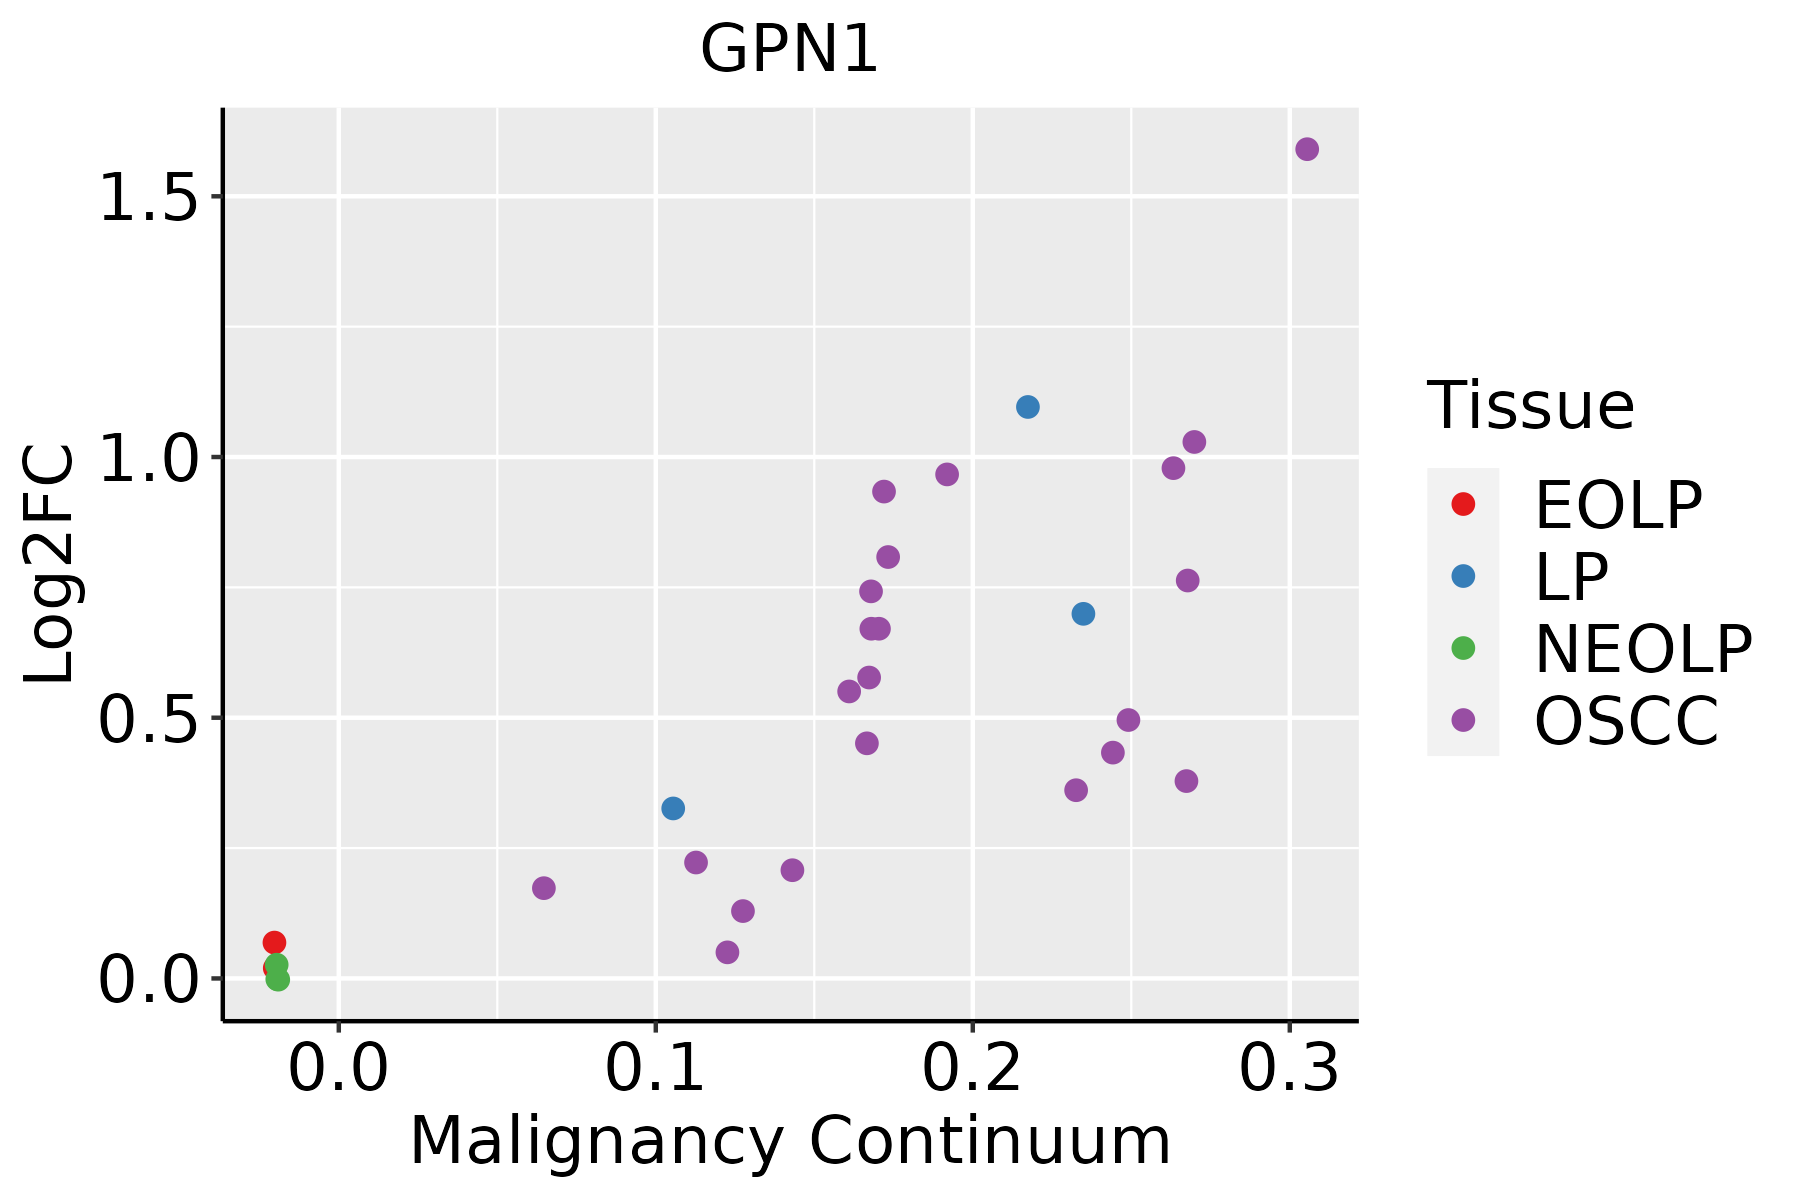 | EOLP: Erosive Oral lichen planus |
| LP: leukoplakia | ||
| NEOLP: Non-erosive oral lichen planus | ||
| OSCC: Oral squamous cell carcinoma | ||
| Skin | 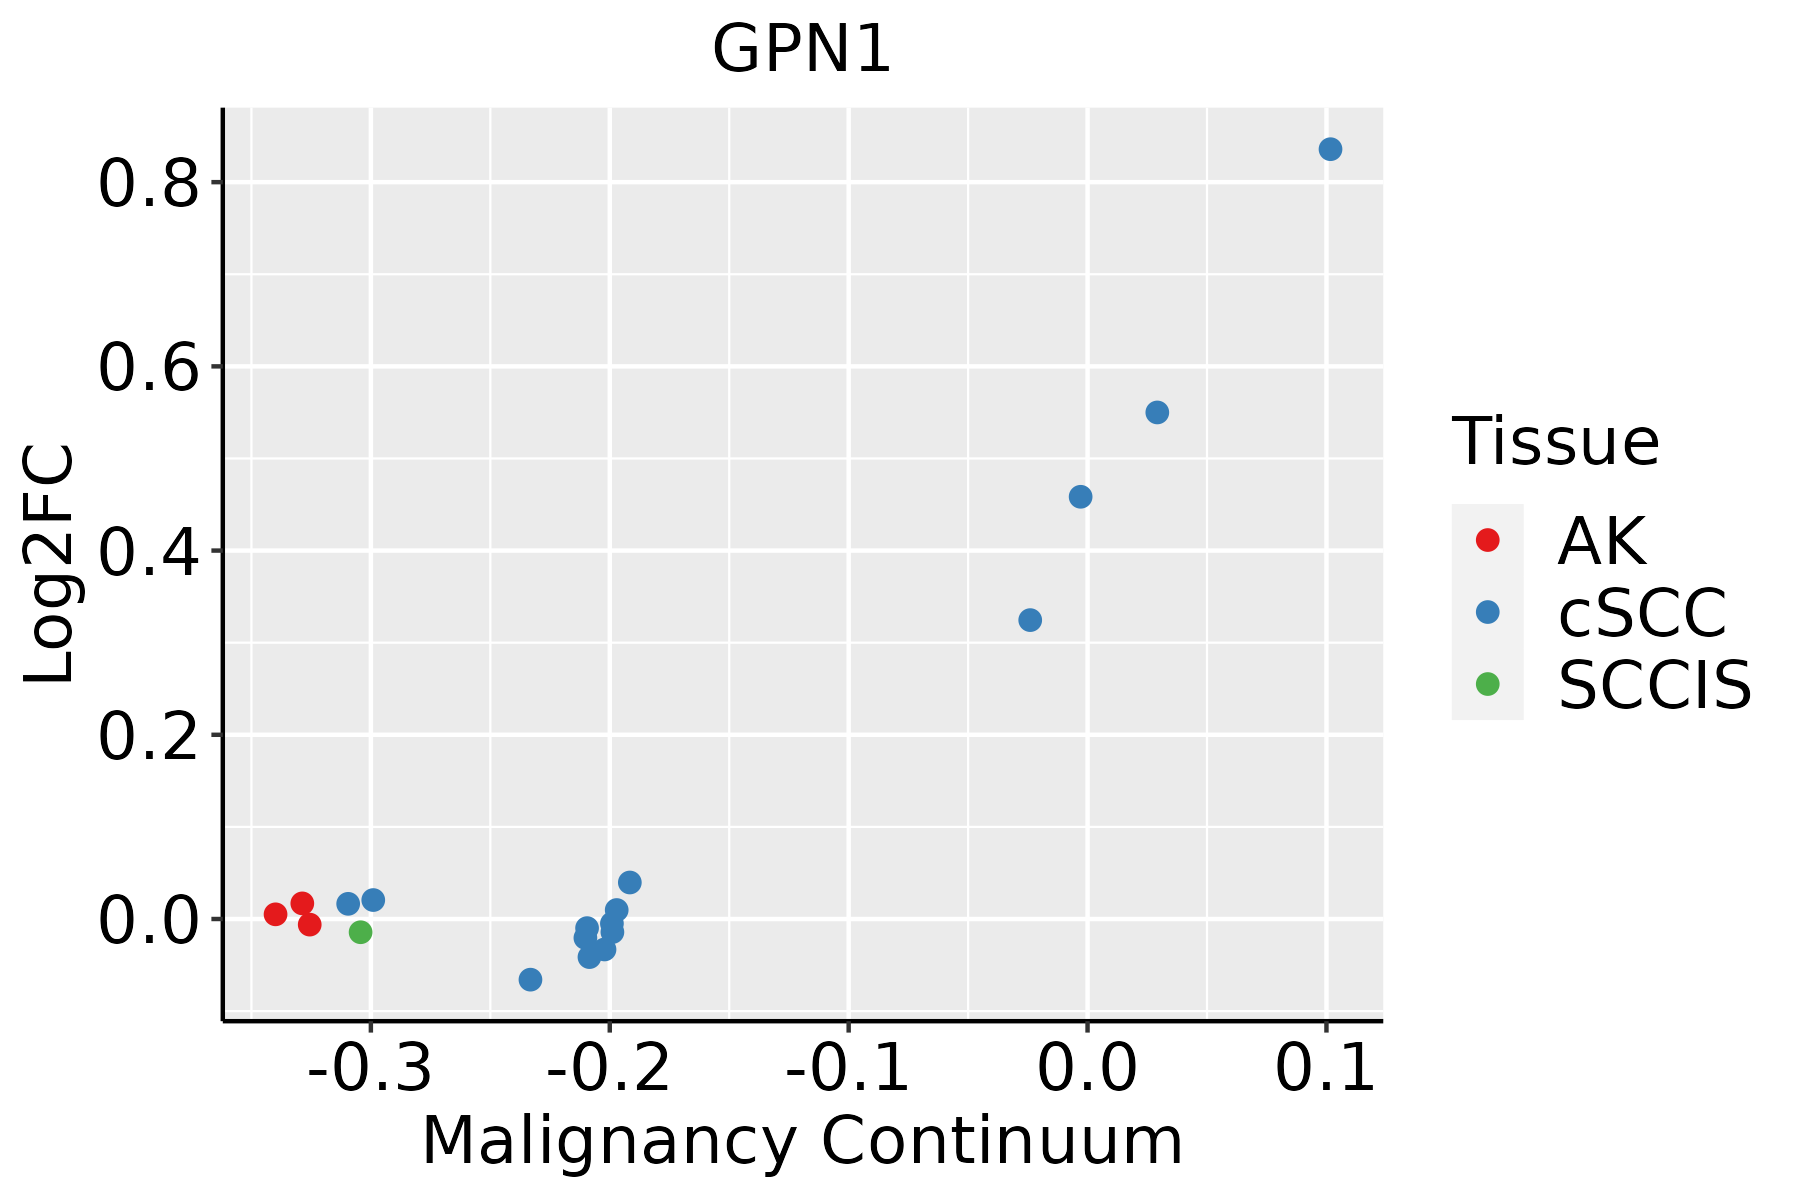 | AK: Actinic keratosis |
| cSCC: Cutaneous squamous cell carcinoma | ||
| SCCIS:squamous cell carcinoma in situ |
| ∗log2FC in expression of this searched gene in stem-like cells from each diseased tissue sample relative to stem-like cells in normal samples in each tissue plotted against the malignancy continuum. Samples are colored based on if they are from different disease stage. |
Top |
Malignant transformation related pathway analysis |
| Find out the enriched GO biological processes and KEGG pathways involved in transition from healthy to precancer to cancer |
| Tissue | Disease Stage | Enriched GO biological Processes |
| Colorectum | AD |  |
| Colorectum | SER |  |
| Colorectum | MSS |  |
| Colorectum | MSI-H |  |
| Colorectum | FAP |  |
| ∗Top 15 enriched GO BP terms are showed in the bar plot of each disease state in each tissue. Each row represents a significant GO biological process which is colored according to the -log10(p.adjust). |
| Page: 1 2 3 4 5 6 7 8 9 |
| GO ID | Tissue | Disease Stage | Description | Gene Ratio | Bg Ratio | pvalue | p.adjust | Count |
| Page: 1 |
| Pathway ID | Tissue | Disease Stage | Description | Gene Ratio | Bg Ratio | pvalue | p.adjust | qvalue | Count |
| Page: 1 |
Top |
Cell-cell communication analysis |
| Identification of potential cell-cell interactions between two cell types and their ligand-receptor pairs for different disease states |
| Ligand | Receptor | LRpair | Pathway | Tissue | Disease Stage |
| Page: 1 |
Top |
Single-cell gene regulatory network inference analysis |
| Find out the significant the regulons (TFs) and the target genes of each regulon across cell types for different disease states |
| TF | Cell Type | Tissue | Disease Stage | Target Gene | RSS | Regulon Activity |
| ∗The dot plots of a searched regulon are shown for all cell subpopulations in each disease state of each tissue based on the regulon specific score inferred using pySCENIC and by calculating the average expression. |
| Page: 1 |
Top |
Somatic mutation of malignant transformation related genes |
| Annotation of somatic variants for genes involved in malignant transformation |
| Hugo Symbol | Variant Class | Variant Classification | dbSNP RS | HGVSc | HGVSp | HGVSp Short | SWISSPROT | BIOTYPE | SIFT | PolyPhen | Tumor Sample Barcode | Tissue | Histology | Sex | Age | Stage | Therapy Types | Drugs | Outcome |
| GPN1 | insertion | Nonsense_Mutation | novel | c.224_225insGATGAAATAAATCACAACTGTTTTC | p.Val76MetfsTer3 | p.V76Mfs*3 | Q9HCN4 | protein_coding | TCGA-AN-A049-01 | Breast | breast invasive carcinoma | Female | <65 | I/II | Unknown | Unknown | SD | ||
| GPN1 | SNV | Missense_Mutation | c.1001N>T | p.Ser334Phe | p.S334F | Q9HCN4 | protein_coding | deleterious(0) | probably_damaging(0.986) | TCGA-EK-A2RJ-01 | Cervix | cervical & endocervical cancer | Female | <65 | I/II | Unknown | Unknown | SD | |
| GPN1 | SNV | Missense_Mutation | c.655N>T | p.Asp219Tyr | p.D219Y | Q9HCN4 | protein_coding | deleterious(0) | probably_damaging(0.999) | TCGA-AA-3968-01 | Colorectum | colon adenocarcinoma | Female | <65 | I/II | Unknown | Unknown | SD | |
| GPN1 | SNV | Missense_Mutation | c.1133C>T | p.Ser378Leu | p.S378L | Q9HCN4 | protein_coding | tolerated(0.15) | benign(0.084) | TCGA-AA-A00N-01 | Colorectum | colon adenocarcinoma | Male | >=65 | I/II | Unknown | Unknown | PD | |
| GPN1 | SNV | Missense_Mutation | c.1036N>A | p.Glu346Lys | p.E346K | Q9HCN4 | protein_coding | tolerated(0.05) | benign(0.037) | TCGA-AD-6889-01 | Colorectum | colon adenocarcinoma | Male | >=65 | I/II | Chemotherapy | xeloda | PD | |
| GPN1 | SNV | Missense_Mutation | novel | c.368N>G | p.Ile123Ser | p.I123S | Q9HCN4 | protein_coding | deleterious(0) | possibly_damaging(0.791) | TCGA-CA-6717-01 | Colorectum | colon adenocarcinoma | Male | <65 | I/II | Chemotherapy | oxaliplatin | CR |
| GPN1 | SNV | Missense_Mutation | c.1121N>G | p.Phe374Cys | p.F374C | Q9HCN4 | protein_coding | deleterious(0) | probably_damaging(0.99) | TCGA-CA-6718-01 | Colorectum | colon adenocarcinoma | Male | <65 | I/II | Unknown | Unknown | PD | |
| GPN1 | SNV | Missense_Mutation | c.358N>T | p.Met120Leu | p.M120L | Q9HCN4 | protein_coding | tolerated(0.85) | benign(0.012) | TCGA-G4-6628-01 | Colorectum | colon adenocarcinoma | Male | >=65 | I/II | Unknown | Unknown | SD | |
| GPN1 | SNV | Missense_Mutation | novel | c.632N>T | p.Ser211Ile | p.S211I | Q9HCN4 | protein_coding | deleterious(0.02) | possibly_damaging(0.761) | TCGA-AP-A051-01 | Endometrium | uterine corpus endometrioid carcinoma | Female | >=65 | I/II | Unknown | Unknown | SD |
| GPN1 | SNV | Missense_Mutation | c.593T>C | p.Phe198Ser | p.F198S | Q9HCN4 | protein_coding | deleterious(0) | probably_damaging(0.997) | TCGA-AP-A059-01 | Endometrium | uterine corpus endometrioid carcinoma | Female | >=65 | I/II | Unknown | Unknown | SD |
| Page: 1 2 3 |
Top |
Related drugs of malignant transformation related genes |
| Identification of chemicals and drugs interact with genes involved in malignant transfromation |
| (DGIdb 4.0) |
| Entrez ID | Symbol | Category | Interaction Types | Drug Claim Name | Drug Name | PMIDs |
| Page: 1 |

Copyright 2023-Present -The University of Texas Health Science Center at Houston |