Schematic overview of the cellular and molecular mechanisms involved in the cancer progression, including the proposed cellular and molecular mechanisms in cancer cells trajectory. AT1: alveolar type 1 cells; AT2: alveolar type 2 cells; AAH: atypical adenomatous hyperplasia; AIS: adenocarcinoma in situ; MIA: minimally invasive adenocarcinoma; IA: invasive adenocarcinoma; EMT: epithelial-mesenchymal transition

Home

Download

Statistics

Help

Contact

Center for Computational Systems Medicine
leaf

Gene summary

leaf

Malignant transformation analysis

leaf

Malignant transformation related pathway analysis

leaf

Cell-cell communication analysis

leaf

Single-cell gene regulatory network inference analysis

leaf

Somatic mutation of malignant transformation related genes

leaf

Related drugs of malignant transformation related genes

Gene: GPM6B

Gene summary for GPM6B

check button Gene summary.

Gene informationSpeciesHuman
Gene symbol

GPM6B

Gene ID

2824

Gene nameglycoprotein M6B
Gene AliasM6B
CytomapXp22.2
Gene Typeprotein-coding
GO ID

GO:0001503

UniProtAcc

Q13491


Top

Malignant transformation analysis

check button Identification of the aberrant gene expression in precancerous and cancerous lesions by comparing the gene expression of stem-like cells in diseased tissues with normal stem cells
check button Malignant transformation involving gene list.
Entrez IDSymbolReplicatesSpeciesOrganTissueAdj P-valueLog2FCMalignancy
2824GPM6BLZE24THumanEsophagusESCC6.55e-061.28e-010.0596
2824GPM6BP8T-EHumanEsophagusESCC5.44e-036.73e-010.0889
2824GPM6BP10T-EHumanEsophagusESCC3.41e-031.47e-010.116
2824GPM6BP11T-EHumanEsophagusESCC6.06e-172.06e+000.1426
2824GPM6BP16T-EHumanEsophagusESCC5.44e-132.85e-010.1153
2824GPM6BP19T-EHumanEsophagusESCC1.27e-092.63e+000.1662
2824GPM6BP24T-EHumanEsophagusESCC1.13e-074.90e-010.1287
2824GPM6BP26T-EHumanEsophagusESCC6.42e-038.79e-020.1276
2824GPM6BP27T-EHumanEsophagusESCC5.68e-032.47e-020.1055
2824GPM6BP32T-EHumanEsophagusESCC2.44e-108.99e-010.1666
2824GPM6BP37T-EHumanEsophagusESCC2.76e-033.30e-010.1371
2824GPM6BP42T-EHumanEsophagusESCC4.31e-024.95e-010.1175
2824GPM6BP44T-EHumanEsophagusESCC1.63e-078.64e-010.1096
2824GPM6BP52T-EHumanEsophagusESCC1.84e-052.07e-010.1555
2824GPM6BP54T-EHumanEsophagusESCC1.51e-063.00e-010.0975
2824GPM6BP61T-EHumanEsophagusESCC1.07e-055.75e-010.099
2824GPM6BP76T-EHumanEsophagusESCC1.42e-082.14e-010.1207
2824GPM6BP79T-EHumanEsophagusESCC4.90e-051.83e-010.1154
2824GPM6BP107T-EHumanEsophagusESCC1.22e-074.43e-010.171
2824GPM6BP128T-EHumanEsophagusESCC8.35e-037.61e-020.1241
Page: 1 2 

check button Transcriptomic changes along malignancy continuum.
TissueExpression DynamicsAbbreviation
EsophagusThe image shows the transcriptomic changes along malignancy continuum.log2FC in expression of this searched gene in stem-like cells from each diseased tissue sample relative to stem-like cells in normal samples in each tissue plotted against the malignancy continuum. Samples are colored based on if they are from different disease stage.
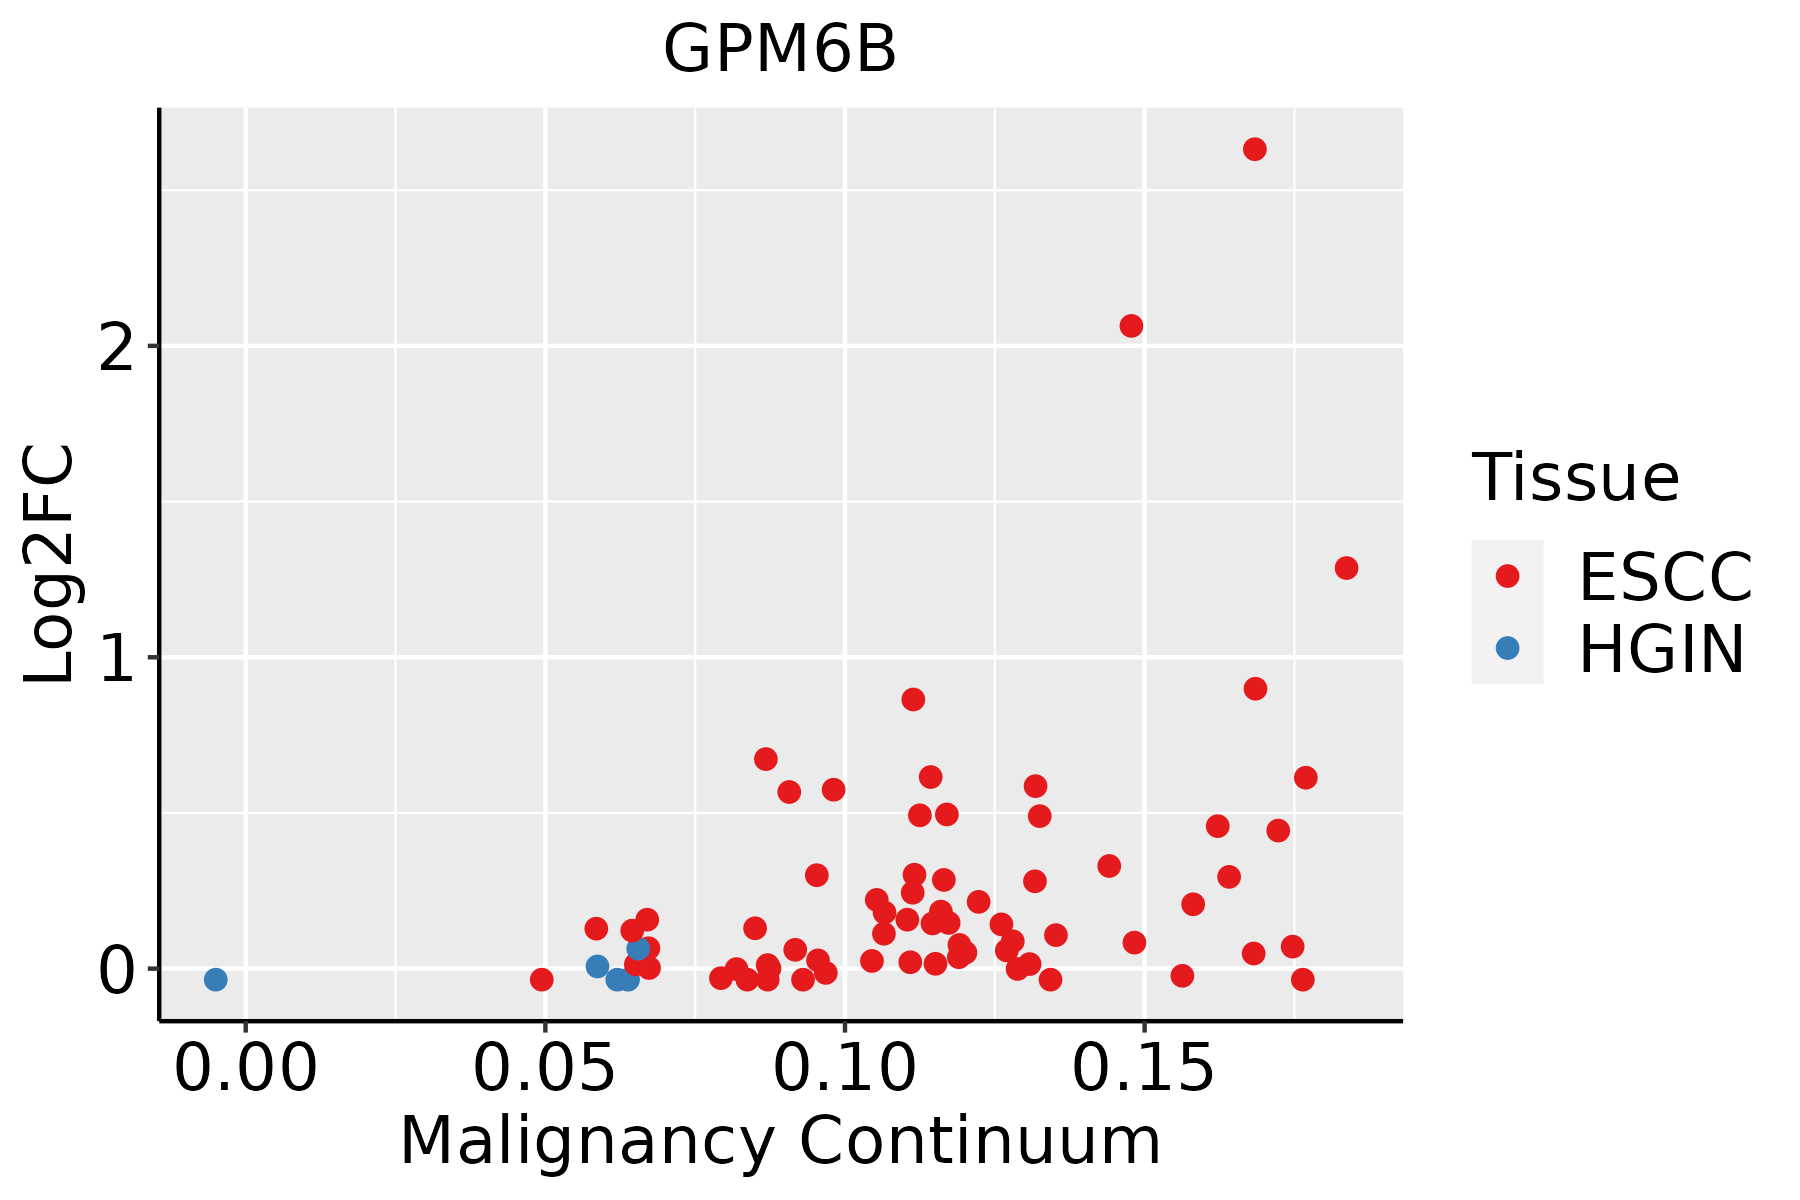
ESCC: Esophageal squamous cell carcinoma
HGIN: High-grade intraepithelial neoplasias
LGIN: Low-grade intraepithelial neoplasias
Oral CavityThe image shows the transcriptomic changes along malignancy continuum.log2FC in expression of this searched gene in stem-like cells from each diseased tissue sample relative to stem-like cells in normal samples in each tissue plotted against the malignancy continuum. Samples are colored based on if they are from different disease stage.EOLP: Erosive Oral lichen planus
LP: leukoplakia
NEOLP: Non-erosive oral lichen planus
OSCC: Oral squamous cell carcinoma
ThyroidThe image shows the transcriptomic changes along malignancy continuum.log2FC in expression of this searched gene in stem-like cells from each diseased tissue sample relative to stem-like cells in normal samples in each tissue plotted against the malignancy continuum. Samples are colored based on if they are from different disease stage.
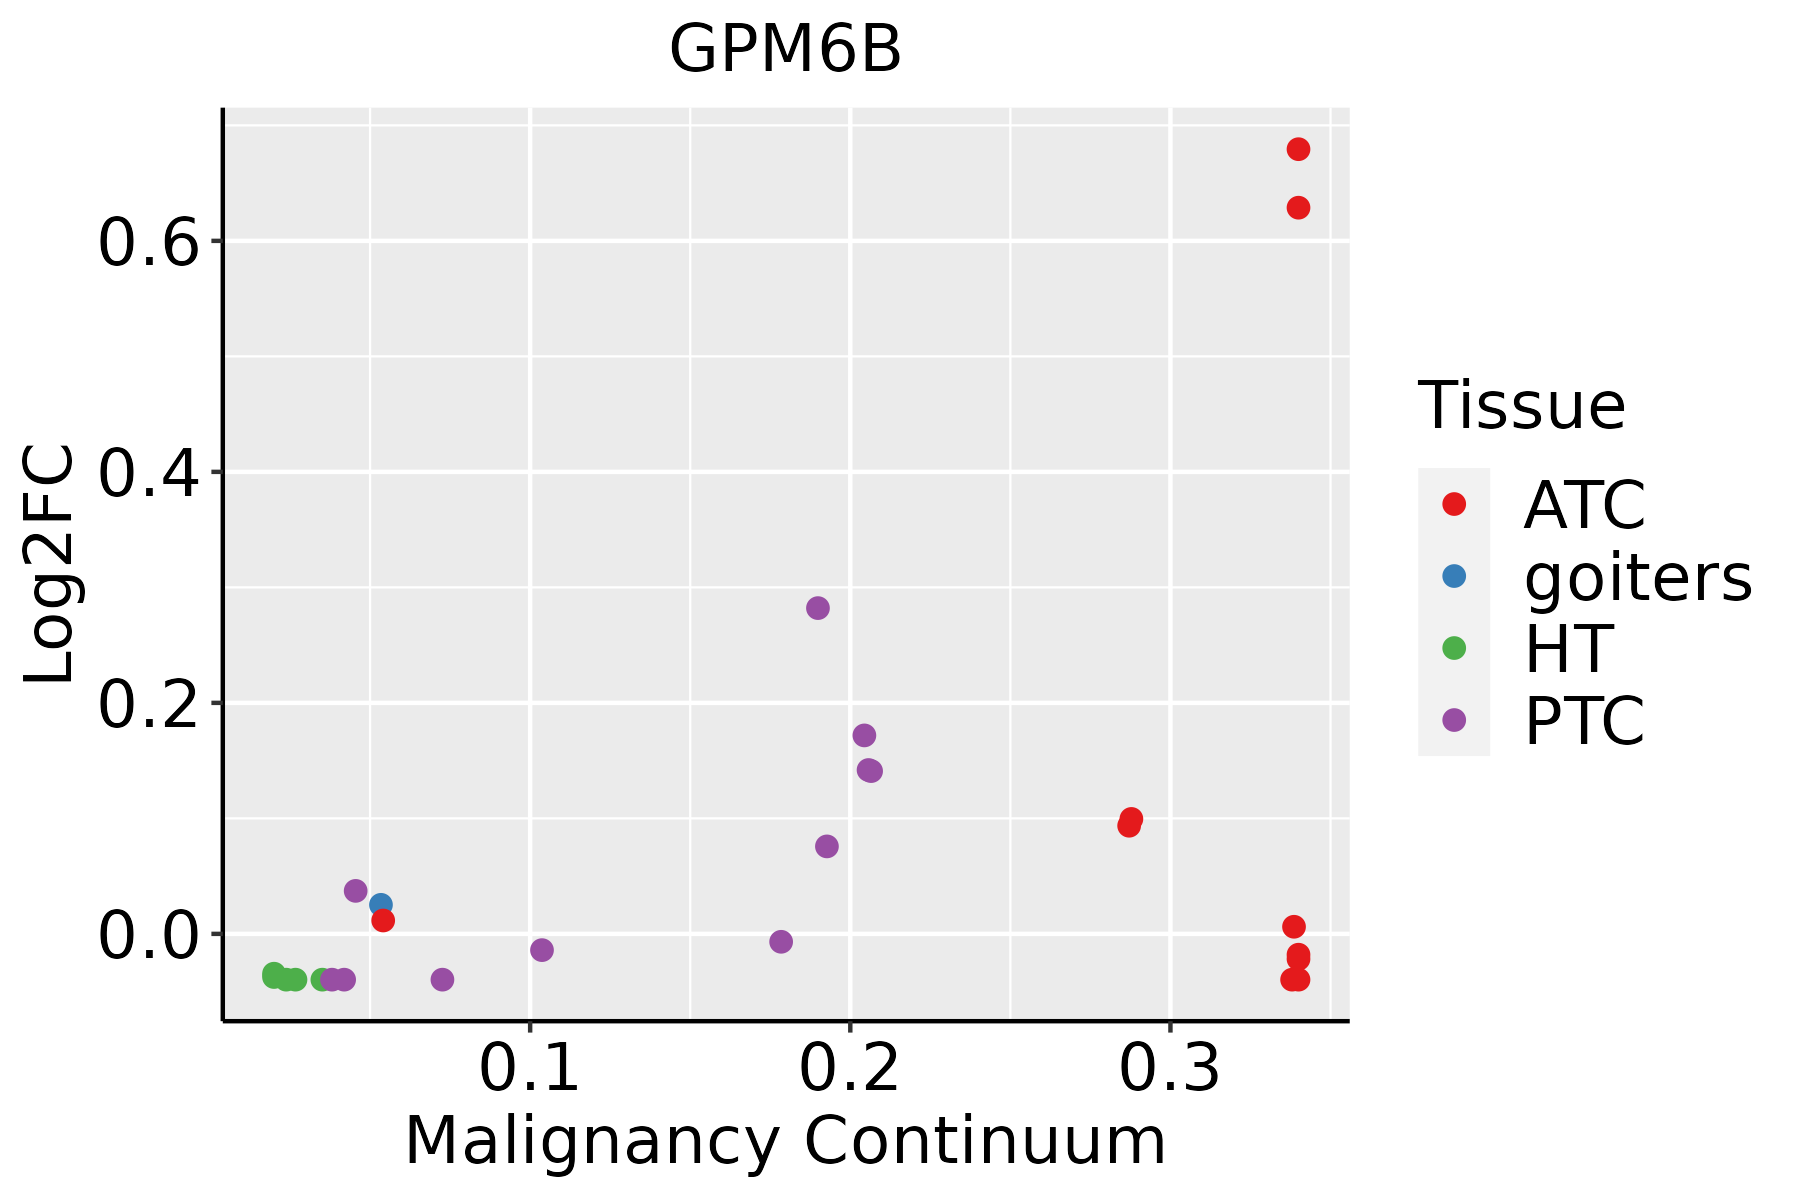
ATC: Anaplastic thyroid cancer
HT: Hashimoto's thyroiditis
PTC: Papillary thyroid cancer
∗log2FC in expression of this searched gene in stem-like cells from each diseased tissue sample relative to stem-like cells in normal samples in each tissue plotted against the malignancy continuum. Samples are colored based on if they are from different disease stage.

Top

Malignant transformation related pathway analysis

check buttonFind out the enriched GO biological processes and KEGG pathways involved in transition from healthy to precancer to cancer
check button Figure of enriched GO biological processes.
TissueDisease StageEnriched GO biological Processes
ColorectumADGO analysis - Figure of enriched GO biological processes: Top 15 enriched GO BP terms are showed in the bar plot of each disease state in each tissue. Each row represents a significant GO biological process which is colored according to the -log10(p.adjust).
ColorectumSERGO analysis - Figure of enriched GO biological processes: Top 15 enriched GO BP terms are showed in the bar plot of each disease state in each tissue. Each row represents a significant GO biological process which is colored according to the -log10(p.adjust).
ColorectumMSSGO analysis - Figure of enriched GO biological processes: Top 15 enriched GO BP terms are showed in the bar plot of each disease state in each tissue. Each row represents a significant GO biological process which is colored according to the -log10(p.adjust).
ColorectumMSI-HGO analysis - Figure of enriched GO biological processes: Top 15 enriched GO BP terms are showed in the bar plot of each disease state in each tissue. Each row represents a significant GO biological process which is colored according to the -log10(p.adjust).
ColorectumFAPGO analysis - Figure of enriched GO biological processes: Top 15 enriched GO BP terms are showed in the bar plot of each disease state in each tissue. Each row represents a significant GO biological process which is colored according to the -log10(p.adjust).
∗Top 15 enriched GO BP terms are showed in the bar plot of each disease state in each tissue. Each row represents a significant GO biological process which is colored according to the -log10(p.adjust).
Page: 1 2 3 4 5 6 7 8 9 

check button Enriched GO biological processes.
GO IDTissueDisease StageDescriptionGene RatioBg Ratiopvaluep.adjustCount
GO:0150115110EsophagusESCCcell-substrate junction organization77/8552101/187233.46e-109.57e-0977
GO:000704418EsophagusESCCcell-substrate junction assembly73/855295/187235.27e-101.35e-0873
GO:003158919EsophagusESCCcell-substrate adhesion221/8552363/187233.06e-096.62e-08221
GO:001081020EsophagusESCCregulation of cell-substrate adhesion144/8552221/187233.55e-097.45e-08144
GO:004804116EsophagusESCCfocal adhesion assembly65/855287/187233.28e-086.08e-0765
GO:0032970111EsophagusESCCregulation of actin filament-based process231/8552397/187232.91e-074.20e-06231
GO:0032956111EsophagusESCCregulation of actin cytoskeleton organization210/8552358/187234.40e-076.00e-06210
GO:000195217EsophagusESCCregulation of cell-matrix adhesion85/8552128/187231.70e-062.02e-0585
GO:000150317EsophagusESCCossification232/8552408/187233.00e-063.40e-05232
GO:000716018EsophagusESCCcell-matrix adhesion141/8552233/187233.33e-063.71e-05141
GO:015011619EsophagusESCCregulation of cell-substrate junction organization51/855271/187236.99e-067.04e-0551
GO:19038289EsophagusESCCnegative regulation of cellular protein localization76/8552117/187231.97e-051.72e-0476
GO:005189318EsophagusESCCregulation of focal adhesion assembly47/855266/187232.31e-051.98e-0447
GO:009010918EsophagusESCCregulation of cell-substrate junction assembly47/855266/187232.31e-051.98e-0447
GO:00301984EsophagusESCCextracellular matrix organization171/8552301/187236.08e-054.67e-04171
GO:00430624EsophagusESCCextracellular structure organization171/8552302/187237.73e-055.76e-04171
GO:00452294EsophagusESCCexternal encapsulating structure organization172/8552304/187237.80e-055.80e-04172
GO:003432918EsophagusESCCcell junction assembly227/8552420/187233.06e-041.83e-03227
GO:00850292EsophagusESCCextracellular matrix assembly29/855245/187238.63e-033.04e-0229
GO:190188810EsophagusESCCregulation of cell junction assembly109/8552204/187231.53e-024.96e-02109
Page: 1 2 3 4 5 6 7 

check button Enriched KEGG pathways.
Pathway IDTissueDisease StageDescriptionGene RatioBg Ratiopvaluep.adjustqvalueCount
Page: 1 

Top

Cell-cell communication analysis

check buttonIdentification of potential cell-cell interactions between two cell types and their ligand-receptor pairs for different disease states
LigandReceptorLRpairPathwayTissueDisease Stage
Page: 1 

Top

Single-cell gene regulatory network inference analysis

check buttonFind out the significant the regulons (TFs) and the target genes of each regulon across cell types for different disease states
TFCell TypeTissueDisease StageTarget GeneRSSRegulon Activity
∗The dot plots of a searched regulon are shown for all cell subpopulations in each disease state of each tissue based on the regulon specific score inferred using pySCENIC and by calculating the average expression.
Page: 1 

Top

Somatic mutation of malignant transformation related genes

check buttonAnnotation of somatic variants for genes involved in malignant transformation
Hugo SymbolVariant ClassVariant ClassificationdbSNP RSHGVScHGVSpHGVSp ShortSWISSPROTBIOTYPESIFTPolyPhenTumor Sample BarcodeTissueHistologySexAgeStageTherapy TypesDrugsOutcome
GPM6BSNVMissense_Mutationnovelc.724N>Ap.Gly242Argp.G242RQ13491protein_codingtolerated(0.06)probably_damaging(1)TCGA-A2-A3Y0-01Breastbreast invasive carcinomaFemale<65I/IIChemotherapyadriamycinCR
GPM6BSNVMissense_Mutationc.31N>Cp.Glu11Glnp.E11QQ13491protein_codingdeleterious_low_confidence(0.05)benign(0.1)TCGA-C8-A138-01Breastbreast invasive carcinomaFemale<65III/IVUnknownUnknownSD
GPM6BSNVMissense_Mutationc.5N>Gp.Lys2Argp.K2RQ13491protein_codingdeleterious_low_confidence(0.03)probably_damaging(0.98)TCGA-EW-A1IZ-01Breastbreast invasive carcinomaFemale<65III/IVChemotherapytaxotereSD
GPM6BSNVMissense_Mutationc.499N>Ap.Ala167Thrp.A167TQ13491protein_codingtolerated(0.72)benign(0.241)TCGA-LD-A74U-01Breastbreast invasive carcinomaFemale>=65III/IVChemotherapytaxotereSD
GPM6BSNVMissense_Mutationnovelc.615G>Tp.Trp205Cysp.W205CQ13491protein_codingdeleterious(0)probably_damaging(1)TCGA-PL-A8LV-01Breastbreast invasive carcinomaFemale<65III/IVUnknownUnknownSD
GPM6BSNVMissense_Mutationrs776965626c.307N>Ap.Val103Metp.V103MQ13491protein_codingtolerated(0.25)benign(0.075)TCGA-LP-A7HU-01Cervixcervical & endocervical cancerFemale<65I/IIUnknownUnknownSD
GPM6BSNVMissense_Mutationc.412N>Cp.Phe138Leup.F138LQ13491protein_codingdeleterious(0)probably_damaging(0.927)TCGA-F4-6703-01Colorectumcolon adenocarcinomaMale<65I/IIUnknownUnknownSD
GPM6BSNVMissense_Mutationnovelc.838N>Tp.Ile280Phep.I280FQ13491protein_codingtolerated(0.19)benign(0.015)TCGA-A5-A7WJ-01Endometriumuterine corpus endometrioid carcinomaFemale<65I/IIUnknownUnknownSD
GPM6BSNVMissense_Mutationrs745969304c.364N>Ap.Glu122Lysp.E122KQ13491protein_codingtolerated(0.37)benign(0.052)TCGA-AJ-A3BH-01Endometriumuterine corpus endometrioid carcinomaFemaleUnknownI/IIUnknownUnknownSD
GPM6BSNVMissense_Mutationnovelc.479N>Cp.His160Prop.H160PQ13491protein_codingtolerated(0.07)probably_damaging(0.95)TCGA-AJ-A3EL-01Endometriumuterine corpus endometrioid carcinomaFemale<65I/IIUnknownUnknownSD
Page: 1 2 3 4 

Top

Related drugs of malignant transformation related genes

check buttonIdentification of chemicals and drugs interact with genes involved in malignant transfromation
(DGIdb 4.0)
Entrez IDSymbolCategoryInteraction TypesDrug Claim NameDrug NamePMIDs
Page: 1