
|
|||||
|
 | |
| |
| |
| |
| |
| |
|
Gene: GPM6A |
Gene summary for GPM6A |
| Gene information | Species | Human | Gene symbol | GPM6A | Gene ID | 2823 |
| Gene name | glycoprotein M6A | |
| Gene Alias | GPM6 | |
| Cytomap | 4q34.2 | |
| Gene Type | protein-coding | GO ID | GO:0000902 | UniProtAcc | P51674 |
Top |
Malignant transformation analysis |
| Identification of the aberrant gene expression in precancerous and cancerous lesions by comparing the gene expression of stem-like cells in diseased tissues with normal stem cells |
| Entrez ID | Symbol | Replicates | Species | Organ | Tissue | Adj P-value | Log2FC | Malignancy |
| 2823 | GPM6A | RNA-P25T1-P25T1-1 | Human | Lung | AIS | 3.13e-22 | 9.36e-01 | -0.2116 |
| 2823 | GPM6A | RNA-P25T1-P25T1-2 | Human | Lung | AIS | 3.31e-08 | 9.00e-01 | -0.1941 |
| 2823 | GPM6A | RNA-P25T1-P25T1-3 | Human | Lung | AIS | 2.39e-10 | 9.27e-01 | -0.2107 |
| 2823 | GPM6A | RNA-P25T1-P25T1-4 | Human | Lung | AIS | 3.41e-15 | 8.31e-01 | -0.2119 |
| 2823 | GPM6A | HTA12-26-1 | Human | Pancreas | PDAC | 1.03e-11 | 6.33e-01 | 0.3728 |
| 2823 | GPM6A | HTA12-29-1 | Human | Pancreas | PDAC | 1.61e-18 | 6.01e-01 | 0.3722 |
| Page: 1 |
| Tissue | Expression Dynamics | Abbreviation |
| Lung | 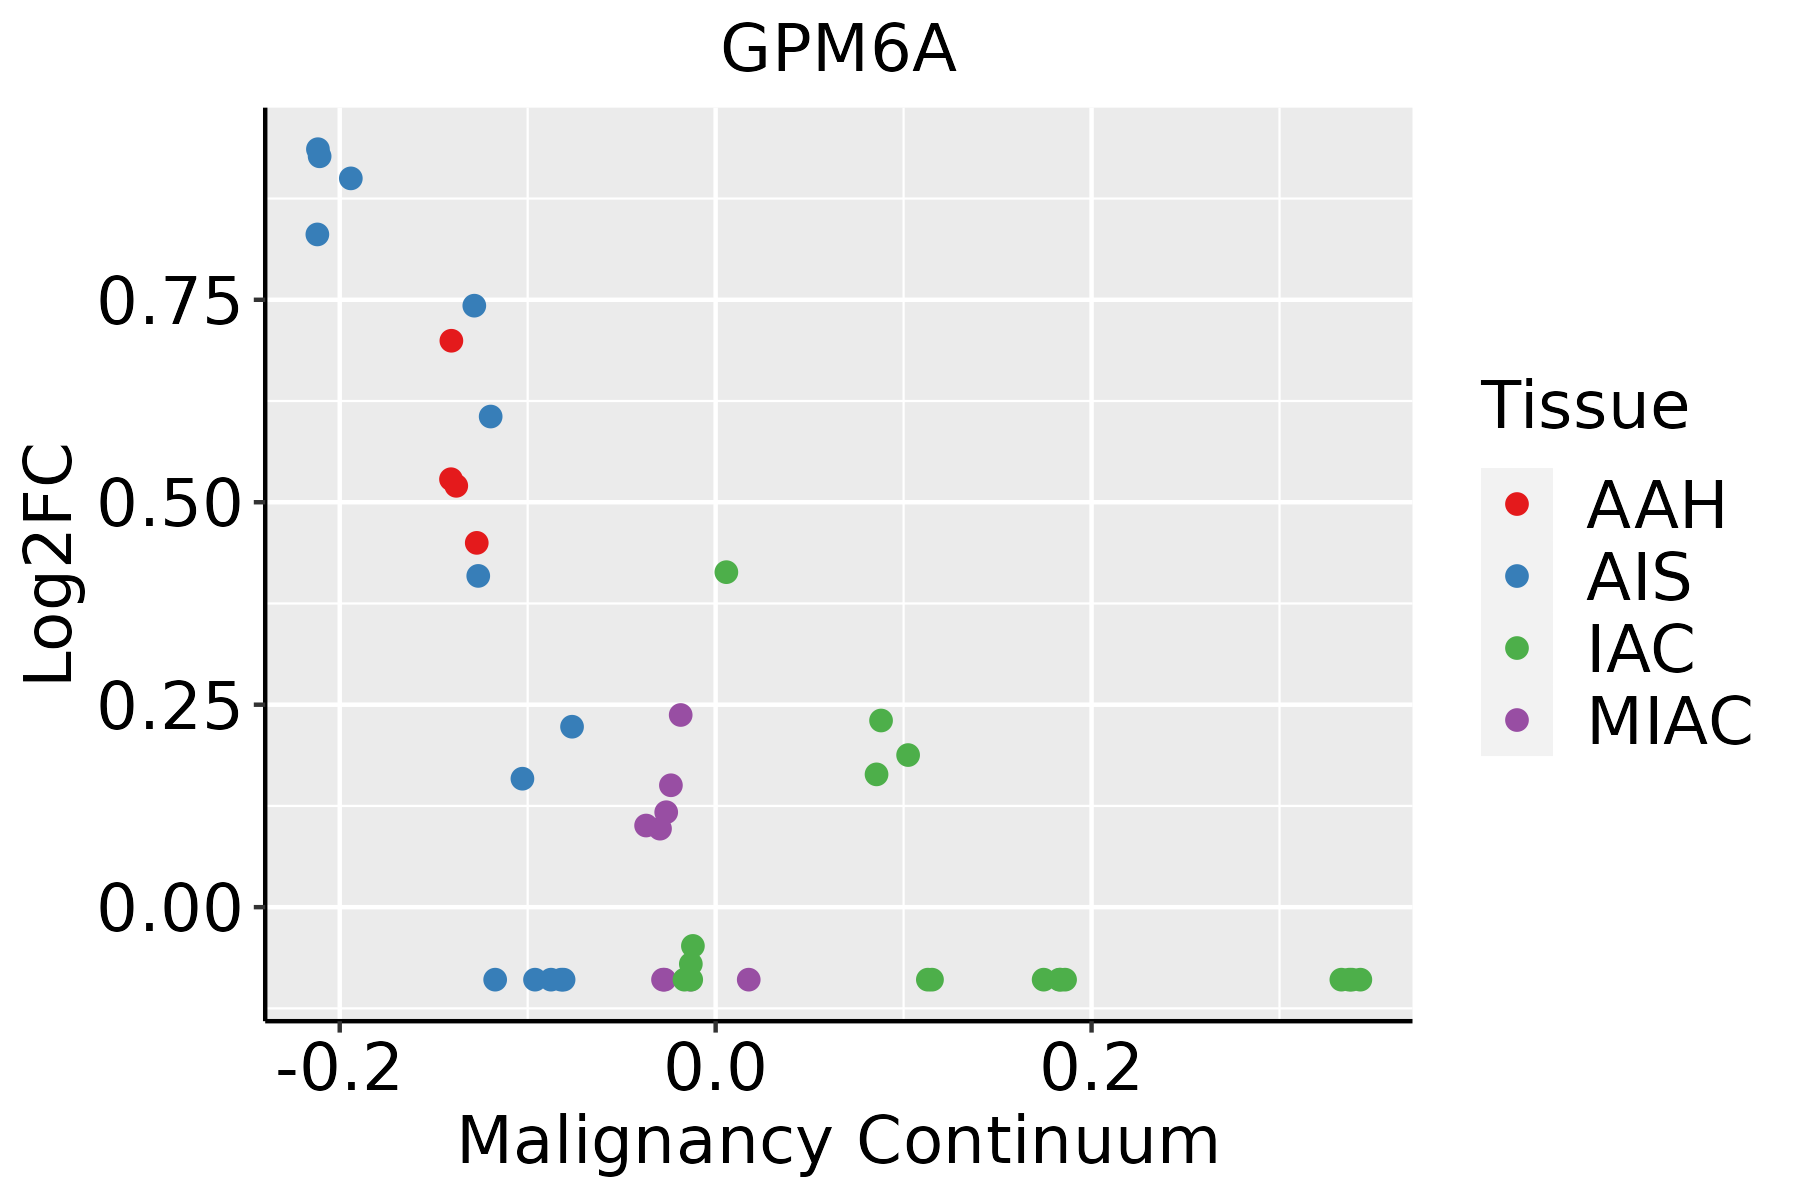 | AAH: Atypical adenomatous hyperplasia |
| AIS: Adenocarcinoma in situ | ||
| IAC: Invasive lung adenocarcinoma | ||
| MIA: Minimally invasive adenocarcinoma |
| ∗log2FC in expression of this searched gene in stem-like cells from each diseased tissue sample relative to stem-like cells in normal samples in each tissue plotted against the malignancy continuum. Samples are colored based on if they are from different disease stage. |
Top |
Malignant transformation related pathway analysis |
| Find out the enriched GO biological processes and KEGG pathways involved in transition from healthy to precancer to cancer |
| Tissue | Disease Stage | Enriched GO biological Processes |
| Colorectum | AD |  |
| Colorectum | SER |  |
| Colorectum | MSS |  |
| Colorectum | MSI-H |  |
| Colorectum | FAP |  |
| ∗Top 15 enriched GO BP terms are showed in the bar plot of each disease state in each tissue. Each row represents a significant GO biological process which is colored according to the -log10(p.adjust). |
| Page: 1 2 3 4 5 6 7 8 9 |
| GO ID | Tissue | Disease Stage | Description | Gene Ratio | Bg Ratio | pvalue | p.adjust | Count |
| GO:003432912 | Lung | AIS | cell junction assembly | 84/1849 | 420/18723 | 2.16e-10 | 5.71e-08 | 84 |
| GO:012003213 | Lung | AIS | regulation of plasma membrane bounded cell projection assembly | 37/1849 | 186/18723 | 2.67e-05 | 8.60e-04 | 37 |
| GO:006049113 | Lung | AIS | regulation of cell projection assembly | 37/1849 | 188/18723 | 3.41e-05 | 1.05e-03 | 37 |
| GO:004886312 | Lung | AIS | stem cell differentiation | 39/1849 | 206/18723 | 5.25e-05 | 1.51e-03 | 39 |
| GO:003134612 | Lung | AIS | positive regulation of cell projection organization | 57/1849 | 353/18723 | 1.38e-04 | 3.05e-03 | 57 |
| GO:005080811 | Lung | AIS | synapse organization | 63/1849 | 426/18723 | 7.39e-04 | 1.07e-02 | 63 |
| GO:00468471 | Lung | AIS | filopodium assembly | 14/1849 | 62/18723 | 2.46e-03 | 2.55e-02 | 14 |
| GO:0006816 | Lung | AIS | calcium ion transport | 58/1849 | 422/18723 | 6.08e-03 | 4.98e-02 | 58 |
| Page: 1 |
| Pathway ID | Tissue | Disease Stage | Description | Gene Ratio | Bg Ratio | pvalue | p.adjust | qvalue | Count |
| Page: 1 |
Top |
Cell-cell communication analysis |
| Identification of potential cell-cell interactions between two cell types and their ligand-receptor pairs for different disease states |
| Ligand | Receptor | LRpair | Pathway | Tissue | Disease Stage |
| Page: 1 |
Top |
Single-cell gene regulatory network inference analysis |
| Find out the significant the regulons (TFs) and the target genes of each regulon across cell types for different disease states |
| TF | Cell Type | Tissue | Disease Stage | Target Gene | RSS | Regulon Activity |
| ∗The dot plots of a searched regulon are shown for all cell subpopulations in each disease state of each tissue based on the regulon specific score inferred using pySCENIC and by calculating the average expression. |
| Page: 1 |
Top |
Somatic mutation of malignant transformation related genes |
| Annotation of somatic variants for genes involved in malignant transformation |
| Hugo Symbol | Variant Class | Variant Classification | dbSNP RS | HGVSc | HGVSp | HGVSp Short | SWISSPROT | BIOTYPE | SIFT | PolyPhen | Tumor Sample Barcode | Tissue | Histology | Sex | Age | Stage | Therapy Types | Drugs | Outcome |
| GPM6A | SNV | Missense_Mutation | rs747350726 | c.382N>A | p.Ala128Thr | p.A128T | P51674 | protein_coding | tolerated(0.08) | possibly_damaging(0.629) | TCGA-A8-A06X-01 | Breast | breast invasive carcinoma | Female | >=65 | I/II | Unknown | Unknown | SD |
| GPM6A | insertion | Frame_Shift_Ins | novel | c.502_503insATGAACAAACTATATTT | p.Val168AspfsTer22 | p.V168Dfs*22 | P51674 | protein_coding | TCGA-A8-A08F-01 | Breast | breast invasive carcinoma | Female | <65 | III/IV | Chemotherapy | 5-fluorouracil | CR | ||
| GPM6A | SNV | Missense_Mutation | c.658N>A | p.Gly220Arg | p.G220R | P51674 | protein_coding | deleterious(0) | possibly_damaging(0.877) | TCGA-BI-A0VR-01 | Cervix | cervical & endocervical cancer | Female | <65 | III/IV | Unknown | Unknown | SD | |
| GPM6A | SNV | Missense_Mutation | c.817N>T | p.Arg273Trp | p.R273W | P51674 | protein_coding | deleterious(0.02) | probably_damaging(0.99) | TCGA-AA-3950-01 | Colorectum | colon adenocarcinoma | Female | >=65 | I/II | Unknown | Unknown | SD | |
| GPM6A | SNV | Missense_Mutation | c.185N>C | p.Phe62Ser | p.F62S | P51674 | protein_coding | deleterious(0) | probably_damaging(0.996) | TCGA-AD-5900-01 | Colorectum | colon adenocarcinoma | Male | >=65 | I/II | Unknown | Unknown | SD | |
| GPM6A | SNV | Missense_Mutation | novel | c.517N>A | p.Leu173Ile | p.L173I | P51674 | protein_coding | tolerated(0.62) | probably_damaging(0.994) | TCGA-AZ-4315-01 | Colorectum | colon adenocarcinoma | Male | <65 | I/II | Unknown | Unknown | SD |
| GPM6A | SNV | Missense_Mutation | novel | c.9N>T | p.Glu3Asp | p.E3D | P51674 | protein_coding | tolerated_low_confidence(0.14) | benign(0.048) | TCGA-AZ-4315-01 | Colorectum | colon adenocarcinoma | Male | <65 | I/II | Unknown | Unknown | SD |
| GPM6A | SNV | Missense_Mutation | rs116256200 | c.806G>A | p.Arg269His | p.R269H | P51674 | protein_coding | deleterious(0.01) | probably_damaging(0.987) | TCGA-QG-A5YV-01 | Colorectum | colon adenocarcinoma | Female | <65 | III/IV | Chemotherapy | xeloda | CR |
| GPM6A | SNV | Missense_Mutation | c.540T>A | p.Phe180Leu | p.F180L | P51674 | protein_coding | tolerated(0.05) | benign(0.06) | TCGA-AG-3892-01 | Colorectum | rectum adenocarcinoma | Female | <65 | I/II | Unknown | Unknown | SD | |
| GPM6A | SNV | Missense_Mutation | novel | c.9N>T | p.Glu3Asp | p.E3D | P51674 | protein_coding | tolerated_low_confidence(0.14) | benign(0.048) | TCGA-AG-A002-01 | Colorectum | rectum adenocarcinoma | Male | <65 | I/II | Unknown | Unknown | SD |
| Page: 1 2 3 4 5 6 7 |
Top |
Related drugs of malignant transformation related genes |
| Identification of chemicals and drugs interact with genes involved in malignant transfromation |
| (DGIdb 4.0) |
| Entrez ID | Symbol | Category | Interaction Types | Drug Claim Name | Drug Name | PMIDs |
| Page: 1 |

Copyright 2023-Present -The University of Texas Health Science Center at Houston |